Total US Debt And The Gold Price


After rising together through 2012, the past five years have seen a massive divergence between the total amount of accumulated U.S. government debt and the price of COMEX gold. When, if ever, will we see this correlation reappear?
After falling together through the late 1990s, the price of COMEX god and the total accumulated U.S. debt began to rise together since 2002. With the help of Nick Laird at GoldChartsRUs, we've been able to plot this relationship on the chart below:
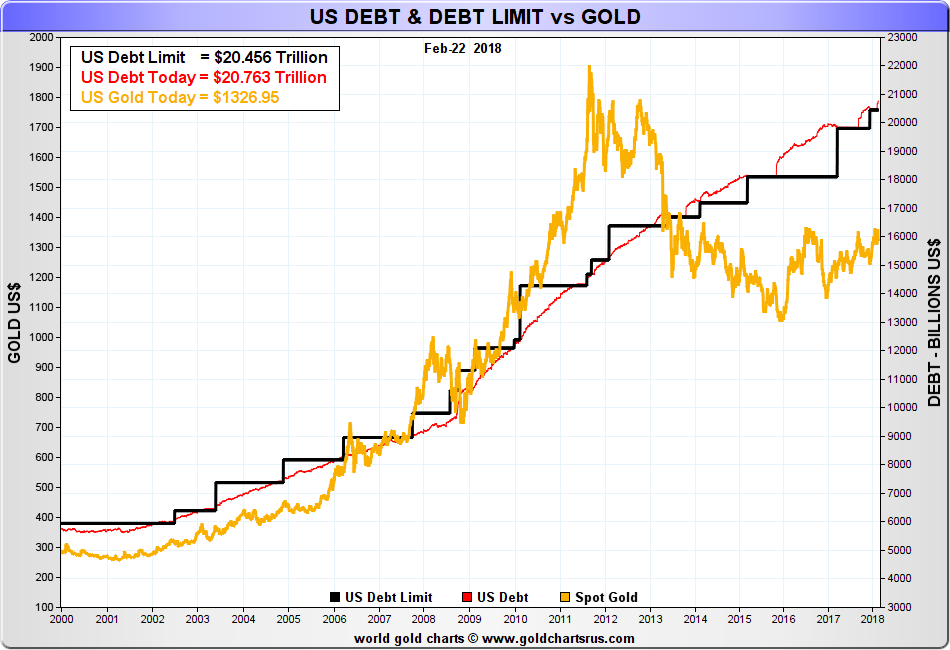
As you'll recall, and as you can see in the chart above, massive U.S. military efforts and the economic collapse during The Great Financial Crisis led to a surge in the total US debt from $6T to $15T in the ten years between 2003-2012. And what happened to the price of COMEX gold over the same time period? It moved up from $400 to $1,800 per ounce.
However, a (not so) funny thing happened in late 2012. The price of COMEX gold began to consistently fall, this despite the over $1T QE3 program that The Fed ran from late 2012 to early 2014 AND a continuing surge in total U.S. debt from $15T to $20T.
Of course, we can debate WHY and HOW this occurred, but that's a topic for another day. For now, let's just take another good, long look at that chart of total debt and gold.
It could be said that, beginning with The Great Financial Crisis, gold got ahead of itself. Price had consistently risen with the accumulated debt through 2009 but, by 2011, it was considerably above the established trend. In the correction that followed and ended in 2015, you might note that price fell to roughly the same distance below the established trend. Perhaps this visual aid will help?
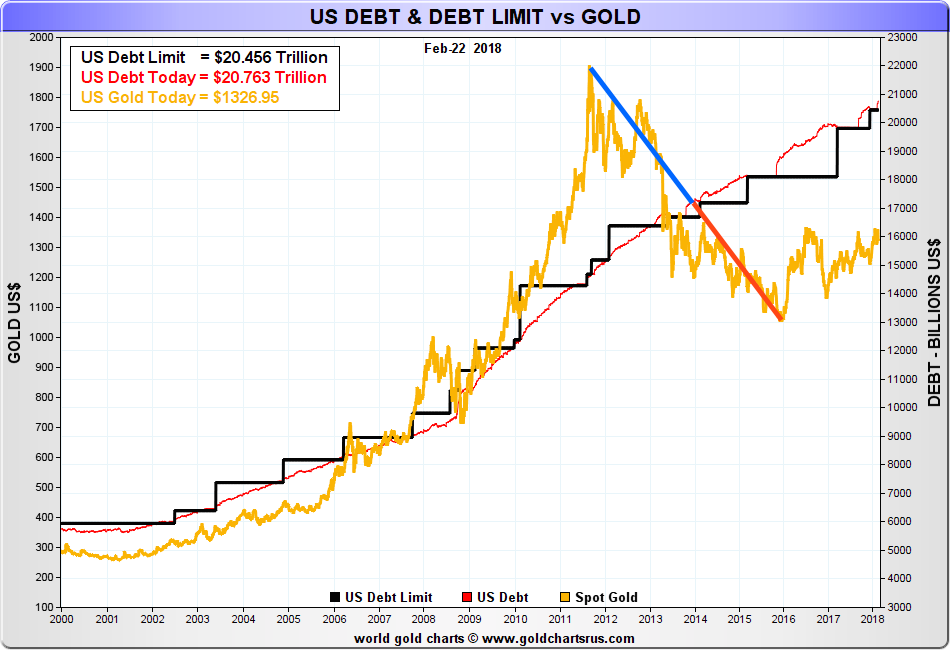
Simply put, it now appears that the price pendulum had swung just as far downward in 2015 as it had swung upward in 2011. Thus it could also be said that if gold was overvalued in 2011, it was equally undervalued in 2015.
So, now the question becomes: where does price go from here? In the months ahead, will price at least move back to the apparent median line of the accumulated U.S. debt? If so, that would imply something back around $1,800 or $1,900. Could it move to another bullish extreme, as in 2010-2011? Another financial crisis could cause such a run, and that would imply something closer to $2,500.
What we know for certain is that the total level of accumulated U.S. debt isn't going to be slowing anytime soon. Two weeks ago, President Trump released his first budget plan, and it projected $1T+ deficits through 2022, with total debt rising to a minimum of $25T over that same period.

In your mind's eye, project forward another $5T in debt on the gold-debt chart, and then picture where the price of gold might be if it simply tracks parallel to the debt. Next, picture where the gold price would be if it surges again in a manner similar to 2010-2011.
What's the point of all this? In the end, many gold investors have grown frustrated and impatient over the last five years. However, the U.S. fiscal situation has only worsened over the same time period, and given the $1T+ deficits that reach as far as the eye can see, it will only continue to deteriorate in the years ahead.
Yes, the price of COMEX gold is down over 30% from its peak in 2011, but it is still up nearly 400% over the past 15 years. As a tool to protect you from the monetary madness of the debt-based, fiat currency system, gold has performed admirably, even when considering this current "swing of the pendulum." When price and sentiment inevitably swing back in a manner similar to 2010-2011, you're going to want to be along for the ride. Thus, 2018 is not the time to capitulate. Instead, it is time to recognize once again the economic realities of the failing Keynesian experiment and prepare accordingly.
|
|
Our Ask The Expert interviewer Craig Hemke began his career in financial services in 1990 but retired in 2008 to focus on family and entrepreneurial opportunities. Since 2010, he has been the editor and publisher of the TF Metals Report found at TFMetalsReport.com, an online community for precious metal investors. |
The views and opinions expressed in this material are those of the author as of the publication date, are subject to change and may not necessarily reflect the opinions of Sprott Money Ltd. Sprott Money does not guarantee the accuracy, completeness, timeliness and reliability of the information or any results from its use.
********
 Craig Hemke began his career in financial services in 1990 but retired in 2008 to focus on family and entrepreneurial opportunities. Since 2010, he has been the editor and publisher of the TF Metals Report found at TFMetalsReport.com, an online community for precious metal investors.


