Two Bear Hunts And A Bear Trap


The ongoing Battle of Wall Street has entered a new phase last week. Until recently, with few exceptions, it was mostly the Bears who were on the offensive. The covert Bulls were content to keep their defense of the market quiet, doing just enough to maintain a bit of momentum, but ready to step in when needed to halt a sudden raid. Last week, the Bulls decided enough was enough and launched their own offensive. That attack took the DJIA by Friday up by almost 1400 points on the week.
The Covid pandemic remains front and centre on the global stage, with international stresses and trade and logistical problems and high inflation unable to push Covid news back into a corner of the news radar. The new Omicron variant is dominant in the news as it spreads across the world at a high rate of infection.
The Social Media propaganda machine tried hard to sell the idea that one symptom of Omicron is myocarditis, the cause of so many athlete deaths, as if the vaccines had nothing to with these deaths. This as if Omicron had silently been infecting athletes for much longer than the time since its discovery last month. This rumour has now been put to bed when the WHO announced yesterday that there has not been one death that was ascribed to an Omicron infection. In South Africa more than 80% of the positive hospital admissions were people going to hospital with other complaints than having Covid symptoms. This weakened variant, on the other hand, could be a boon for society if it should result in natural immunity and then spread wide enough to induce herd immunity in the population.
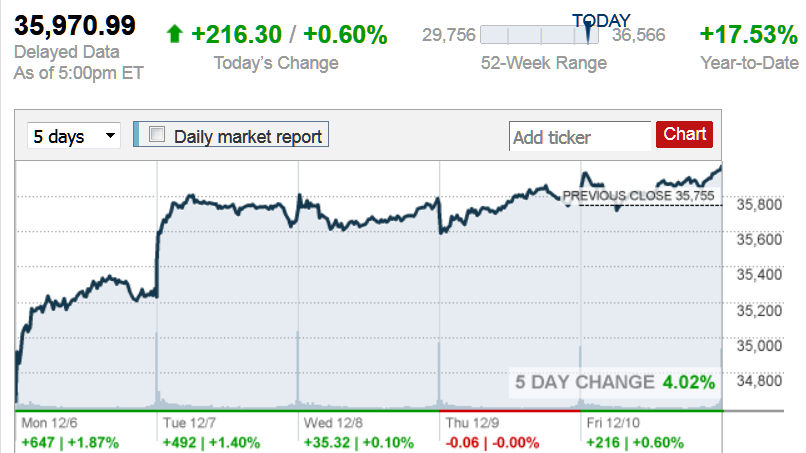
The two charts below illustrate the counter by the Bulls to the recent constant selling by the Bears, who clearly are concerned about their equity investments and want to get out of Wall Street, at the risk of precipitating a sell-off. Given increasing concern about the high valuations and the evidence of increasing inflation, many investors are considering moving assets to safe havens. If the recent trickle of selling became a flood, it could be as difficult as in 2009, 2018 and 2020 to reverse the trend.
The saying that attack is the best defence, was put to the test last week, starting on Monday and with good results by the end of the week, as noted. The CNN chart of the DJIA trading below shows that on Monday and Tuesday the Bulls dominated the stock market right from the opening through to the early afternoon on Monday and about midday on Tuesday, apparently buying every offer in sight.
On Monday, after the weak performance late the previous week, the sellers were out in force, taking advantage of increasing prices to keep on selling. When it began to sink in that the Bulls were rampant and taking out all offers, the selling abated to keep the DJIA mostly sideways. The resumed buying on Tuesday scared off the sellers earlier during the day to have the market again settling mostly sideways with a late increase in selling shortly before the close. On Wednesday the Bulls waited to see what would happen, while the Bears were mostly licking their wounds. Selling was nevertheless high during those three days, with the Dow30 turnover well above the daily average.
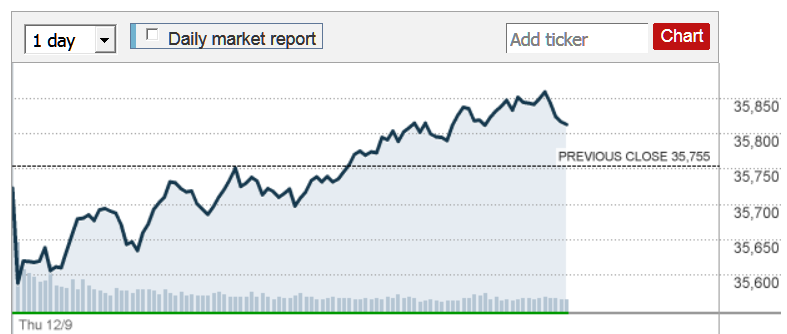
Thursday saw the Bears testing the resolve of the Bulls with a spirited amount of selling right off the bell, as also shown in the chart below. The initial period of high trading volume illustrates the effort it required to stop and reverse the selling into a steadily increasing trend. Once the DJIA went positive on the day, sellers retreated until they returned near the close to have the market slightly down on the day to still count it as a victory for the bulls.
On Friday, the Bulls were in early, but yielded later temporarily to the pre-weekend increase in selling, only to resume rally later in the day, as shown in the upper chart. The turnover in the Dow30 was again well above the average on Friday and the S&P reached a new all-time high.
While Monday and Tuesday saw the Bulls on the attack from the opening, hunting down the Bears in an orgy of buying everything in sight, Wednesday – while still a day of heavy trading with above average volume – was relatively quiet in terms of steep trends. The rather quiet day lulled the Bears into grasping the opportunity on Thursday, when the Bulls appeared mostly absent at the opening, to mount a raid. It happened to be a bear trap that slammed shut after high volume during the opening minutes as the Bears thought they could control the market.
The trap was followed by a rising trend that was a battle of attrition on the Bears, where every attempt to begin selling again was suddenly reversed with the DJIA achieving a new high, until it went positive on the day. Many stops were triggered, while all the old shorts are sitting on steep losses. The Bears are either being tamed or they are on the way back, scurrying home to their caves.
The general assumption in market theory is that prices react to fresh news and that news is freely available to all interested parties. As a consequence, prices change in random fashion on whether the latest news is positive or negative for the market. It means that the same news that influences the futures market up to the Wall Street open is in effect right at that time. This does not explain the divergence between the DJIA and the S&P500 as discussed last week or the sudden and sustained acceleration in the DJIA right off the market open as happened on Monday and Tuesday. The very high volume shows that the sellers did not share whatever ‘news’ brought the buyer(s) out in force.
The hypothesis of a major buying force intent on protecting Wall Street far better fits what is and has been happening, rather than being a normal market with intermittent weakness and recovery. It is however disturbing there has not been a recent event similar to the March 2020 sell-off mode on Covid and previous sudden bear spikes when the panic could be stopped and reversed by massive buying.
Will it be possible under current circumstances to do again effect a halt and recovery if there is a major panic? A single major collapse could do much more lasting damage than letting the stock market find its own equilibrium at a lower level in a series of small declines, which is clearly not being allowed to happen. I fear someone is playing with matches in a fuel depot.
Euro–Dollar
The Euro’s steep rebound off the junction of lines W, E and S failed to extend higher as the brief dollar weakness ended and steadied. The recent dollar rally is fortuitous for Wall Street during this time when equities were under selling pressure. The bottom support of steep bull channel KL is being tested, and a sideways to lower break from the channel will imply that the dollar is going to maintain its level or strengthen even further. Holding to the steep channel will be good for the euro and the metals.
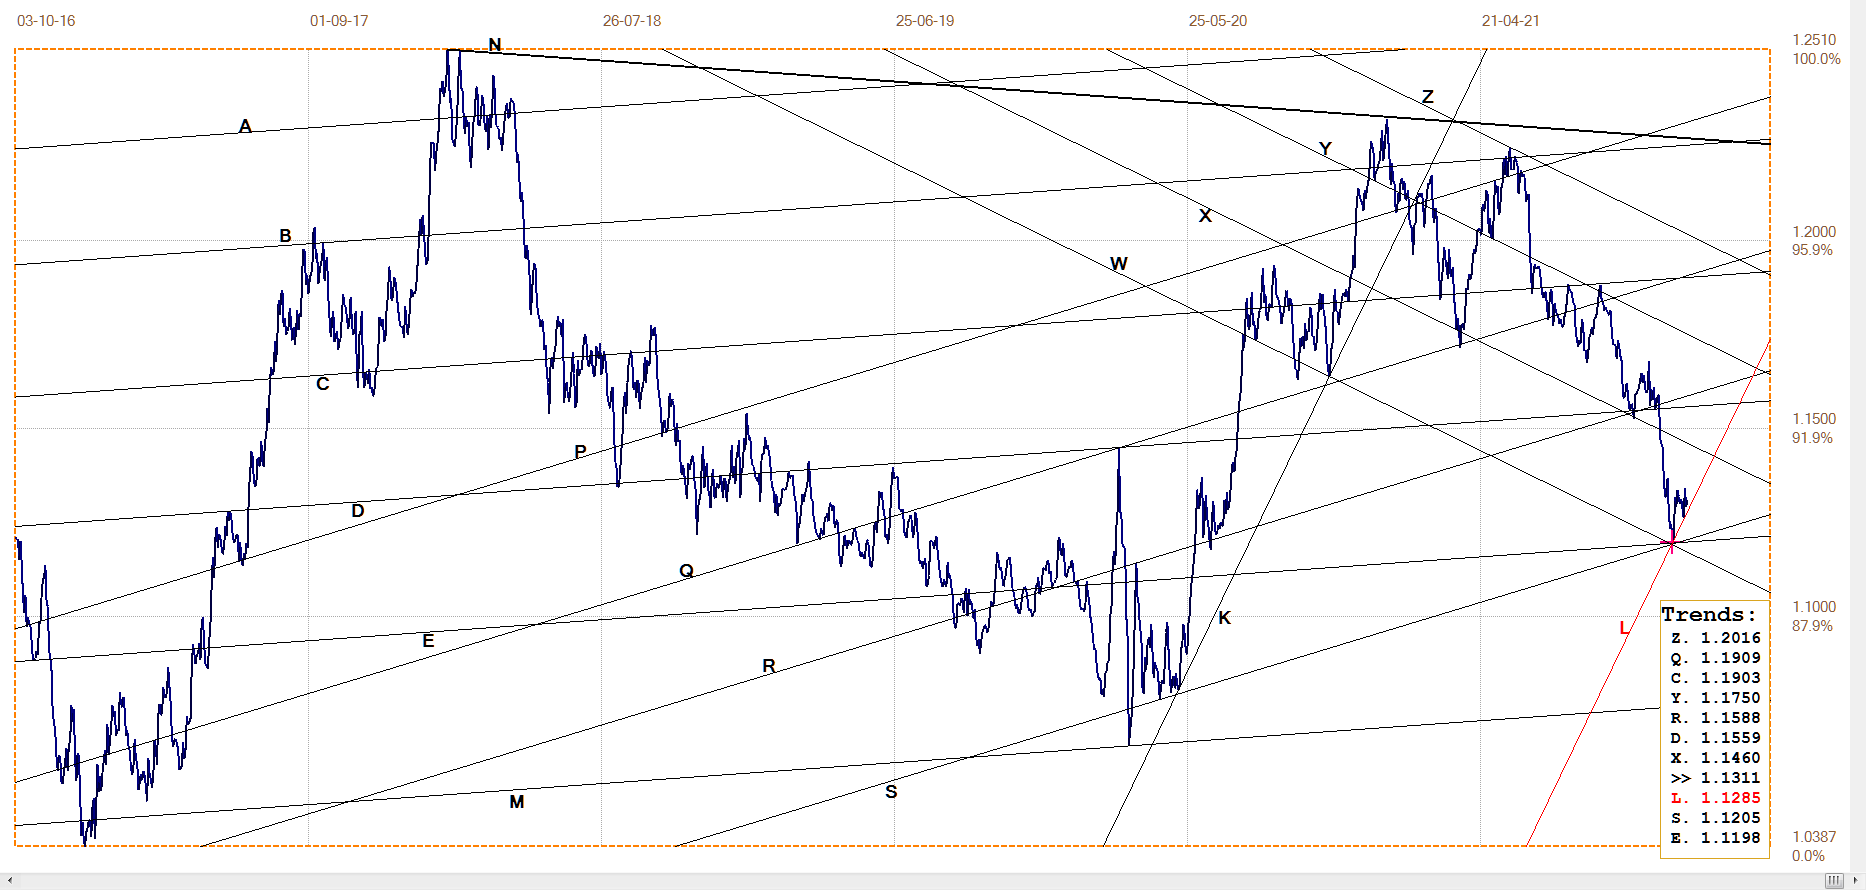
Euro–dollar, last = $1.1311 (www.investing.com)
DJIA daily close
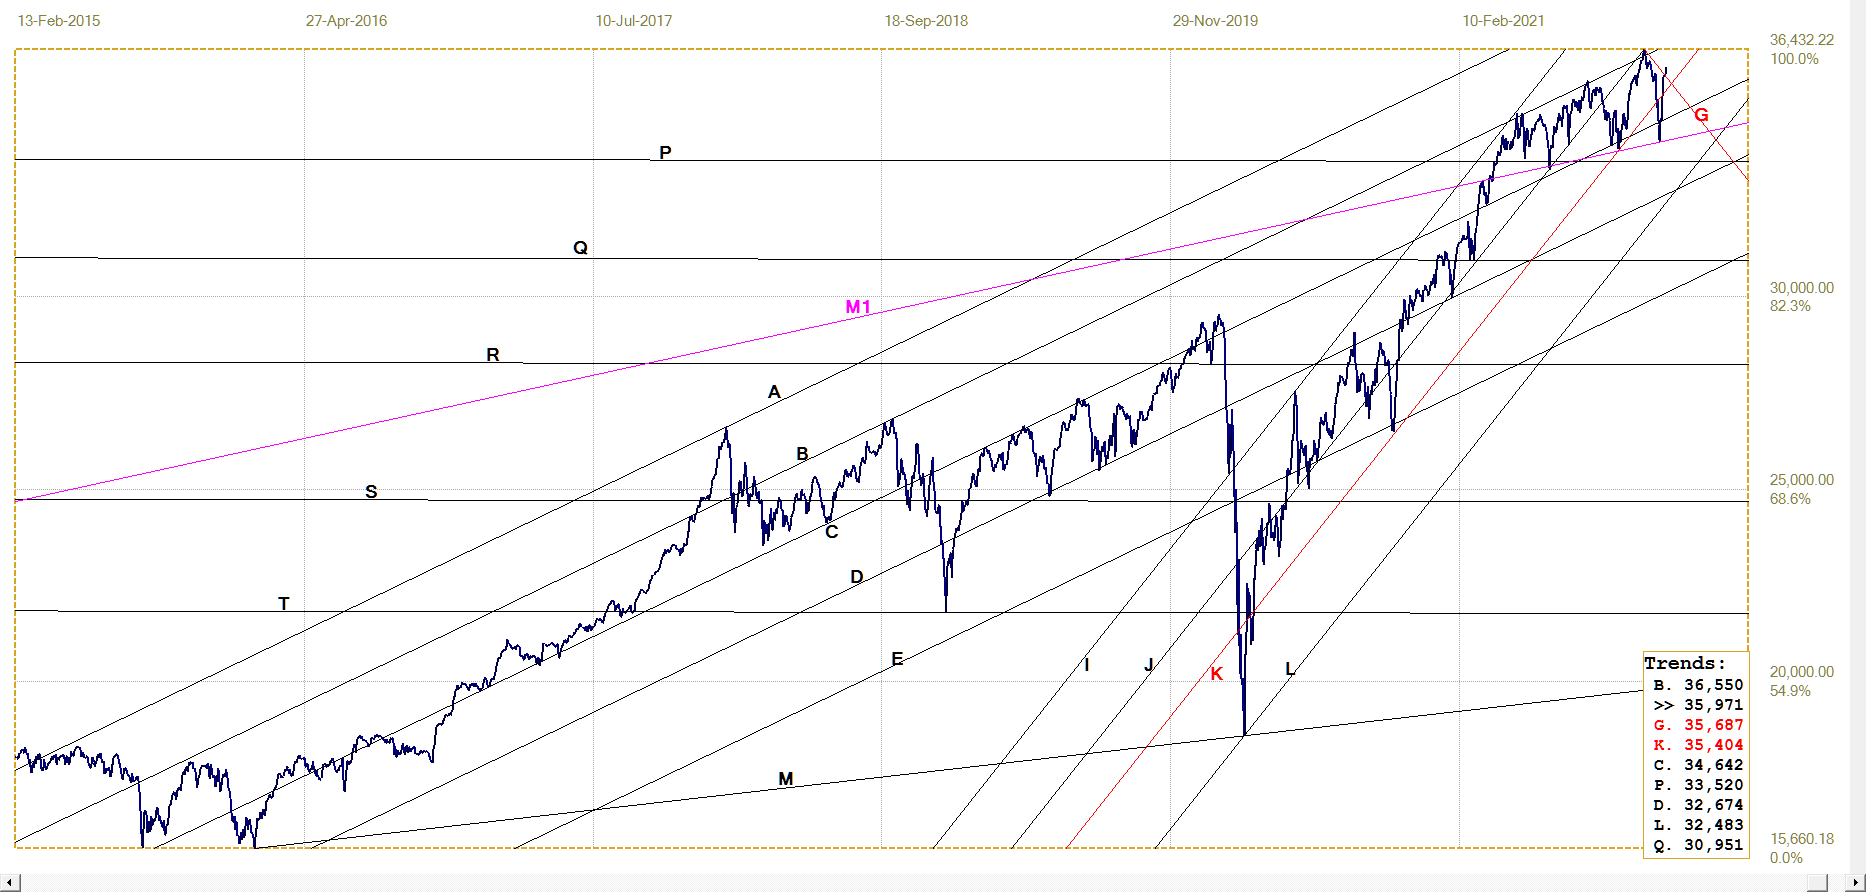
DJIA. last = 35970.99 (money.cnn.com)
The still minor break above line G is nevertheless an indication that support for Wall Street is still around and that the stock market could move higher. The DJIA might even join the S&P500 in achieving yet another all time high.
The pink line M1 is not one of the derived trend lines of master line M; it was drawn as an independent master gradient to illustrate that the top formation between lines B and M1 developed as a rising megaphone. Megaphones are unstable formations and these develop when a market is subject to strong opposing forces. Megaphones consist of steep trends and sharp reversals. The price breaks from the pattern when one of the forces gains dominance, so that the resulting move tends to be steep and sustained. For a rising megaphone, the break more often than not is bearish. Unlike narrowing chart formations, such as triangles and wedges, there is no specific count of the number of legs on which to anticipate the time of the break.
Gold London PM fix – Dollars
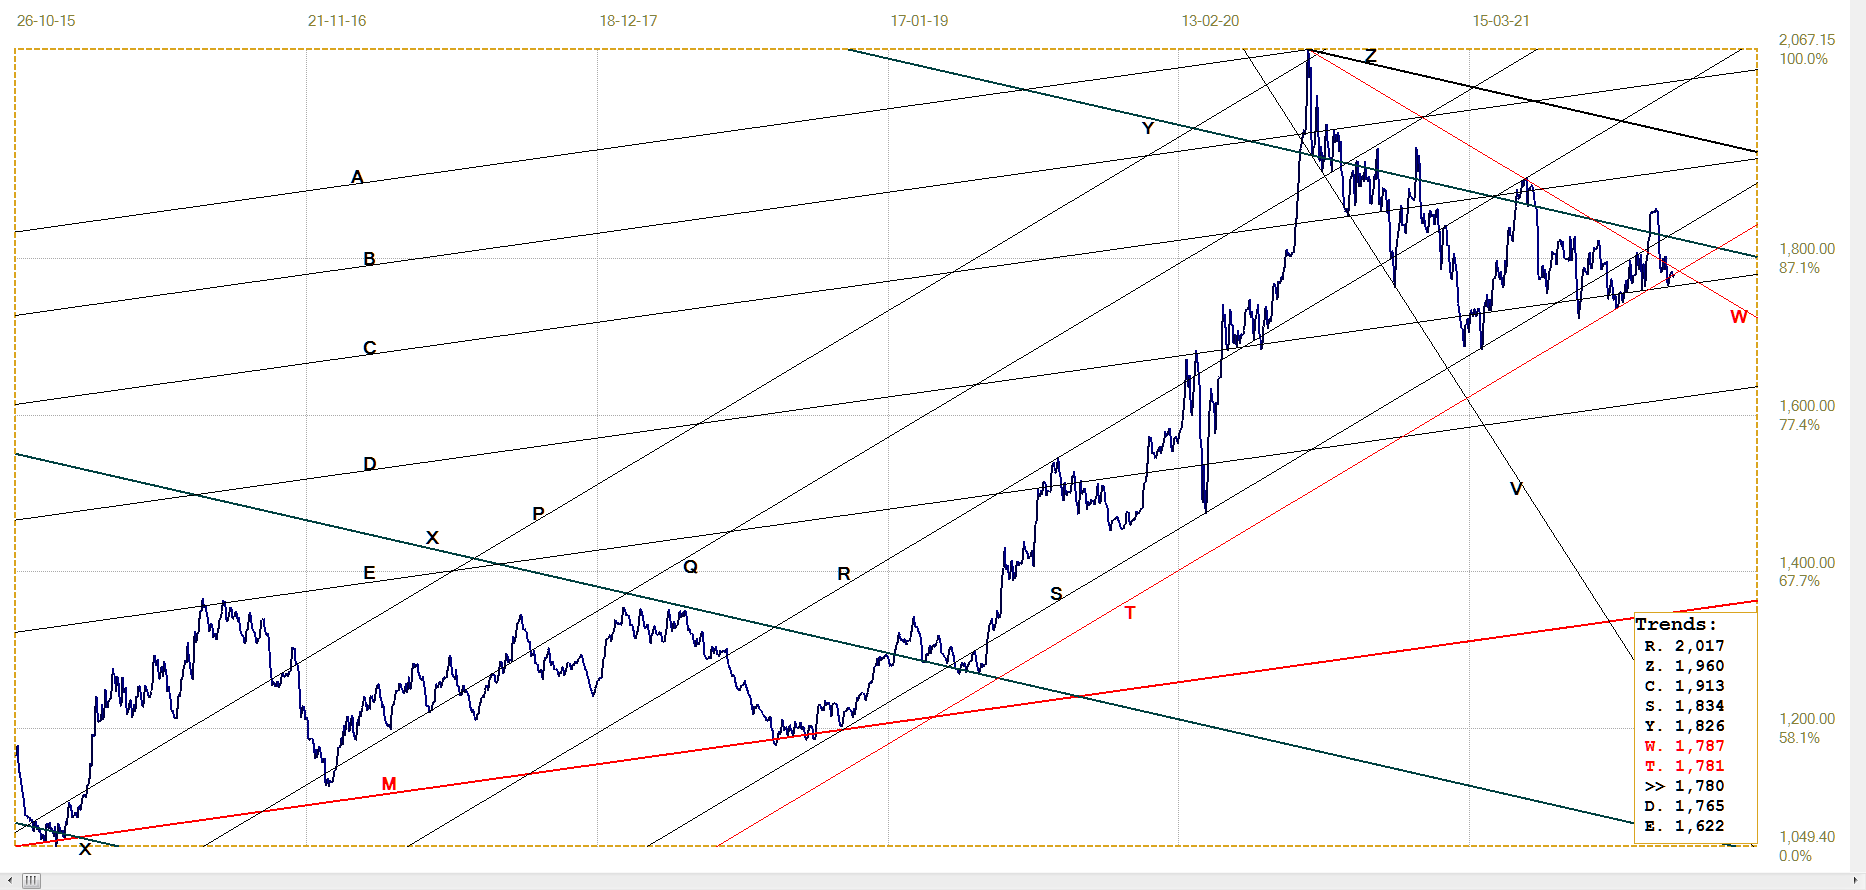
Gold price – London PM fix, last = $1779.75 (www.kitco.com)
The price of gold has formed a descending megaphone, VW, with similar comments as for the DJIA, except that the trend of this megaphone is reversed. Here the direction implies that the break will be to the upside, as has already happened, yet could not be sustained. In that sense, gold, like the euro, is also collateral damage for the stronger dollar that was needed to inspire confidence in the US economy and the stock market during a critical time.
This also happens to be a critical moment for the price of gold. Should there develop a confirmed break below main bull channel PQRST as well as below support along line C, it would have the price of gold in a medium to longer term sideways to even bearish trend as a consequence. On the other hand, should the price recover into channel RST and then manage a new break above the megaphone, December and early 2022 will have gold bulls smiling.
Euro–gold PM fix
The rally in the euro price of gold reversed sharply when the dollar price of gold fell steeply under the advances in the dollar, which decline exceeded the positive effect of the weaker euro on its price of gold. At least the price held within bull channel QR to recover above line Y. As long as this channel and break holds, the implication is that the dollar price of gold should hold steady and improve over time.
Here too is a rising megaphone, PE. In this case the probability of actually breaking higher above the megaphone appears slim, because of the steepness of line P. The chart pattern is nevertheless bullish while it holds, with potential for a steep sustained
rally to take off at some time, extending higher in channel PQR.
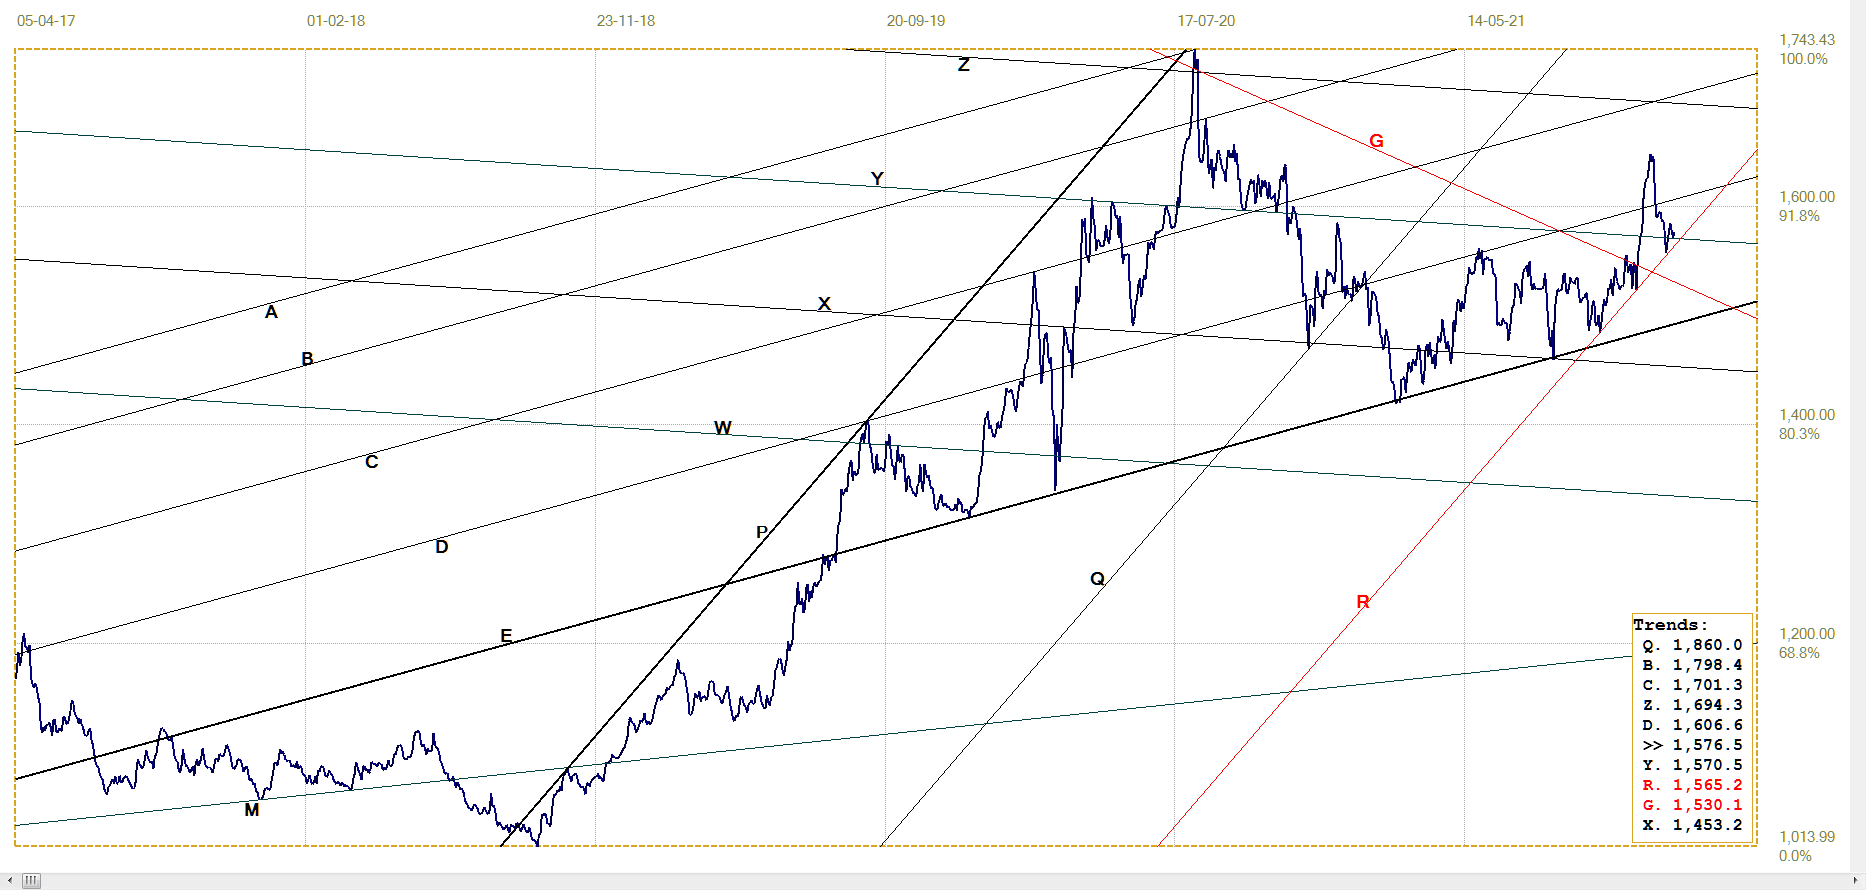
Euro gold price – PM fix in Euro. Last = €1576.50 (www.kitco.com)
Silver Daily London Fix
Last week’s comment, “The recent firm support for a spike bottom reversal was at line H at $21.27, more than a dollar below Friday’s London fix, which at least is a positive trend; that is, if the support at line D continues to hold,” was premature, as support at line D has failed to hold. The break lower ended at line Q, which offers gold another chance to reverse off technical support. With silver as much under pressure as it is, there can be no guarantees it will do so. The break below bull channel JKL was already a warning of new weakness, which could still extend if line Q gives way.
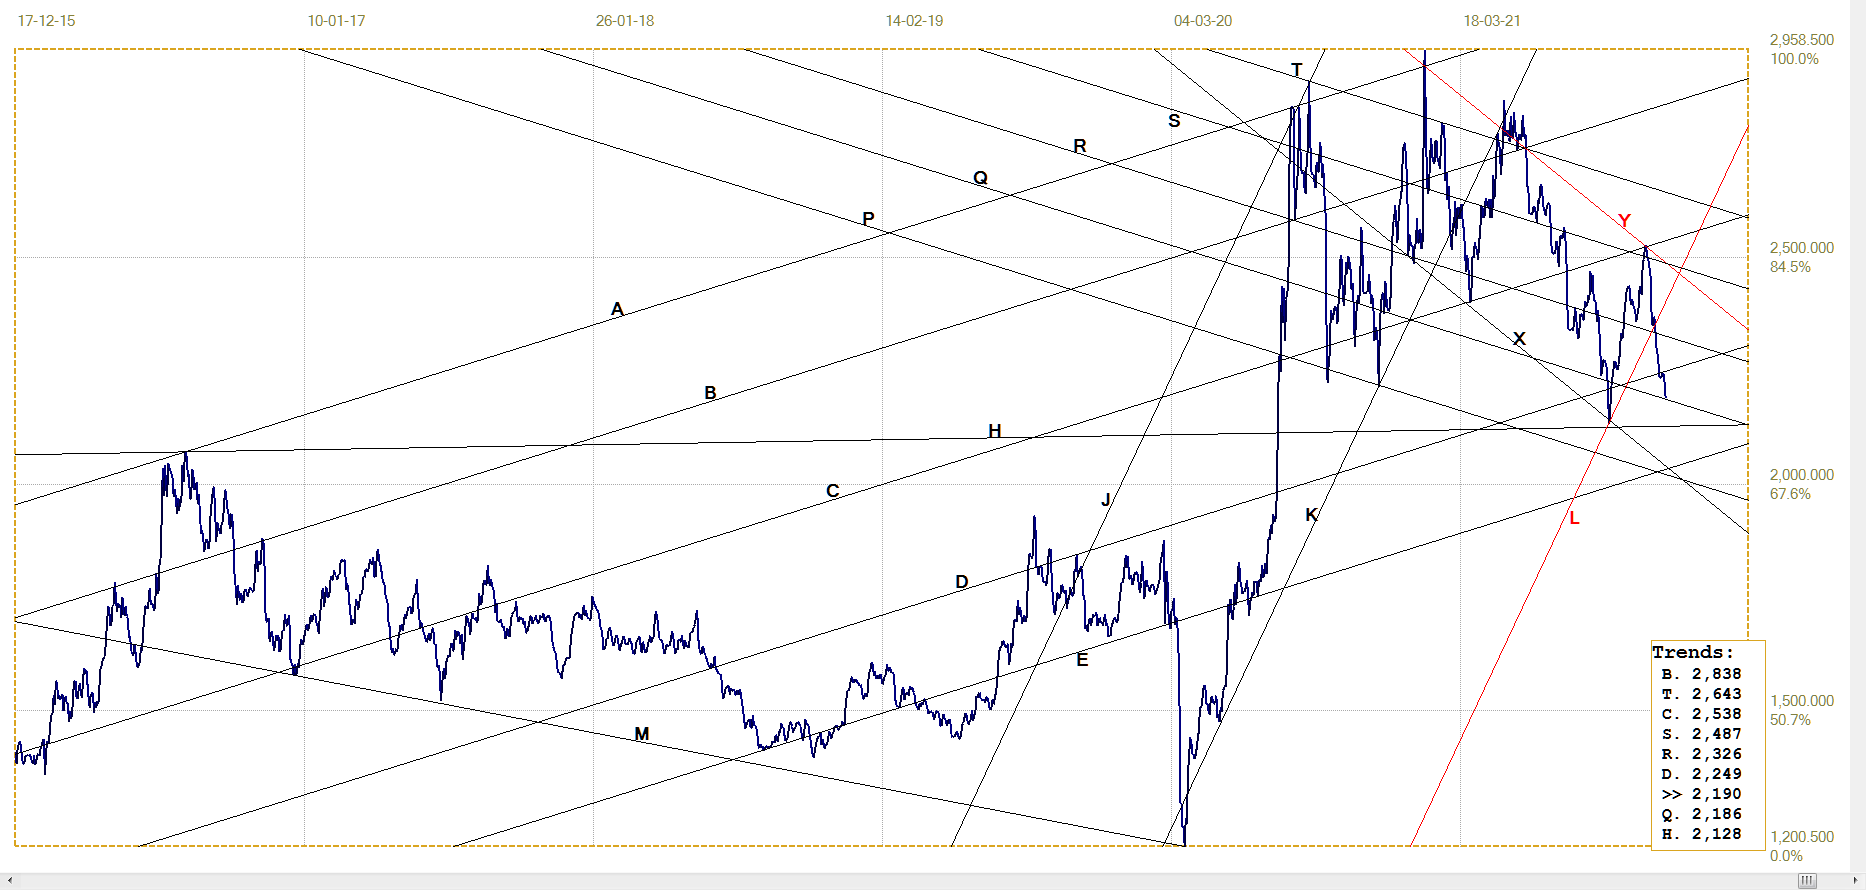
Silver daily London fix, last = $21.895 (www.kitco.com)
U.S. 10–year Treasury Note
The break below flat topped triangle RL and also bull channel JKL was a bit of a surprise seeing that inflation is so rampant. The possibility us that the break was a result of a switch by investors from Wall Street to the bond market. However, the sudden reversal of the yield back to barely within channel KL, suggests that it was only a brief diversion from the anticipated behaviour of the bond market.
The somewhat unlikely possibility that the return to line L could be a goodbye kiss on the bull channel before the yield extends lower again, has to be mentioned. It will be a really strange bond market that rallies in the face of higher inflation, except if the supposition that investors are seeing bonds as a lesser evil than equities implies a major exodus of funds out of Wall Street and into the ‘safer’ haven of bonds.
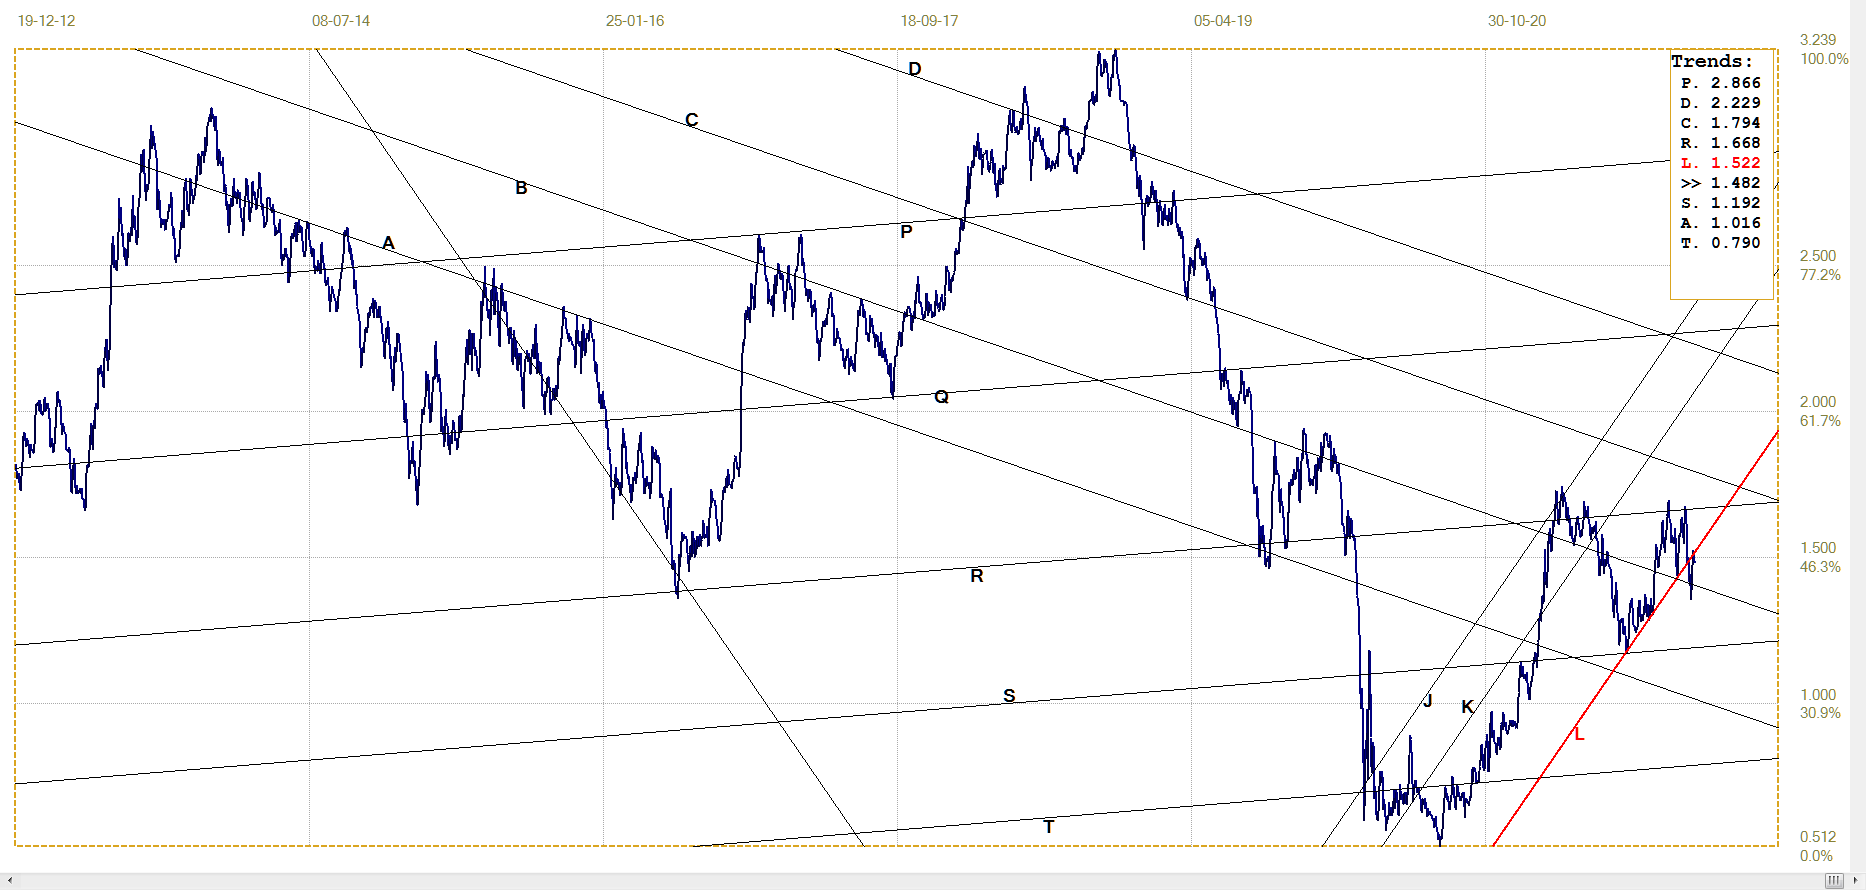
10–year Treasury note, last = 1.482% (Investing.com )
West Texas Intermediate crude. Daily close
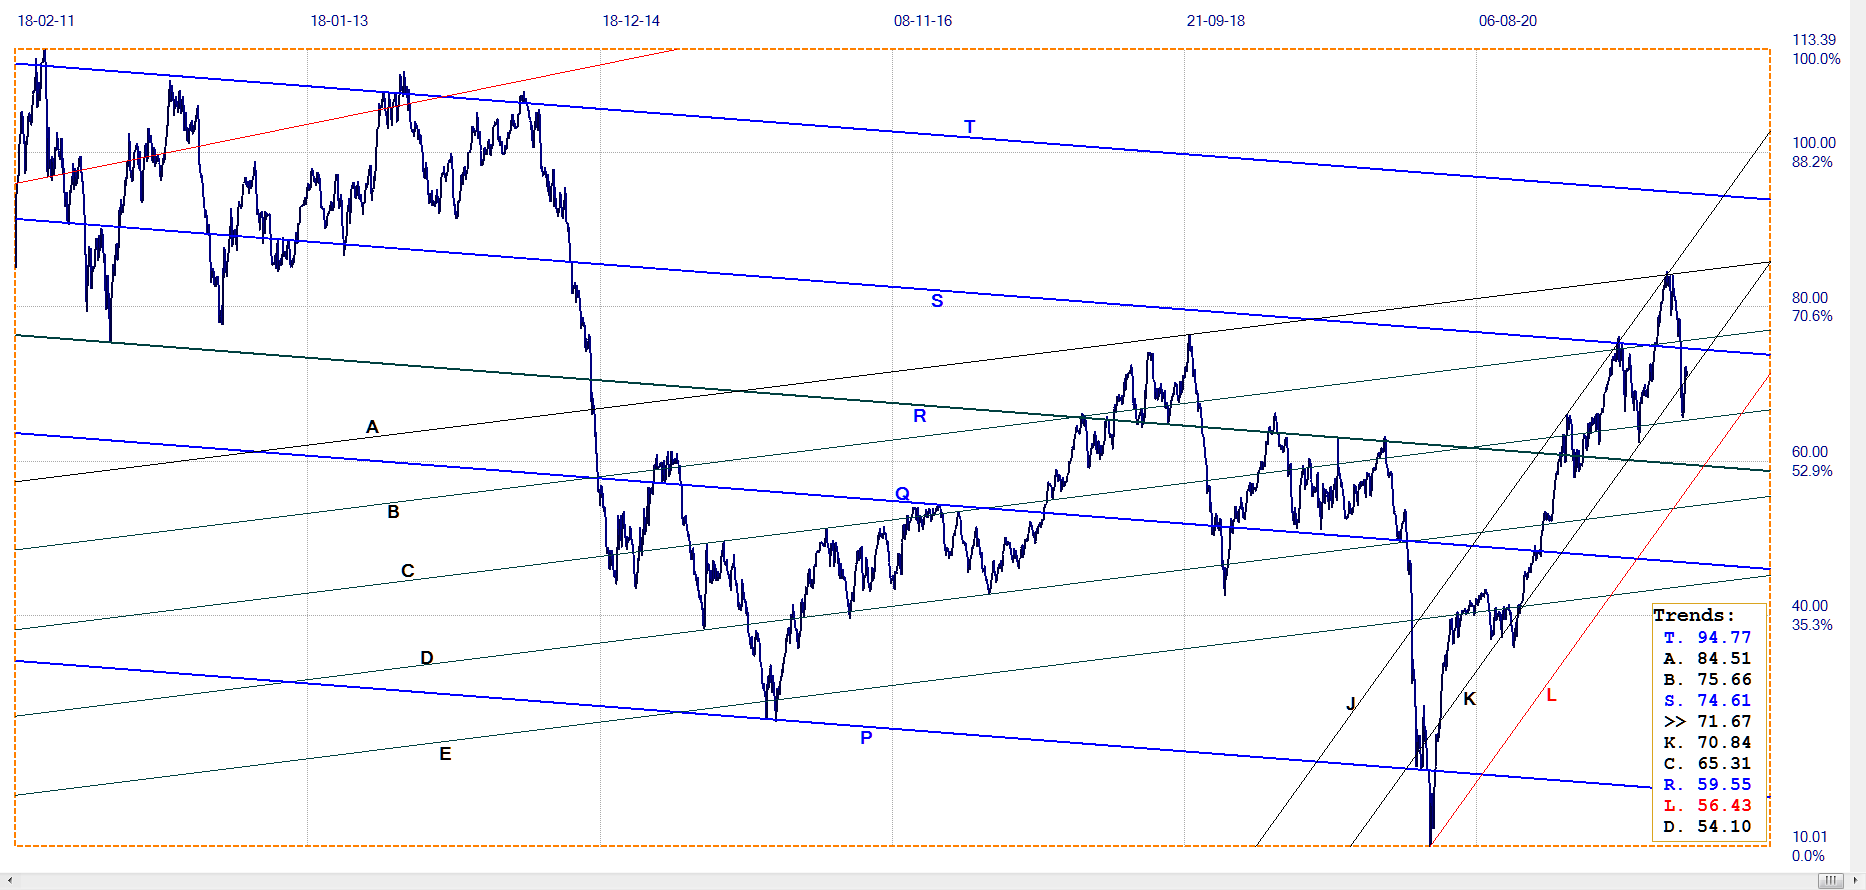
WTI crude – Daily close, last = $71.67 (www.investing.com)
Another rebound off a significant trend line again that the chart patterns often hold true to identify key support and resistance. The break below channel JK reversed off line C to recover just barely into channel JK. Initially, the break lower looked as if the price of oil was reacting to slowing demand, but the rebound and recovery into the channel – while it holds – warns that the cost of energy is likely to increase further. A break above lines S and B is needed to confirm the trend to higher inflation is still intact.
©2021 daan joubert.
********
More from Gold-Eagle


