Update For The Silver To Gold Ratio


In Early May, some potentially big things are happening that I want to bring to your attention.
First, it appears that gold's bear box is terminating. Remember, the step sum is a market sentiment indicator, and since February the price of gold has declined about $250, while its step sum has stubbornly refused to follow the price of gold down, creating a bear box. When a market's sentiment (as measured by the step sum) and its price trends diverge, it means that someone is wrong, and usually it's the traders holding positions contrary to an asset's price trend. As seen in the chart below, gold's step sum is now in the early stages of collapse. Should the step sum continue collapsing, it would indicate that the bulls have finally accepted that the bears (manipulators JP Morgan and HSBC) will succeed in taking the price of gold down, one more time.
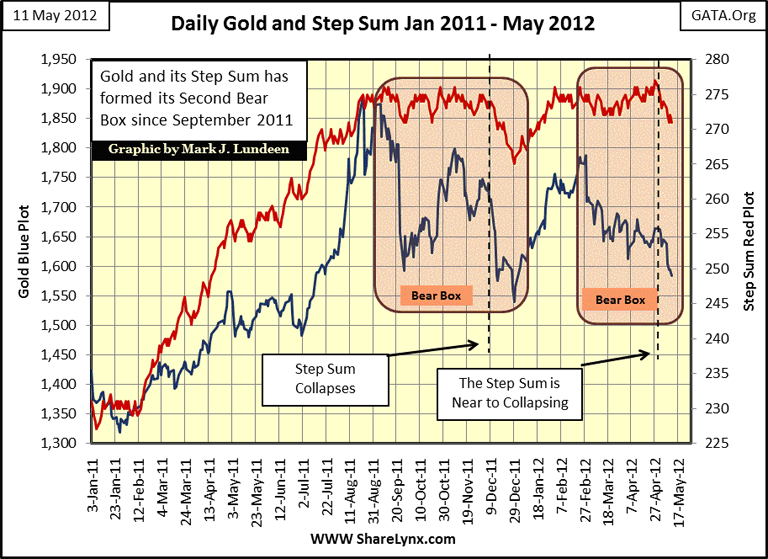
How far the price of gold will fall as the bulls exit their losing positions is anyone's guess. But keep in mind that the "policy makers" will surely resist the old monetary metals (gold and silver) from developing a price uptrend as their financial markets deflate. Understand that "Policy" doesn't just want gold to correct, but to become a debacle on the scale of the impending European financial system disaster. And believe me, after last week's election results, Europe's financial system is on the verge of major deflation! How successful the "policy makers" will be in forcing gold and silver prices down is something only time will tell because in 2012, unlike 2008, global central banks have become major buyers in the gold market. The success or failure of the current program of depressing metal prices is in the hands of these central banks.
Two short-term possibilities exist in the precious metals markets:
- Asian central banks say enough is enough with New York and London suppressing the price of gold and silver, and decide to overwhelm the western central banks' efforts to depress the price of precious metals by demanding the delivery of actual metal beyond the capability of the New York and London futures markets to deliver. But in my opinion, this is not a likely prospect.
- Asian central banks continue taking full advantage of the Western central banks' desperate efforts to depress the price of gold and silver, and content themselves with taking delivery of what metal is available, at subsidized prices. Let's face it, they like buying as much actual metal as is available, even though less than they would like, at subsidized prices. And if you sell your gold and silver as prices decline this summer, these banks will gladly pay you much less than your metal is worth too!
So how far could the price of gold decline? Well the largest correction so far in our current bull market (2001-2012) occurred during the 2008 credit crisis, when gold declined by 30% as seen in the Bear's Eye View (BEV) chart below. So a decline of 30% is my first target of what may (but may not) happen from here. But a 30% decline from ourlast all-time high in gold would take gold down to about $1300, a dollar decline of $588, or in other words:
* THE LARGEST DOLLAR DECLINE IN THE HISTORY OF THE GOLD MARKET! *
As gold continues to decline from its highs of last August, I can already hear CNBC's gold experts declare one more time that gold at any price is a fool's investment; the going fare for a ticket to ruin. But a 30% decline in an investment position is just that: * a 30% decline*, and since 1969, gold bull market corrections of 30%, and more, have been routine.
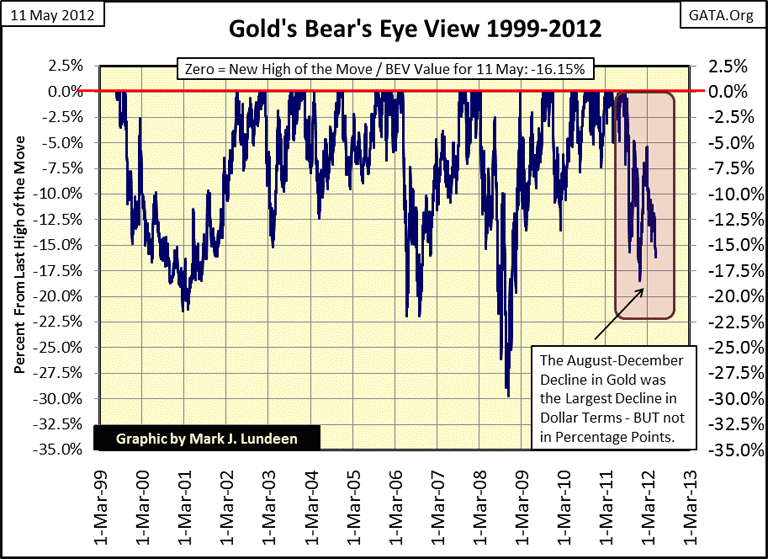
On 18 March 2008, when gold's last all-time high price was only $1003, gold only had to decline $300 to achieve a 30% correction. Today, with gold's current all-time high price of last August at $1888, it would now take a decline of $588 to achieve the same percentage decline. Now a decline of $588 (30% from last August) would not be something to be pleased about, but by no means would it be a cataclysmic event in the grand scheme of our current bull market in gold. We should be excited that someday a decline of $1000 in the price of gold will equate to a 30% correction, as this would imply that gold's last all-time high had been $3333. Oh, we'll get there, and continue to see double digit corrections in the price of gold for years to come! So forget dollar declines, think in terms ofpercentages; which makes BEV charts really handy as they ignore prices, and display only new highs and percentage declines from them.
And fear not - with central banks mindlessly printing money like monetary maniacs in their futile attempt to maintain their domestic financial assets' and reserves' inflated valuations, rising gold and silver prices will become an unstoppable force in the years to come. In fact, they already have been since 2001. Eleven years ago, what "respectable voice" in the financial media would have predicted $1888 gold in 2012? But this is now our reality.
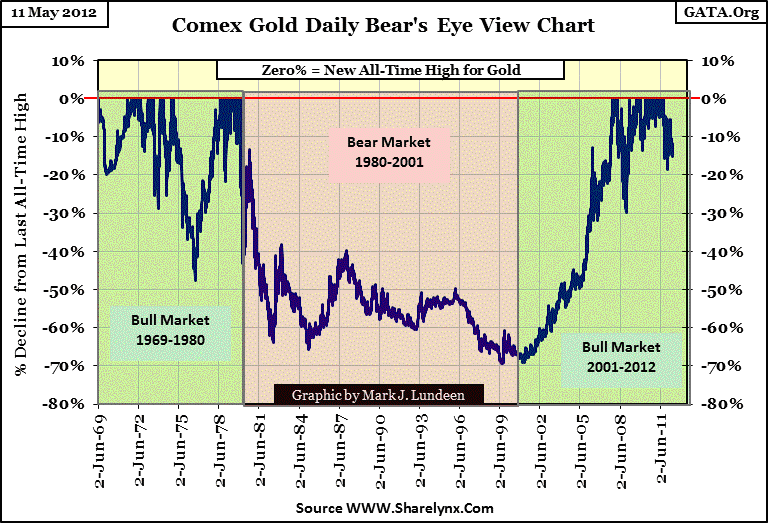
The most remarkable, and unnoted, feature of our current bull market has been its * Low Volatility* . Our gold bull has been a real pussy-cat, with lots of new highs, coming at regular intervals, that should have kept the gold-bugs happy, though it hasn't. Geeze Louise, look at gold's volatility below from 1969-80 in gold's long term BEV chart below; gold investors were riding El-Diablo!
Today, people now in their 70s & 80s claim they made big money in gold and silver during the 1970s; and some did. But with the volatility we see below during the 1969-80 bull, my guess is that most retail gold investors from four decades ago made a regular habit of selling at the bottom, and buying back at the top. Look at our bull market; buying and holding gold and silver for the long-term has actually been easy, for people with the discipline to be patient.
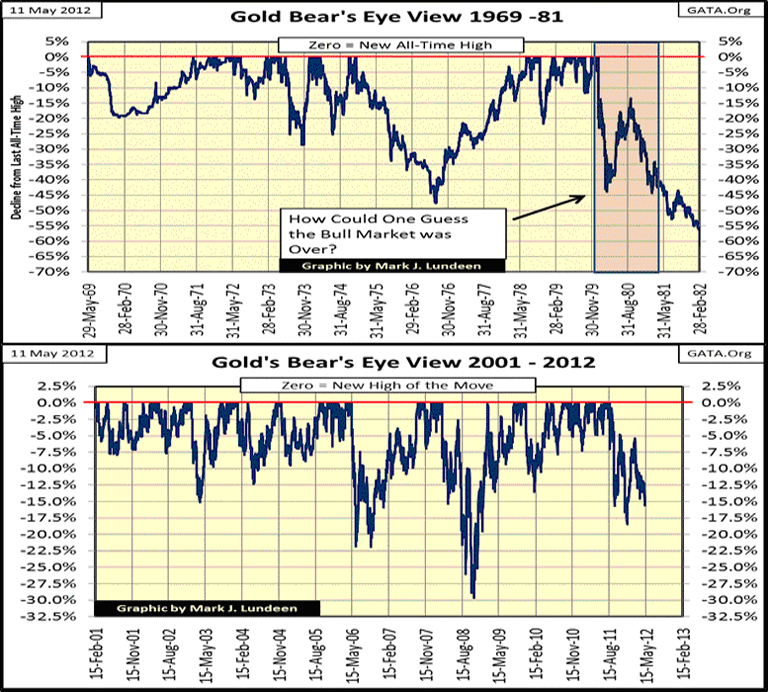
Let's take the comparison between the 1969-80 & 2001-2012 gold bull markets a little deeper. The 1969-80 bull was eleven years long (or 2673 trading days), and our 2001-2012 bull has also lasted eleven years (2818 trading days: only 145 trading days difference). So in May of 2012, time wise we can say that one has lasted as long as the other. To help visualize the difference between these bull markets, I've created a BEV chart placing these bull markets one above the other, and as is obvious they have been quite different!
For the 1969-80 bull market, look at the two gaps between BEV Zeros (new highs): First from May 1969 to July 1971, two years between new highs in the price of gold, and then from December 1974 to July 1978, over four years without a single new high. Then there is our current bull market, where gold has delivered regular new highs in price since 2001, with the longest gap between new highs spanning from April 2006 to September 2007, only 17 months.
To better compare the differences, let's go to the table below. At first glance, the percentage of trading days these markets produced new daily high prices seems about the same. But new daily highs in * ANY * bull market are actually infrequent events. To appreciate how our current bull market has outperformed the 1969-80 bull, we need to directly compare the "Percent of Days Making New Highs" for both bull markets. This is done by dividing our 8.69% by the old bull's 6.92%, and we discover that our current bull market has generated 26% more daily new highs than the 1969-80 bull market. This is an impressive feat of bullishness that works out to be on average, a new high price for gold once every twelve days since 2001.
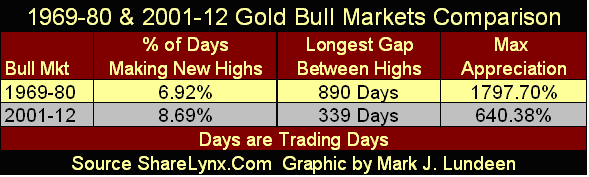
Let's look at these bull markets' maximum appreciation. As noted in the table above, with about the same number of trading days, it appears that the 1969-80 bull outperformed our bull market by a significant percentage, but this is misleading. I marked the beginning of the 1969-80 bull market on 29 May 1969, with the price of gold at $43.50. For gold at $43.50 to advance 640.38% (as is the case for our current bull market's last all-time high), that would take $43.50 gold up to $321.9. Funny thing about $321.9 gold, the 1969-80 bull market gold didn't break above $321 until 04 September 1979. Ninety-six trading days later gold saw its final high of the bull market with a closing price of $825.50; then began a twenty-one year bear market the next day.
So if you ignore the last ninety six days of the 1969-80 bull market, (which saw an explosive bull-market-terminal-phase blow off in price), these two gold bull markets have delivered similar eleven year gains to investors: 640%. But something tells me that our gold bull market still has years to go, rather than just ninety six more days, as was the case in 1979 when gold reached its eleven year, 640% gain.
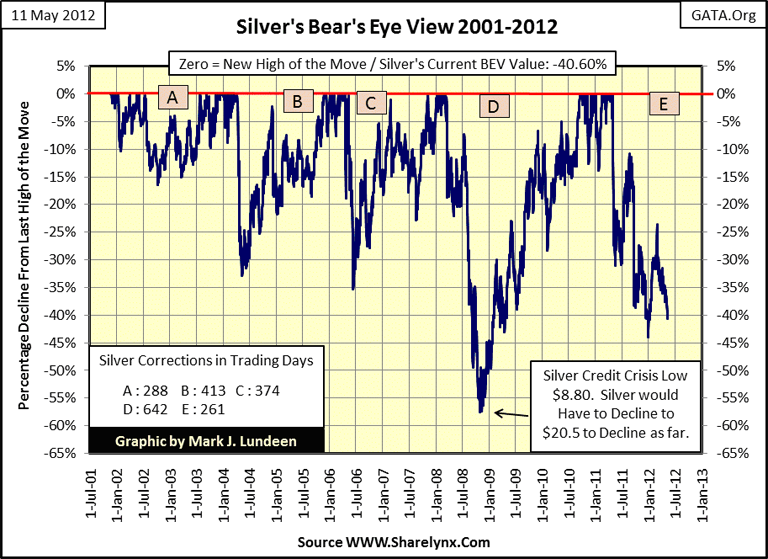
Let's take a quick look at silver; it's been the same story as gold except the current silver bull market, as is to be expected, has seen greater volatility than either of the post Bretton Wood's gold bull markets. In 2008, silver saw a massive decline of 57% as silver fell from $20.07 in March to $8.80 in November 2008. But should silver once again decline 57% from its last BEV Zero of $48.58 of a year ago, the price of silver would still be about a half dollar higher than its $20.07 high price of March 2008! It should also be noted that these are paper spot prices based on futures contracts, and no significant amount of physical silver traded hands below $10 an ounce in 2008.
Trying to trade silver is like handling snakes, something best not done by most people. So if you have it, forget-about-it! Two years from today, $48 silver will give you bragging rights. But if you have some money on the side to buy silver, you may want to wait a bit for better prices.
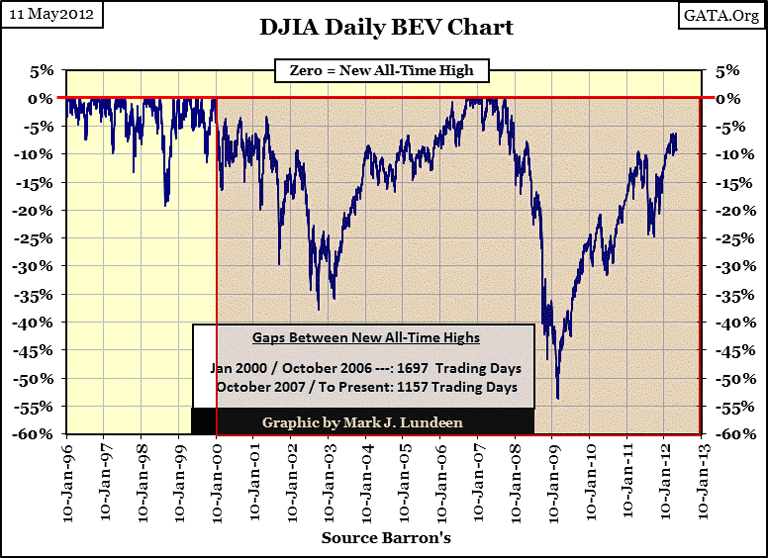
What about the stock market? It could be better! First point to examine is the Dow's ability to deliver new all-time highs for investors, and the gaps between them from its January 2000 market high to present (next chart), as we did above for gold. First thing to note is that from January 1996-Januaryl 2000, the Dow Jones saw one new all-time high after another. But the Dow was in a bull market way back then! Since January 2000, the Dow's BEV chart makes it abundantly clear that, except for a short period during 2006-07 when the US housing market bubble inflated to grotesque proportions, the Dow Jones has fallen down and can't get back up. I'm not just picking on the Dow Jones; the same is true for all the major stock market indexes since January 2000.
Now compare the gaps in gold's BEV Zeros (two charts above) to the Dow Jones since its April 2000 top (below) - there is no comparison. Unlike the Dow Jones below, where investors had to wait many years before the Dow Jones could drag itself up to a new all-time high, for the past eleven years gold has provided investors with one new high after another. Sure one could make money playing the Dow's post January 2000 bear market's rallies, but that is not at all the same as investing in a bull market, like the one gold and silver have been in since 2001.
During the 1980s and 1990s, everyone was content believing the Dow Jones was an honest metric of the stock market. However since its January 2000 top, there have been voices that are now finding fault with measuring the stock market using the venerable Dow Jones Industrial Average. But in fact the Dow Jones (only thirty stocks) hasalways had its limitations. That is why Charles Dow created the Dow Jones Rail Road Average (today's Transports) in 1897, as the Dow Jones Industrials contains only some of the clues to be found in the stock market.
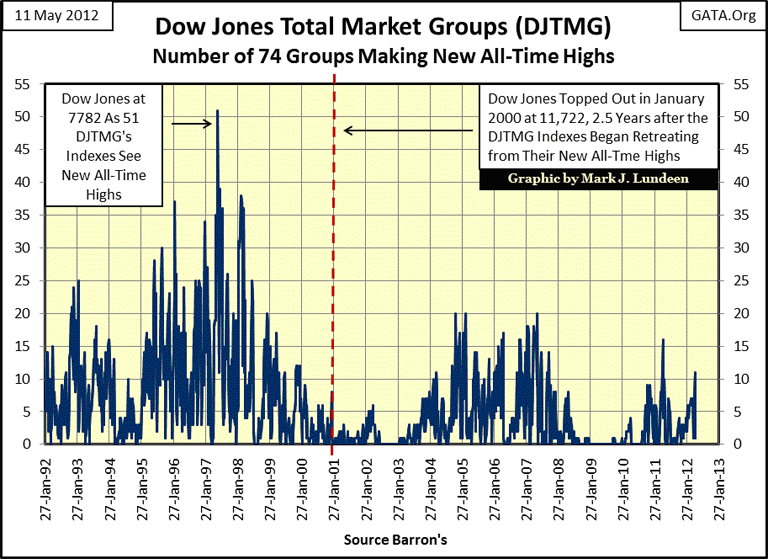
To view the stock market as a whole, let's take a look at the Dow Jones Total Market Groups' (DJTMG) history of producing new all-time highs since 1992. Here is a significant market insight that maybe only three or four other market watchers other than myself are aware of; from the perspective of new all-time highs produced by the DJTMG indexes, (the most important thing a bull market can do), the stock market as a whole actually topped out in June 1997. When the Dow Jones Industrial Average reached its final high of the 1982-2000 bull market on 14 January 2000, only seven of the seventy four groups in the DJTMG did too.
Since the June 1997 DJTMG top in new all-time highs for the seventy-four indexes I follow, it has attempted to rally its indexes to new all-time highs twice, with each attempt weaker than the one before. Have no doubt about it, the free market mechanism of the stock market wants to deflate, but deflation is against official "policy." So to my way of thinking, the stock market at its current valuations has simply become a bad habit that all too many people simply haven't broken - yet. But "policy" or not, the stock market will eventually deflate to prices that would shock most people today. Even owners of today's hot stocks like Apple Computer will one day feel the lash of deflation. People will either exit the stock market, or suffer the consequences of remaining bullish in a massive deflationary bear market. With whatever cash they have left, many will be left seeking another bull market, and finally discover the decade long bull market in gold and silver.
I hope I don't annoy my readers with continuing coverage of the stock and bond markets. But to investors in precious metals, this information is important. These markets currently contain many trillions of dollars and euros that circulate daily in the confines of these paper assets markets. The day is coming when a good portion of this money will break away from these paper assets, and begin buying gold and silver. That is when we will see real excitement in the precious metals markets.
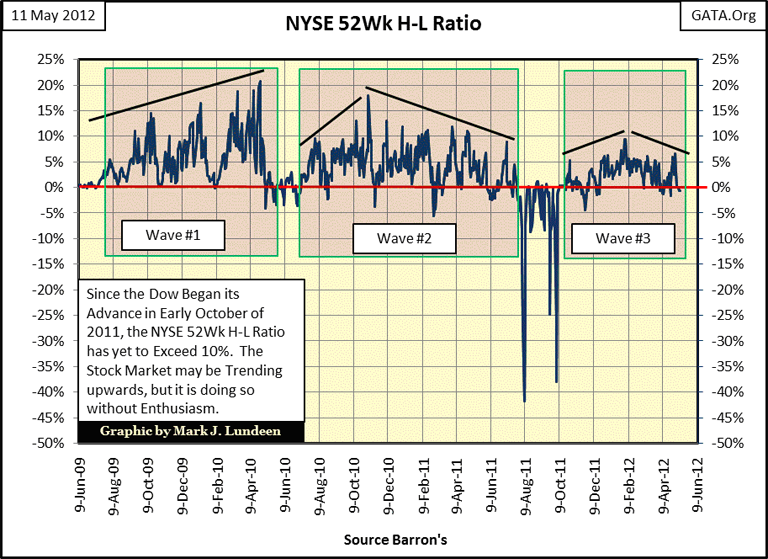
But producing new all-time highs is very difficult, so I'll lowering the bar to see what the NYSE's 3000 plus listed companies have done recently in producing new 52Wk Highs and Lows. Unfortunately, since April / May of last year, producing a significant number of 52Wk Highs is something this "bull market" in stocks has been incapable of doing. Looking at the NYSE 52Wk H-L Ratio below, it's evident that given half a chance, stocks on the NYSE would rather be making new 52Wk lows than highs, as we saw last August / October. And since last autumn, this internal weakness at the NYSE, the inability of its 3000 plus listed companies to make new 52 Wk Highs, is the one reason I've never been enthusiastic about our current advance in the Dow Jones.
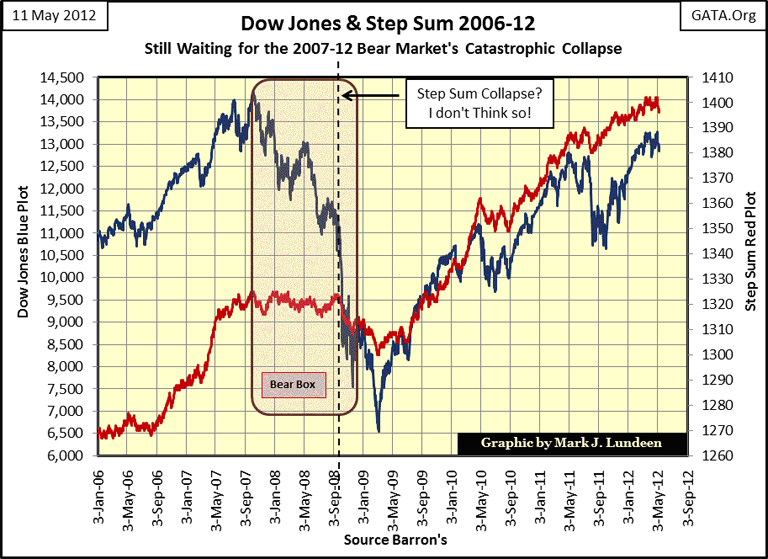
Another thing bothering me about the stock market is how the Dow Jones massive bear box was resolved in 2008 - 09. What an incredibly ugly box we see below; the Dow's step sum remained neutral for over a year as the valuation of the Dow Jones itself declined 40% for the first time since 1974. The stock market bulls of 2007-08 were really stubborn! After a yearlong bear box that terminated in such a spectacular fashion, we should have seen a spectacular collapse in the Dow's step sum. Instead, from September 2008 to March 2009, the Dow's step sum declined by a mere 23 net down days before it and the Dow Jones's valuation began their current recovery. I'm not buying this. Based on my Dow Jones studies going back to 1900, all major Dow Jones' bear markets see a significant collapse in their step sum before they terminate.
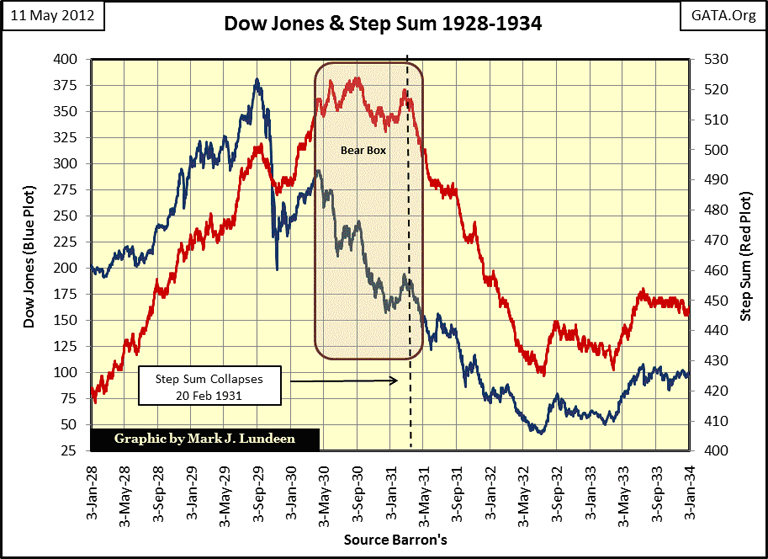
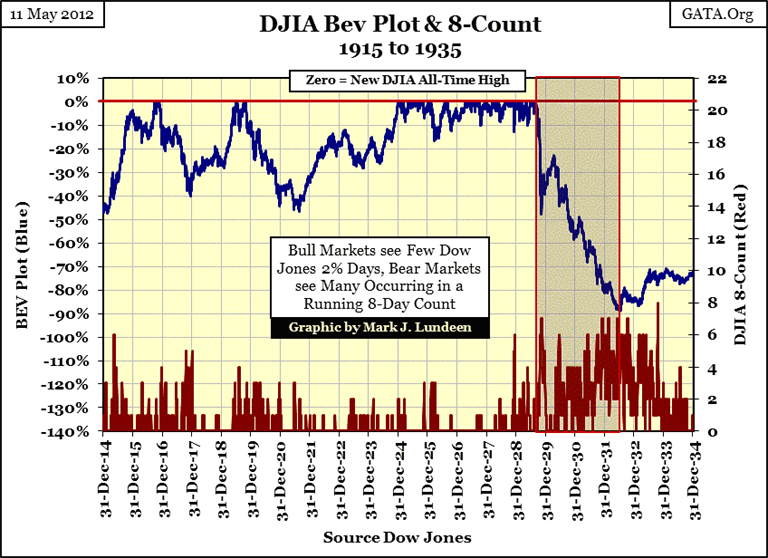
If you want to know what I think, I think we've seen this before! Now you don't need a bear box for the step sum to collapse, as was the case during the initial market crash in the autumn of 1929. Note that the Dow declined 48% as the Dow's step sum declined only 15 net down days, before the market turned around in the dead-cat bounce from hell. After the April 1930's peak, the Dow Jones began its journey down to a massive 89% bear market bottom. Market sentiment (as measured by the step sum) refused to turn bearish for the next ten months. After 20 February 1931, the bulls' could no longer deny the Great Depression, and the step sum fell almost one hundred net down days, in a collapse of catastrophic proportions.
This is all very interesting, but is it fair to compare our stock market with the 1920s and early 1930s? Damn right it's a fair comparison, as the Dow was in an inflationary market bubble in the 1920s, in fact a smaller bubble than the one the "policy makers" inflated in the stock market from 1987 to 2012. When the Dow Jones once again begins deflating in earnest, I'm expecting another spectacular collapse in the Dow's step sum, as Doctor Bernanke becomes the most hated man of our generation.
It won't happen next week, but we'll know that the stock market has once again developed a fear of heights when the Dow Jones begins seeing frequent daily moves of 2% or greater (up or down makes no difference), as tracked in the Dow's 8-count. The 8-count is the number of 2% days seen in a running count of the last eight trading sessions.
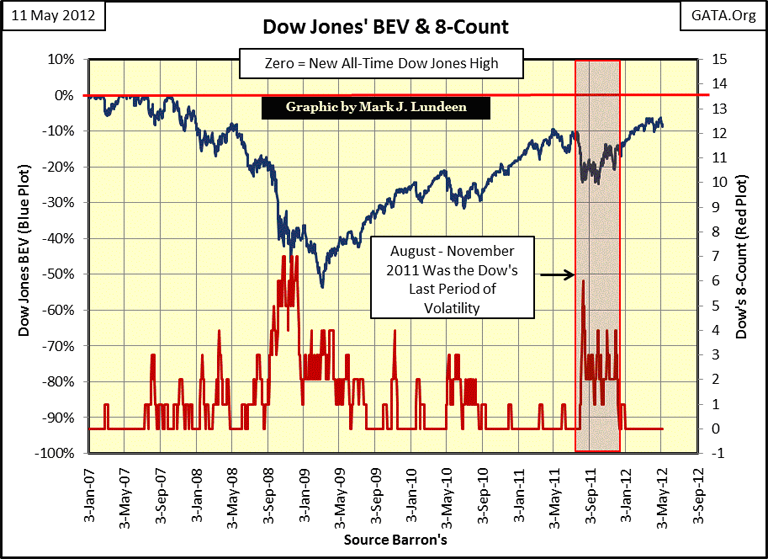
In October 2008, the Dow's 8-count saw * SEVEN * 2% days in an eight day count, something not seen since theearly 1930s! Then, last August, the 8-count saw a depression-era * SIX * before the stock market calmed down. Since 1900, Dow Jones' 8-counts of six or greater have marked extreme market declines. They are rare too. For the past 112 years, 8-counts of 6 or greater have for the most part been exclusive market events of the Great Depression's market crash. So why in the chart above have we seen so many large 8-counts since the beginning of the credit crisis?
I think that these post 2007 high 8-counts are only foreshocks of greater quakes to come, something like what occurred during the late 1920s and early 1930s as seen below.
What can I say: I'm a big bad bear on financial assets. But ultimately, what proves to be bad for stocks and bonds, will prove to be excellent for gold and silver. U.S. and European central banks know this to be true, and so force down gold and silver prices every time their debt or stock markets begin to deflate.
But the "policy makers" are becoming weak, as Mr Bear is becoming strong. And let me tell you a little secret; Mr Bear is a bigger bull on gold and silver than even the Asian Central Banks. All the Asian CBs want to do is limit their exposure to dollar and euro risks by buying cheap gold and silver. This is not true for Mr Bear! Mr Bear has only one purpose in life; to clean up the disgusting mess left behind by Wall Street's "Masters-of-the Universe" after their drunken bacchanals, and the current orgy has gone on since Alan Greenspan became Chairman of the Federal Reserve in 1987. For Mr Bear's purposes, there is no better way to get Washington and Wall Street to face the reality that their twenty-five year inflationary debauch of our financial system is over than to see gold and silver rise to valuations that are simply not believable to most people today - so that is what will ultimately happen.
Mark J. Lundeen
[email protected]
[email protected]


