US Stock Market In Position To Crash, PM's To Correct...


We have ridden the uptrend in the Precious Metals sector for all its worth over the past several months, generally making substantial gains but after breaking higher yet again last week it suddenly reversed dramatically on Friday in a manner which suggests that significant correction is probably starting that will be of a sufficient magnitude to be worth sidestepping – and this is especially the case because the broad stock market looks like it is now in position to drop hard or even crash and take the PM sector with it into a heavy correction. This being the case, we will starting by reviewing the latest charts for the S&P500 index.
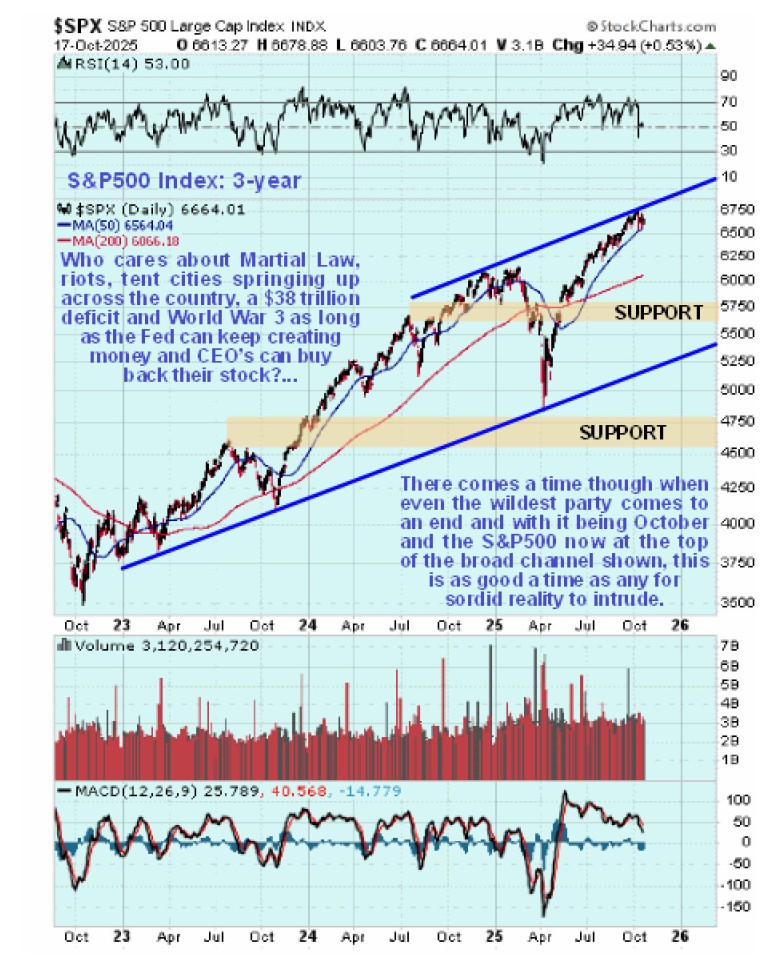
Starting with a 3-year chart for the S&P500 index to gain an overall perspective we see that it is rounding over beneath the upper rail of a broad uptrend that has been in force since the start of 2023 and it would be normal for it to correct back substantially from this position even if this major uptrend remains intact. If it simply corrects then we can expect it to drop back to the upper support level shown and perhaps back a little further to the lower rail of the channel. If it crashes it would drop back to the lower support level shown, or lower.
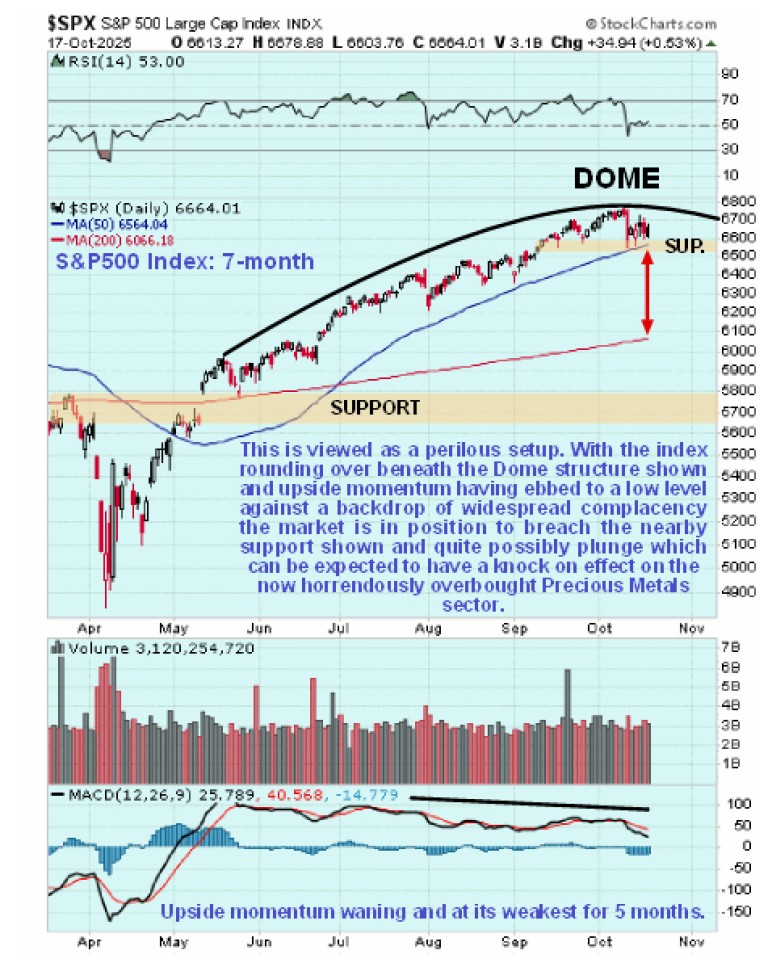
On the 7-month chart we can see how, following the “crashlet” last April, the index recovered smartly before advancing in a much more measured manner ever since, culminating in the peak early this month when the price arrived at the highest point of the large Distribution Dome shown having opened up a substantial gap with its 200-day moving average. A warning sign is the gradual diminution of upside momentum (MACD) since July which took a real hit as a result of the sharp drop over a week ago. This is viewed as a “shot across the bows” and as a signal that the market is readying to break down. So now we’ll look at the S&P500 index on a much shorter-term chart in an effort to determine what is going on.
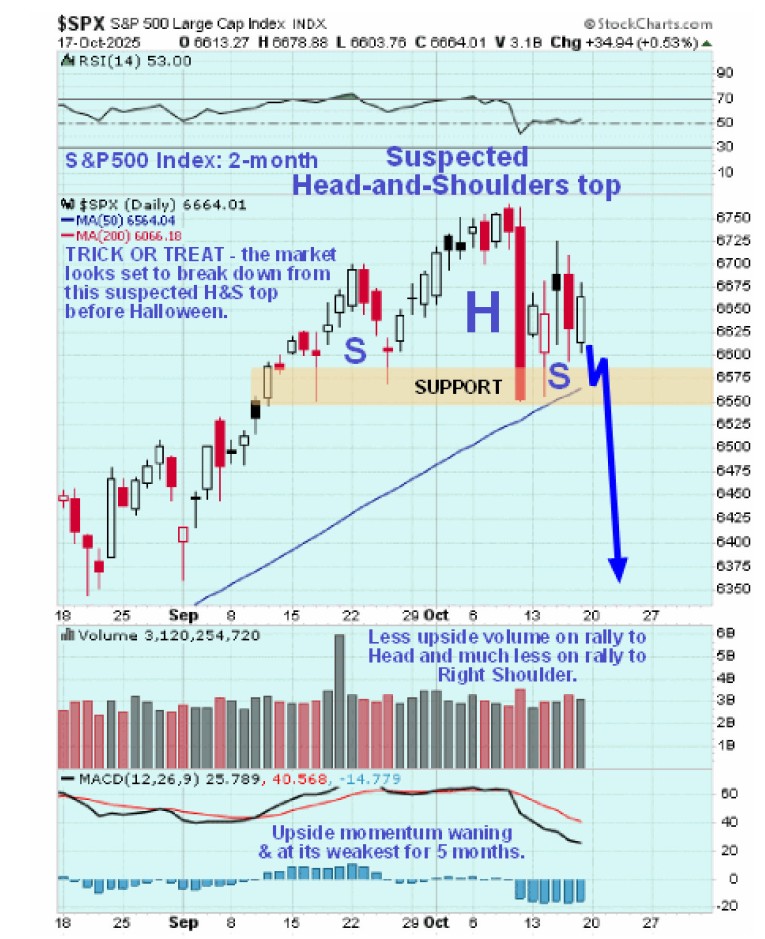
On the 2-month chart we can identify a potential Head-and-Shoulders top that has the correct volume pattern for such a formation, with relatively high upside volume on the ascent to the Left Shoulder, somewhat more moderate upside volume on the rally to the peak of the Head and then lighter upside volume when it rose to the high of the Right Shoulder. This means that it very likely is a valid Head-and-Shoulders top so we can expect it to break down from it soon as the pattern looks about complete and if this happens we can expect it to drop hard and fast, initially to the support level shown on the 7-month chart in the 5700 area.
So what will happen to the heavily overbought PM sector in the event of the stock market dropping hard? In the same way that there are still people who believe what they see on the BBC, CNN and CNBC, a sizable percentage of this flight money from the stock market will make its way into US Treasuries, even though they are no longer the safe investments that they once were, and this will temporarily bolster the US dollar – bad for Precious Metals prices. This is what happened in 2008, although this time there is a lot less confidence in US Treasuries so the percentage should not be so great.
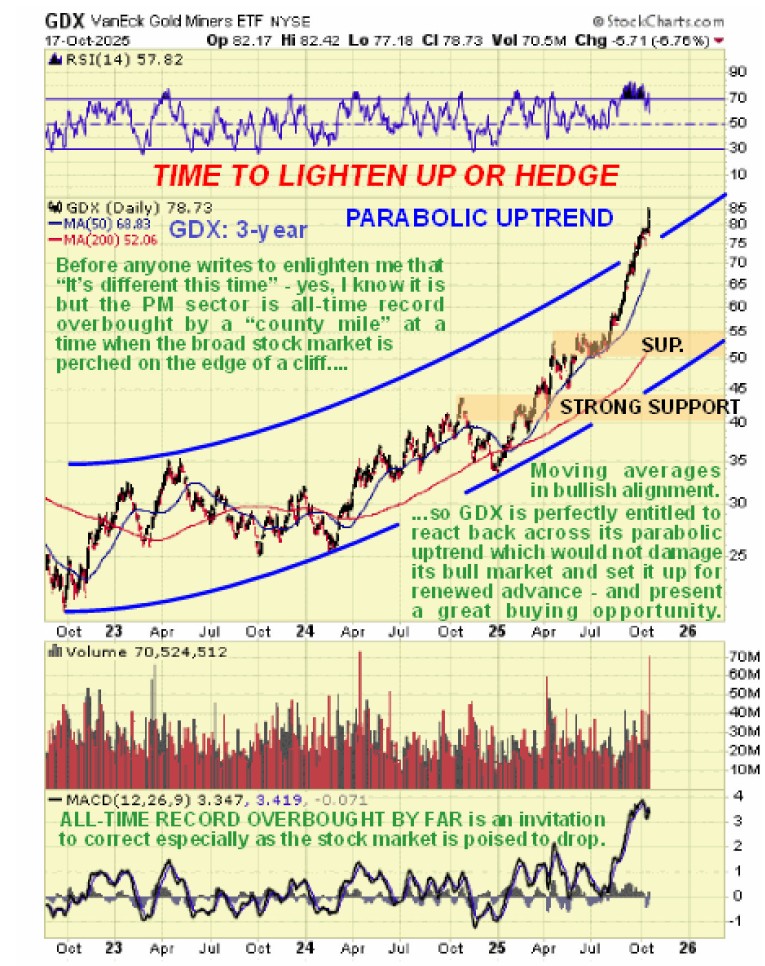
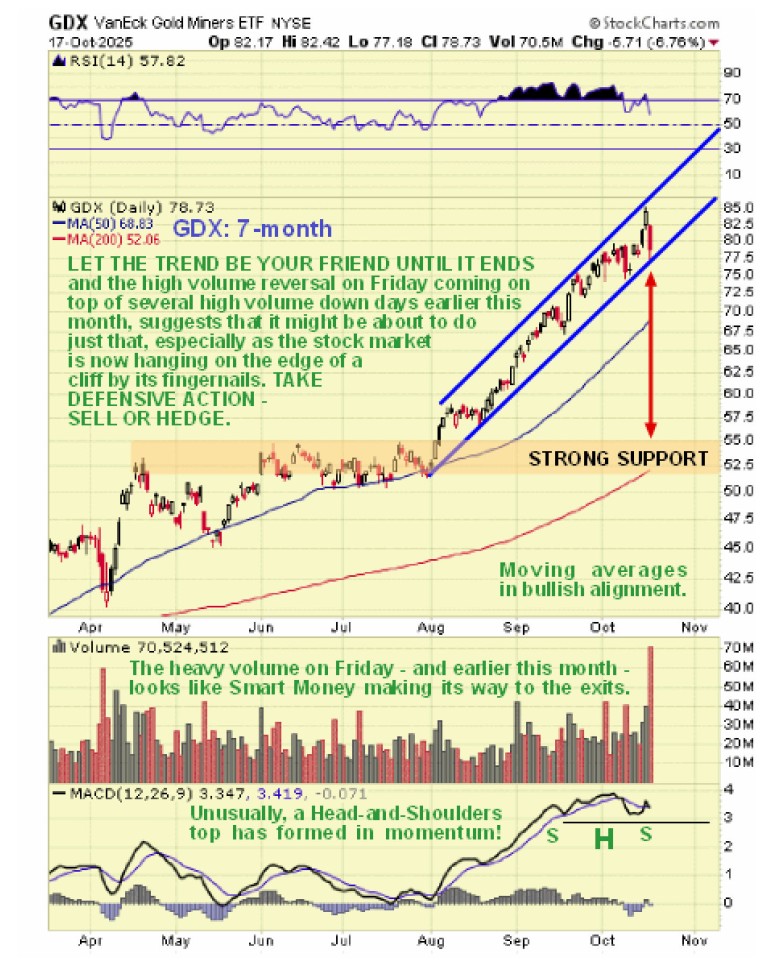
So, regardless of the longer-term fundamentals for gold and silver which we know are spectacular, we can expect them to take a hit from temporary dollar strength and correct back and as we can see on the 3-year chart for GDX, PM stocks are certainly vulnerable to a significant correction as they have risen steeply in recent weeks to become all-time record overbought near to the top of their accelerating parabolic uptrend channel. This is an excellent point for them to reverse to the downside into a sizable intermediate correction and if the stock market drops hard or even crashes then we can expect GDX to drop at least to the first support level shown in the $50 - $55 zone which would result in losing all or most of our gains of recent months. If this happens and the dust then settles on the stock market it will be an outstanding point for those who step aside to dodge the correction to buy back and to add to positions.
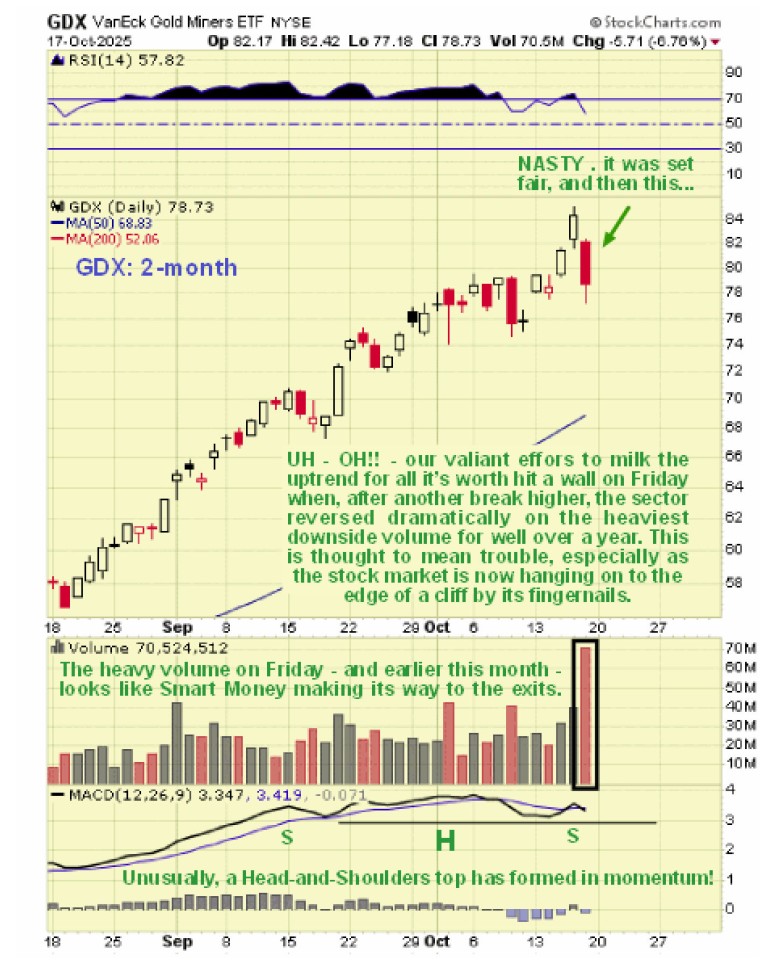
On the 7-month chart we can see the steep and thus far orderly uptrend in force from the start of August and the warning signs that it is probably about to fail, namely the reversal on very heavy volume on Friday which looks like Smart Money bolting for the exits and this is especially so as there were a couple of high volume down days earlier this month. In addition we can see that upside momentum is starting to fail with, unusually, a Head-and-Shoulders top appearing to form in the MACD indicator and if this breaks down then GDX is likely to plunge and as it is currently way above its 200-day moving average it could correct back down towards this indicator. A reason that the drop could be fierce is that most everyone is bullish on the sector and “is on one side of the boat” so the switch from greed to fear could be something to behold.
Lastly the 2-month chart shows recent action in much more detail. While Friday’s drop is similar in magnitude to the drop about 7 trading sessions ago, it was on much higher downside volume and thus has more serious implications.
What you decide to do about all this depends on your personal situation and how flexible and nimble you are. The general assessment is that it is thought best to stand aside from many positions, especially in stocks that are slaves to the movements of the indices, or alternatively, if you want to stay long, find some way to hedge such as cheap out-of-the-money Puts.
********

Clive P. Maund’s interest in markets started when, as an aimless youth searching for direction in his mid-20’s, he inherited some money. Unfortunately it was not enough to live a utopian lifestyle as a playboy or retire very young. Therefore on the advice of his brother, he bought a load of British Petroleum stock, which promptly went up 20% in the space of a few weeks. Clive sold them at the top…which really fired his imagination. The prospect of being able to buy securities and sell them later at a higher price, and make money for doing little or no work was most attractive – and so the quest began, especially as he had been further stoked up by watching from the sidelines with a mixture of fascination and envy as fortunes were made in the roaring gold and silver bull market of the late 70’s.
Clive furthered his education in Technical Analysis or charting by ordering various good books from the US and by applying what he learned at work on an everyday basis. He also obtained the UK Society of Technical Analysts’ Diploma.
The years following 2005 saw the boom phase of the Gold and Silver bull market, until they peaked in late 2011. While there is ongoing debate about whether that was the final high, it is not believed to be because of the continuing global debasement of fiat currency. The bear market since 2011 is viewed as being very similar to the 2-year reaction in the mid-70’s, which was preceded by a powerful advance and was followed by a gigantic parabolic price ramp. Moreover, Precious Metals should come back into their own when the various asset bubbles elsewhere burst, which looks set to happen anytime soon.
Visit Clive at his website: CliveMaund.com


