US Stock Market A Tidal Wave Of Doom


S&P500
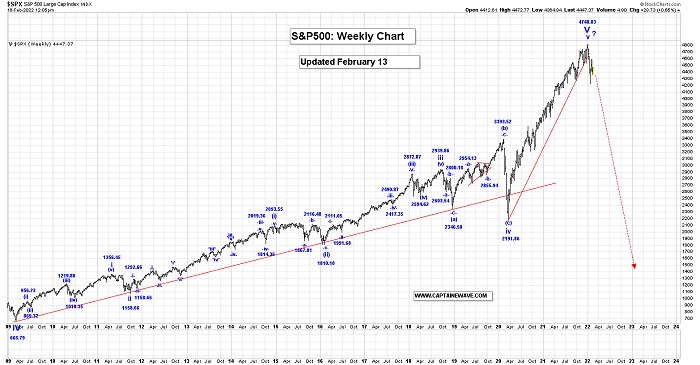
Long Term Update:
It looks like our ending diagonal triangle formation ended a failure high at 4748.83, and wave V is now complete at the high.
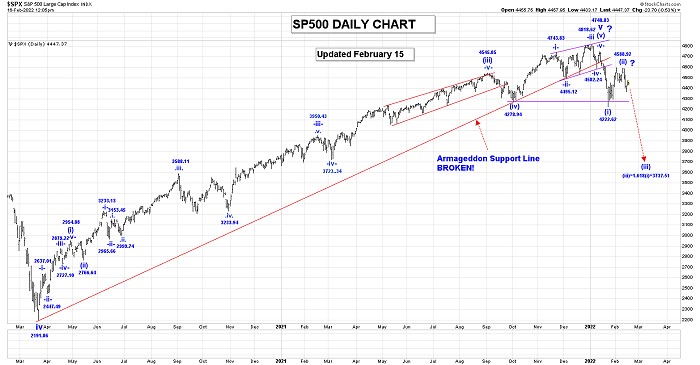
Our “Armageddon Support Line” has broken and the SP500 looks to be heading into a multi-year bear market.
Within this current drop we likely completed wave (i) at the 4222.62 low and likely all of wave -ii- at the 4590.03 high.
We should now be falling in wave -iii- which has the following initial projected endpoint:
-iii- = 1.618-i- = 3737.45.
We are not day traders. We sold out of gold and silver in 2012, re-entered in 2014-2015, and have remained long and strong. We are now heavily short the stock market, using call options as our stops.
The call options provide immense protection in case there is one final pop higher, but we believe the top is in.
Short Term Update:
We are now working on the assumption that our wave (v) ending diagonal triangle is complete at the failure high of 4748.87. Our only concern with this analysis is that we had a “failure high”.
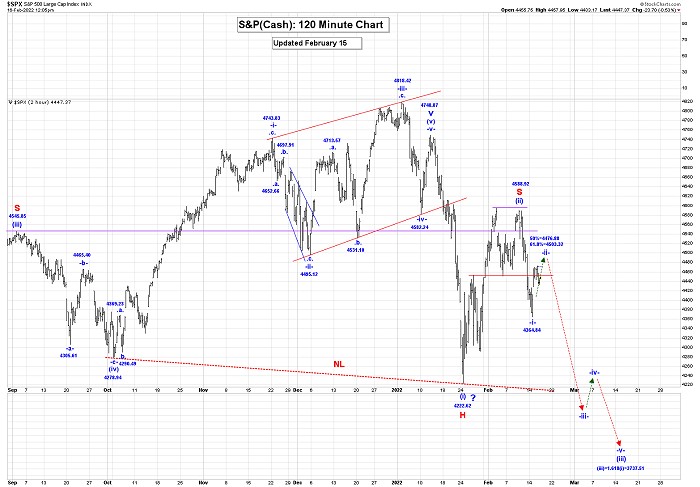
As you can see on our 120 Min SP500 Chart it looks like all of wave (i) ended at the 4222.62. It appears that wave (ii) has become more complex, but it appears to now be complete at the 4588.92 high.
After wave (ii) ends we still expect another big drop in wave (iii). We will provide an updated projection for the end of wave (iii), when we believe all of wave (ii) is complete.
The volatility should continue!
Trading Recommendation: Go short, using call options for stops.
Active Positions: Heavily Short, with call options for stops!
Price Sale: Our subscriptions are $289 for 3 months, which is good value. For gold community readers, we have a special $229 price for 3 months, good through this week. If you want to do it, send us an Emailand we’ll get you a payment link. Thanks!
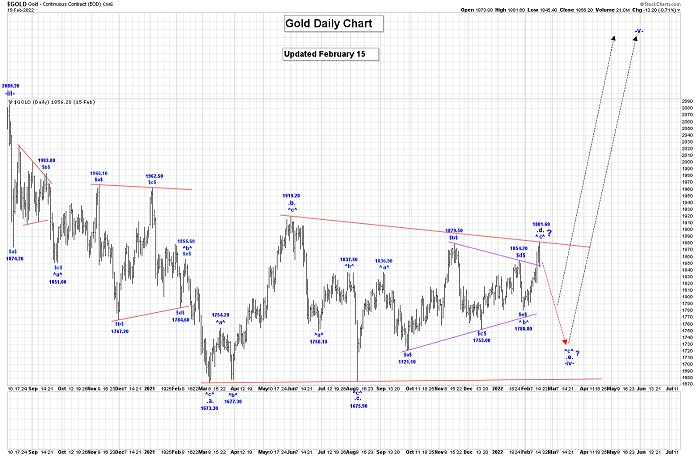
Gold:
Long Term Update:
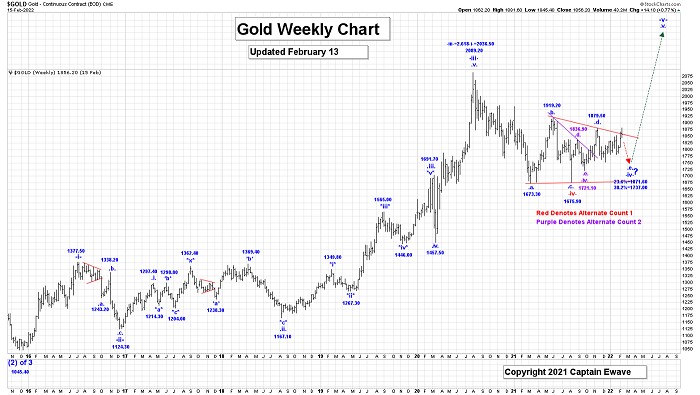
All of wave -iii- ended at the 2089.20 high.
Our current preferred count is still suggesting that our lengthy wave -iv- bullish triangle is still underway.
Within our wave -iv- triangle all of wave .d. ended at the 1879.50 high. We continue to work on wave .e., which we unfortunately still believe is NOT complete at the 1753.00 low.
The Ukraine situation could change the count, but our counts are never influenced by anything but the chart itself, so for now… the preferred count stays as preferred.
Within wave .e., wave ^a^ ended at 1753.00, and it looks like wave ^b^ is still underway, although it could now be complete at the 1867.40 high.
After wave ^b^ ends we still expect one more drop in wave ^c^ back to the at least the wave ^a^ low of 1753.00, to complete all of wave .e. and -iv-. We do have another projection for the end of wave ^c^ at:
^c^ = ^a^ = 1727.70.
For this current analysis to remain valid we cannot trade above the wave .d. high of 1879.50.
If that happens our bullish triangle maybe expanding and extending or one of our alternate counts will come into play.
Our retracement levels for all of wave -iv- are:
23.6% = 1871.60;
38.2% = 1737.00.
After wave -iv- ends we expect a very sharp thrust higher wave -v-, which should take gold to all time new highs. THE GOOD NEWS:
Our alternate counts still remain in play as follows:
Alternate Count 1, in red on our Weekly Gold Chart, is that all of wave -iv- ended at the 1675.90 low, and in this case we are now rallying in wave *i* of -v-.
Alternate Count 2, in purple on our Weekly Gold Chart, would be that all of our wave -iv- bullish triangle has ended at the 1721.10 low.
Short Term Update:
A rally above the 1919.20 high would confirm that all of our bearish triangle actually ended at the 1721.10 low, which is our alternate count as noted below.
After wave ^c^, .e. and -iv- end we can expect a huge thrust higher in wave -v-, which will take gold to all time new highs.
Another plausible possibility is that all of wave .d. ended at 1836.90 and all of wave .e. at 1721.10.
This would mean that all of wave -iv- is complete and that the next rally in gold will be a substantial thrust higher in wave -v!
Trading Recommendation: Go long gold. Use puts as stops.
Active Positions: Long gold, with puts as stops!
Captain Ewave & Crew
*********
More from Gold-Eagle


