U.S. Stocks Crashing Higher Into January


Last week's trading saw Gold forming its low in Monday's session, here doing so with the tag of the 1820.00 figure. From there, a sharp rally was seen into late-week, with the metal running all the way up to a Thursday peak of 1902.00 - before backing off the same into Friday's session.
Gold Market Update
With the comments made in past articles, gold is at or into the range for a mid-term bottom to form, with at least the potential that this low was registered with the late-November tag of the 1767.20 figure. We are expecting that low to come from the 154-day time cycle, which is shown again on the chart below:
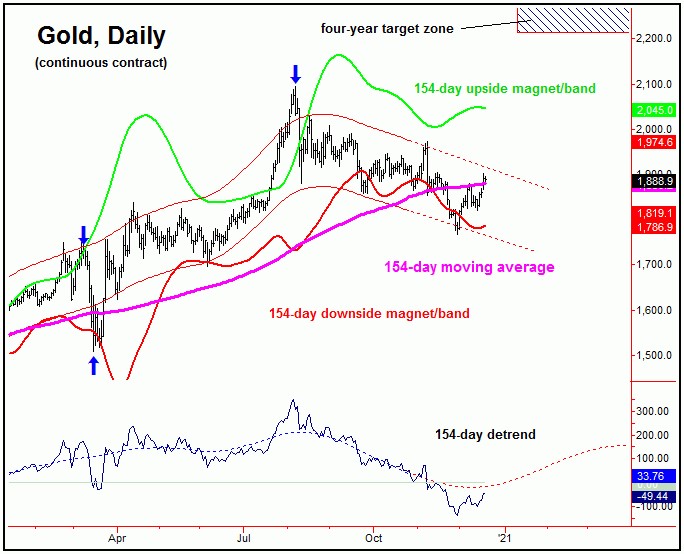
In looking again at our 154-day cycle chart above, our cycle/detrend indicator is forecasting higher prices for the coming months. In terms of price, our minimum upside going forward is looking for a rally back to the upper 154-day cycle band - which is currently at the 2045 figure, but which is declining slightly each day. Having said that, the more ideal path is looking for an eventual push up to the 2212.00 - 2340.56 region, which is an open upside target from our largest tracked wave, the four-year cycle.
U.S. Stocks 'Crashing' to the Upside
While we are awaiting confirmation of this mid-term bottom for gold, this weekend I though that we would take a more detailed look at the current cyclic position of the U.S. stock market - which looks to be pushing firmly higher into the month of January.
The 45 and 90-day cycles
As mentioned back in November, the last low for the 45-day cycle was registered with the late-October tag of the 3233.94 SPX CASH figure. From there, the upward phase of this wave was projected to remain in force into the mid-December timeframe - which we have obviously seen with the recent action. The chart below shows our 45-day cycle:

The key price level for our 45-day cycle in U.S. stocks is the 3633.40 SPX CASH figure, which is the current downside ‘reversal point’ for this component. Basically, as long as any near-term correction is able to remain above the same, then the upward phase of this 45-day is favored to extend into the month of January.
As a side mention, the seasonal pattern for stocks tends to bottom around the December 16-21 timeframe - where the market normally turns higher into January. In other words, seasonality tends to support the idea of 3633.40 SPX CASH holding any downside, for a continued push higher - or the aforementioned 'crash' to the upside - into January.
Above the 45-day cycle, the next key wave that we track is the 90-day cycle, which is shown on our next chart:
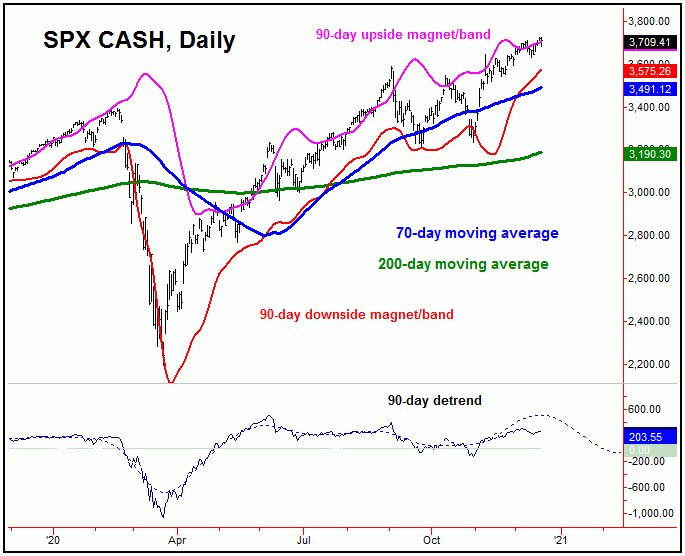
In looking at our larger 90-day wave, this cycle also bottomed back in late-October, and with that has been projected higher into January of 2021. In terms of price, there is potential for the SPX to push up to the low-to-mid 3800's before this wave tops out, with the 3800-3900 region also acting as a key resistance level for the coming months.
With the above said and noted, there is the potential for the SPX to reach up to the 3800-3900 region into mid-January, as the 90-day cycle next attempts to peak. From there, the probabilities will favor a fairly sharp decline back to the 70-day moving average, but with at least the potential for additional follow-through below the same.
Having said the above, the decline into the next 90-day trough is expected to end up as a countertrend affair. If correct, then the probabilities are 85-90% that the next upward phase of this wave will take the SPX back to new all-time highs once again, before the next mid-term peak attempts to form - coming from the larger 360-day cycle:
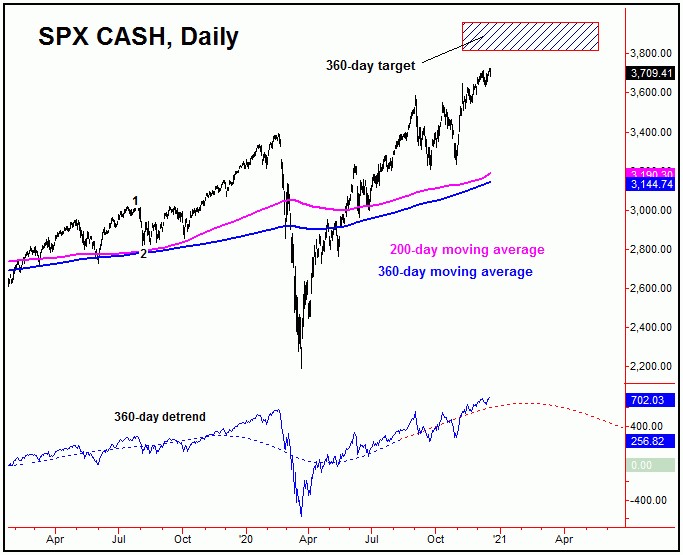
In terms of price, back in the Summer of this year our 360-day cycle confirmed an upside target to the 3812.56 - 3960.44 SPX CASH region - which we noted had an 85% probability of being met before the wave next topped. We are now within earshot of meeting the lower-end of our objective, which could be hit as soon as January.
Having said the above, I have noted in our Market Turns report (which focuses on the U.S. stock market) that there is the decent potential for the SPX to push up to the 4100's or better - before the next mid-term peak attempts to form. That peak is expected to come from the aforementioned 360-day cycle.
For the bigger picture, once the next top does form with our 360-day wave, the odds will favor the largest percentage decline of 2021 to materialize. In terms of price, the probabilities will favor a decline of 13-17% or more off the top, with the 360-day moving average acting as the eventual magnet.
Even with the above said and noted, until proven otherwise, the next downward phase of the 360-day cycle move is favored to end up as another (albeit larger) countertrend affair - inside the upward phase of the even-larger four-year component, which is shown again on the chart below:
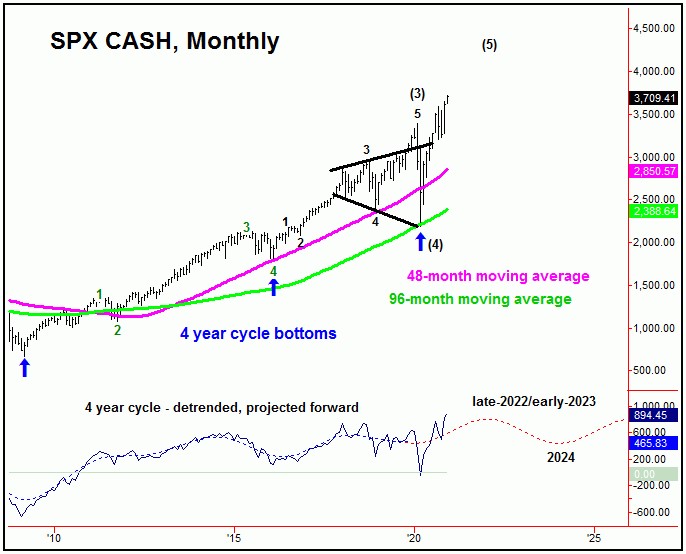
The Four-Year Cycle in U.S. Stocks
The last four-year cycle bottom for U.S. stocks was registered back in March of this year, doing so with the tag of the 2191.86 figure on the SPX. With that, due to statistical time assumptions, its current upward phase is projected to remain intact into at least the year 2022, though it could well remain higher into 2023 - before forming its next peak. Its next trough - if made on schedule - is projected for the year 2024.
In terms of price, the average rallies with this wave - when forming a 'higher-low' - have been around 100% from trough-to-peak, which suggests the 4400's on the SPX will be tested before all is said and done.
For the bigger picture, from whatever peak that forms with this four-year wave into the 2022 or 2023 timeframe, the probabilities will favor a minimum correction back to the 48-month moving average or lower on its next downward phase. In terms of patterns, that decline currently is expected to remain above the March, 2020 trough, and, if correct, should give way to higher highs again on its next upward phase into the year 2026 - then to be on the lookout for the next major price top for U.S. stocks. Stay tuned.
Jim Curry
The Gold Wave Trader
http://goldwavetrader.com/
http://cyclewave.homestead.com/
Jim Curry is the editor and publisher of The Gold Wave Trader and Market Turns advisories - each of which specializes in the use of cyclic and statistical analysis to time the Gold and U.S. stock markets. He is also the author of several trading-related e-books, and can be reached at the URL's above.


