U.S. Stocks Moving into Topping Range


 Last week's trading saw the gold market forming its low again into Tuesday's session, here doing so with the tag of the 1763.50 figure (June, 2021 contract). From there, a firm push higher was seen into Wednesday, with the metal running all the way up to a peak of 1798.40 - before backing off the same into the weekly close.
Gold Market (Quick Update)
From the comments made in recent articles, the last rally of significance was expected to come from the 72-day cycle in gold, which is shown again on the chart below:
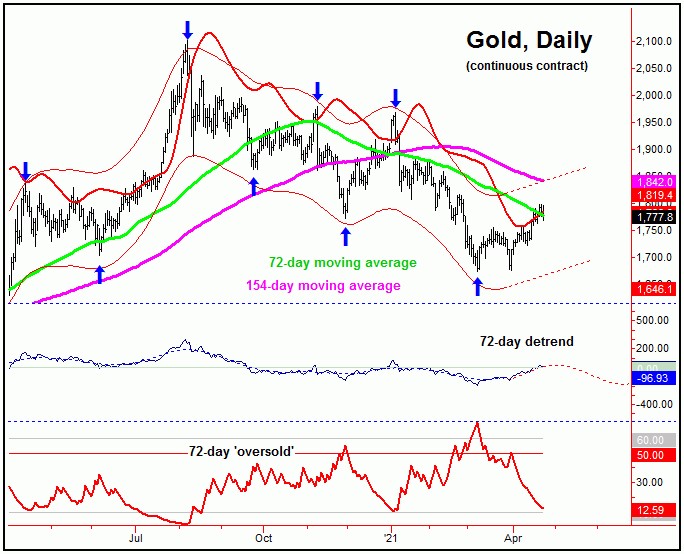
Our last trough with the 72-day wave in gold was registered back in early-March, doing so at the 1675 figure. From there, its upward phase was expected to see a minimum rally back to the 72-day moving average - which has now been satisfied with the action seen into early last week.
Having said the above, there is still plenty of time left before our 72-day cycle is projected to top. With that, I think the probabilities are decent that Gold will see a push on up to the higher 154-day moving average in the coming weeks, before the next key peak attempts to form - which should come from this same 72-day cycle.
Gold's Bigger Picture View
For the mid-term picture with gold, the next larger-degree rally phase is expected to come from the 310-day cycle, shown below:
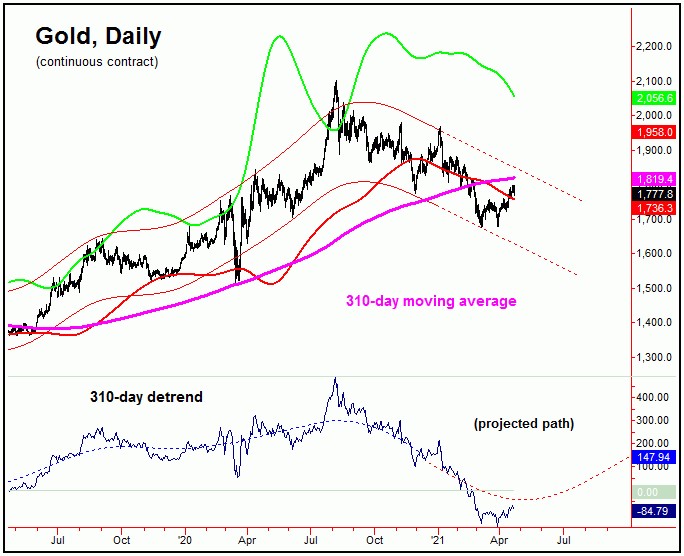
While there are some technical indications that suggest this 310-day component to have bottomed back in March, the same has yet to actually be confirmed with price. Once this wave does confirm a turn, the probabilities will favor the next multi-month rally phase to assume control in the gold market, one which sees the upper 310-day cycle band (in bright green) acting as the eventual upside magnet to price.
U.S. Stocks Moving into Topping Range
From the comments made in past months regarding the U.S. Stock Market, the larger uptrend was projected to remain intact well into the Spring of this year, primarily due to the 360-day time cycle, which is shown again on the chart below:
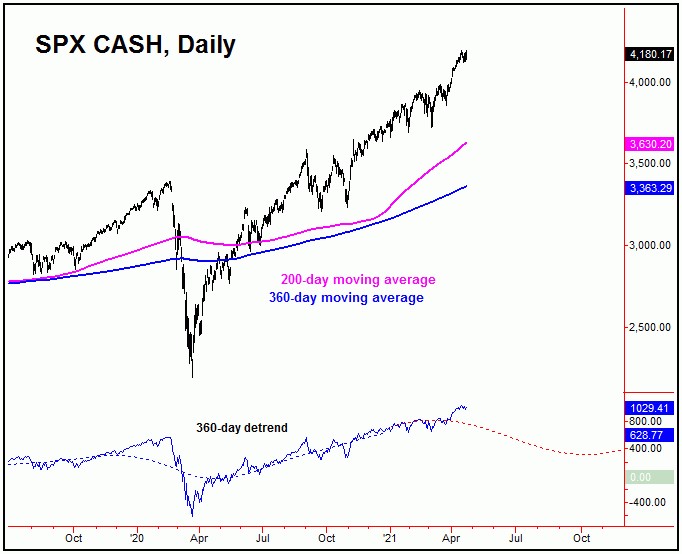
In terms of price, back in the Summer of last year we were able to confirm an upside target with this 360-day cycle to the 3812.56 - 3960.44 SPX CASH region. This target had an 85% probabilities of being met - and which was finally satisfied with the action seen into early this year.
Having said that, as noted in our daily/weekly Market Turns reports (which focuses on the U.S. stock market), the upward phase of this 360-day cycle was projected higher into the month of May. That assessment came from a statistical analysis of this 360-day wave, which showed that its average rally phases - when coming off a ‘lower-low’ - took around 282 trading days before completing.
With the above said and noted, the next mid-term peak is expected to come from this 360-day cycle, which - in now moving into topping range - could be registered at anytime. Once this peak is set in place, the probabilities will favor the largest percentage decline of this year playing out in the U.S. stock market, one which sees the 200-day moving average or lower acting as an ideal price magnet.
In terms of patterns, the next decline phase of this 360-day wave is favored to end up as a countertrend affair, due to the position of our next larger cycle, the four-year wave:
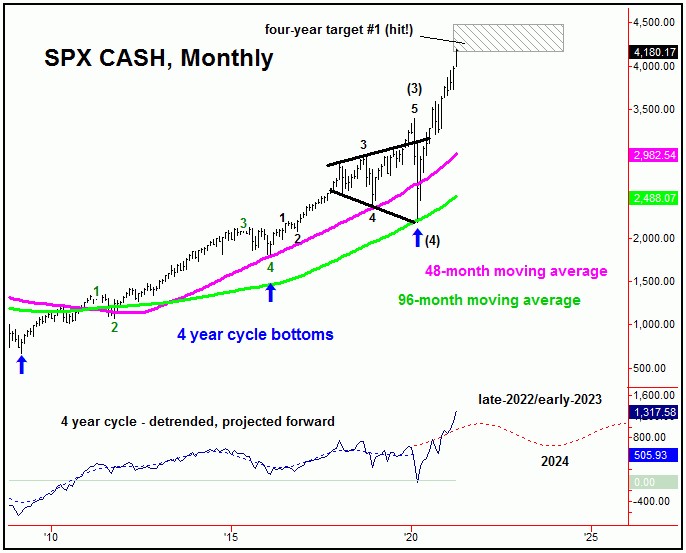
The last trough for the four-year cycle was made in March of 2020, doing so at the 2191.86 SPX CASH figure. From there, its upward phase was later confirmed to be back in force, with an initial price target (triggered last Summer) to the 4157.83 - 4485.31 SPX CASH range. With the action seen in recent weeks, the lower end of this target zone has now been satisfied.
Even with the above said and noted, we recently confirmed a brand new upside target for this four-year component, which is to considerably higher price levels than already seen. This precise details of this target - including when it is expected to be met - are noted in our daily/weekly Market Turns report.
For the mid-term picture then, the next mid-term correction phase is expected to come from our 360-day cycle in U.S. stocks, and which is coming due. That correction is likely to be very sharp - and, if correct, will likely have everyone thinking that the larger bull market could be over. However, the overall configuration of the larger four-year wave tells us to expect the coming decline with the 310-day cycle to end up as countertrend.
For the bigger picture, a countertrend correction with the 360-day cycle in the coming months - if seen as expected - should give way to the next mid-term upward phase for U.S. stocks. The key note is that the average upward phases of this wave have, historically, seen rallies of 40% from trough-to-peak - thus giving us some idea of the magnitude of the next expected rally phase of this cycle.
For the longer-term outlook, the next rally phase of the 360-day cycle should eventually take the SPX into its next major peak - expected to come from the larger four-year wave. This is likely to be made sometime well into the future, and should be preceded by certain technical indications - none of which we are seeing at the present time. More on all as we continue to move forward.
Jim Curry
The Gold Wave Trader
http://goldwavetrader.com/
http://cyclewave.homestead.com
********


