US Stocks, The US Dollar And Israel’s TA 125


Let’s start with the April employment report issued by the Labor Department Friday, May 5th. The Bureau of Labor Statistics announced that the U.S. economy created 211,000 non-farm payroll jobs in April. However, this is a gross exaggeration as the BLS CES Birth/Death report showed that of the 211,000 new jobs supposedly created, 255,000 were a guess, an estimate of new jobs created by new businesses they think may have started up in April in excess of jobs lost from businesses that closed down in April.
This CESBD adjustment to the employment numbers is not a counted number, is a fabrication of sorts. New startup businesses do not typically announce their opening to any government agency, and do not report new jobs created, and further if any did start up, any new hiring likely does not pay wages that are commensurate with well established businesses. Often, people are hired at below market wages with promises for future advancement opportunities and stock options etc… to entice them to work for the new startups. Benefits are usually below market as well. Businesses that close down also do not typically report this decision to any government agency, so counting these figures is nearly impossible. It is a guess that padded the reported employment new jobs figure for April. So, the truth is it is more likely the U.S. economy failed to create any net new jobs in April, and we may have seen a 44,000 decline in jobs. This is an alarming possibility, suggesting a recession may be in its infancy.
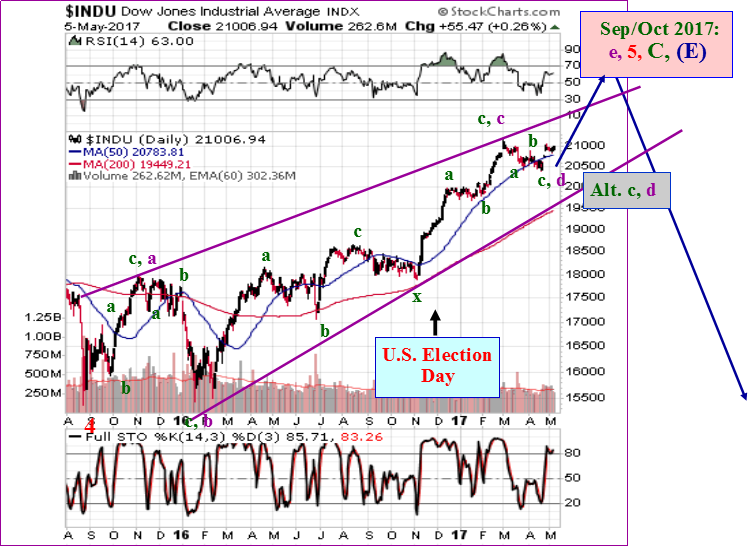
We are keeping an eye on the upcoming major Bradley model turn date scheduled for June 20th, 2017. This turn should produce a strong new vertical trend, most likely wave e-up that could take stocks to a top of major significance later in 2017. Wave e-up will complete a large termination top Rising Bearish Wedge from August 2015. Once it finishes, a powerful decline in the stock market will occur. The Fed has a massive balance sheet that they want to unwind, which if they do, would suck liquidity from the economy like a celestial black hole, which would undoubtedly start a severe Recession at the least. The fiscal plan to reduce taxes could help offset this monetary tightening from the Fed, but the two would be opposing forces that result in a cancellation of any pro-growth fiscal policies. Monetary tightening would increase interest rates, reduce borrowing, and reduce capital available for expansion.
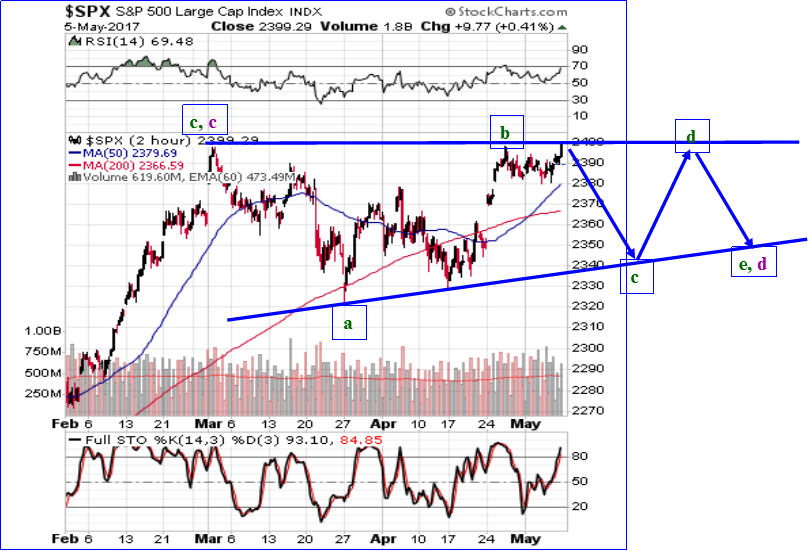
Stocks rose Friday, May 5th, and what is key at this point is to see if the S&P 500 and Industrials can break out decisively above their March 1st highs. Those levels are 2,400.98 in the S&P 500 and 21,169.11 for the Industrials. At this point we believe the highest probability short-term pattern for Blue Chip stocks is an Ascending Bullish Triangle in formation for wave d-down of the Rising Bearish Wedge from August 2015. If this is the case, there could be three more subwaves for this pattern, and the March 1st highs should not be exceeded except by a very minor amount. If this pattern is occurring, then stocks should soon decline to the rising bottom boundary of this Triangle that started March 1st. This coming decline would be subwave c-down, with a downside price target of 20,500 for the Industrials and 2340 for the S&P 500. From those levels, stocks should bounce back toward the March 1st levels, then drop one more time to complete the pattern, possibly around that June 20th Bradley model turn date.
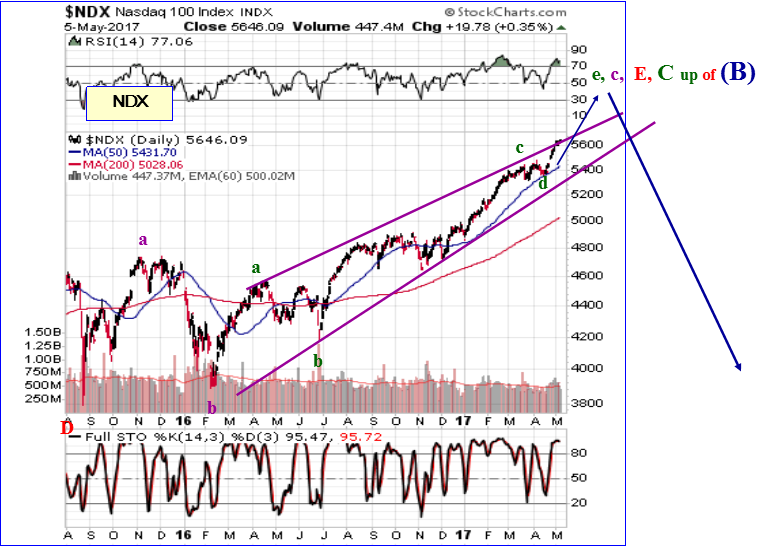
The NASDAQ 100 is already inside its wave e-up leg, the final wave to complete the Rising Bearish Wedge shown in above chart. It likely has further to go on the upside over the coming months.
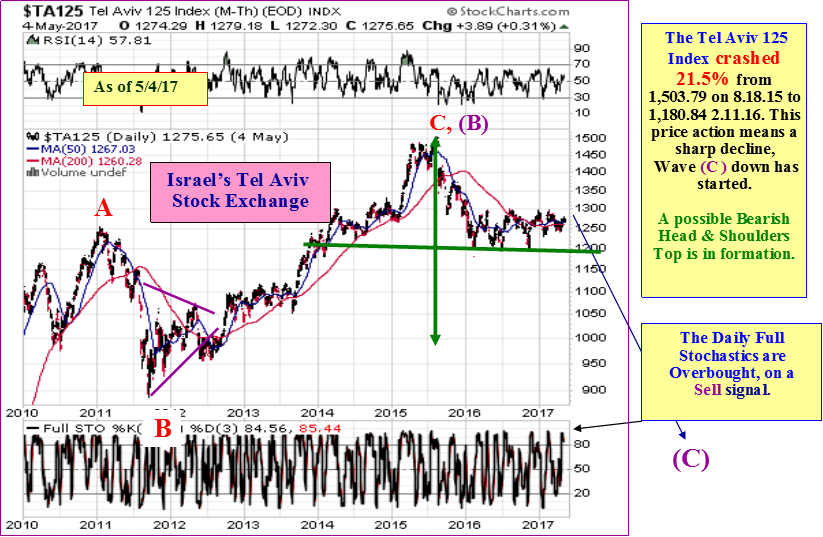
I again want to bring up a point from our International Weekend market report, which should be very concerning to all investors. Israel’s TA 125 stock index has completed a Head & Shoulders top, which is a high probability pattern, and in this case, warns of a significant coming decline to Israel’s stock market. Could this be warning us, an early warning, that a global military conflict involving Israel is coming later this year, one that would disrupt the Middle East, and have the fundamental impact of pushing Oil prices, the US Dollar, precious metals, U.S. Bonds and Mining stocks higher, and U.S. and global stocks lower? All the charts we track are looking for trends that are likely to fundamentally occur should a Middle East military conflict arise.
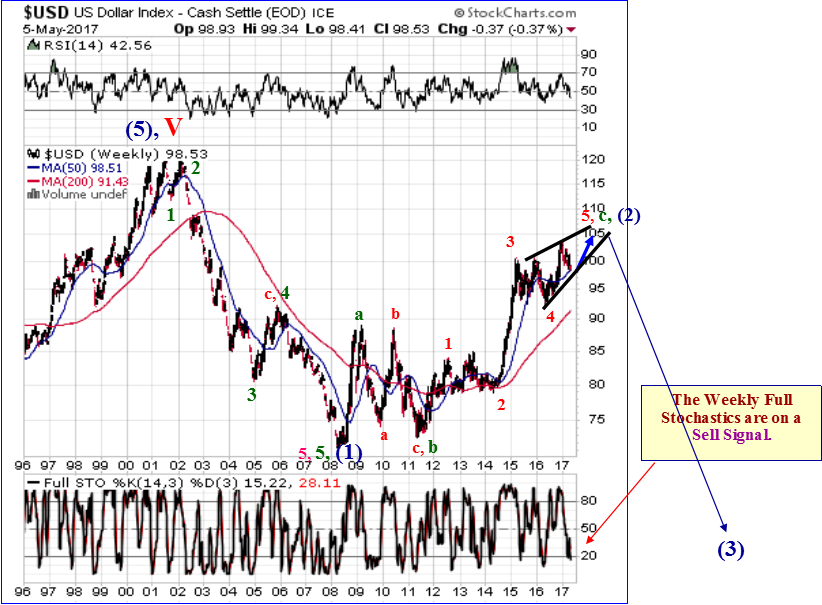
The US Dollar looks to be inside a rising trend that should complete later in 2017.
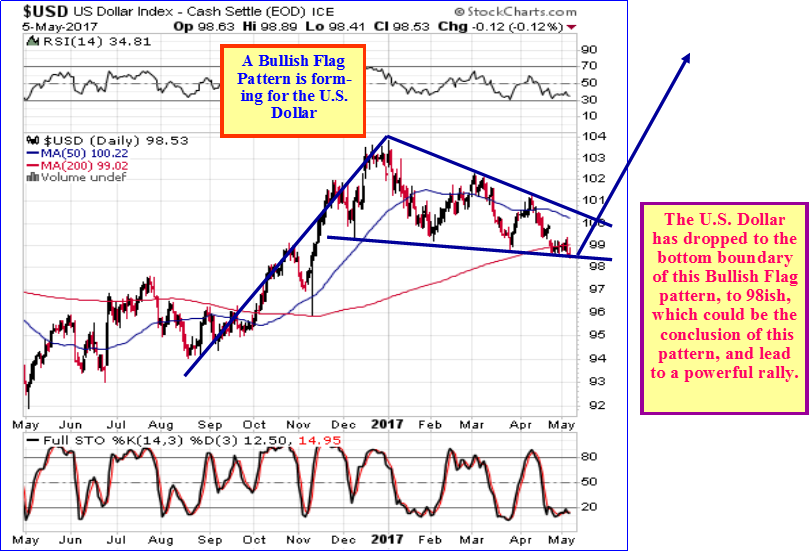
Between now and then, the Dollar needs to rally further, and there are several patterns that support this forecast. Further, the Dollar is very oversold this weekend. Above we see that the U.S. Dollar is finishing the pennant portion of a Bullish Flag pattern. Flags fly at half mast, which means the extent and direction of the rally moving into the pennant will be the same direction with the same upside potential as the previous rally, the pole for the flag. We see that the pennant is very well defined and is setting boundaries for all moves since December 2016. The U.S. Dollar should soon start a long powerful rally.
The other point to make about this pennant pattern for the Dollar is it is taking shape as a Declining Bullish Wedge and it is very close to completion, which suggests in the near future the Dollar is going to embark on a strong rally. A breakout above 100.25, the upper boundary of the pennant or wedge, would signal the next strong rally leg has started.
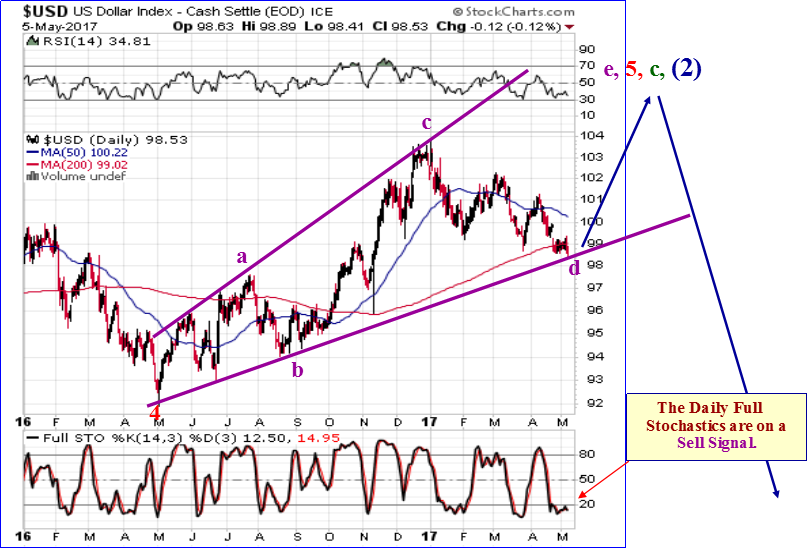
Above we show another potential bullish pattern for the US Dollar, forming a rather interesting pattern since May 2016, a Broadening Ascending Wedge. Rare but informative. This is a topping pattern once it finishes. There are several excellent guidepost points to draw the well-defined upper and lower boundary lines. What this pattern is telling us is the Dollar is going to rally to the 104 to 106ish area. That rally will conclude this pattern, likely about the same time stocks top, and then the US Dollar will plunge along with the stock market, probably late in 2017.
********
At www.technicalindicatorindex.com we have developed proprietary key trend-finder indicators and also track and identify high probability starts and conclusions of trends for our subscribers. Any trading program is only as good as the entry and exit indicators used.
Get a FREE 30 Day Trial Subscription to receive our Daily and Weekend U.S. and International Market Forecast Reports at www.technicalindicatorindex.com Simply click on the button at the upper right of the home page. We cover stock markets and Gold daily and have Buy / Sell signals. We also offer a Platinum Trading service. Email us at [email protected] for information on that program.
When did Noah build the ark? Before it rained. Well, it is starting to rain. We believe it is now time to make sure our arks are built and can float. We can help you at www.technicalindicatorindex.com with our daily and weekend market updates, or conservative portfolio model, and Platinum educational Trading program.
Do not be satisfied hearing what the market did; learn how to predict what the market is going to do. Join us at www.technicalindicatorindex.com as we study the language of the markets. Markets tell where they are headed. Technical Analysis is the science where we learn and apply the forecasting language of the markets.
Dr. McHugh’s book, “The Coming Economic Ice Age, Five Steps to Survive and Prosper,” is available at amazon.com at http://tinyurl.com/lypv47v
Robert McHugh Ph.D. is President and CEO of Main Line Investors, Inc., a registered investment advisor in the Commonwealth of Pennsylvania, and can be reached at www.technicalindicatorindex.com. The statements, opinions, buy and sell signals, and analyses presented in this newsletter are provided as a general information and education service only. Opinions, estimates, buy and sell signals, and probabilities expressed herein constitute the judgment of the author as of the date indicated and are subject to change without notice. Nothing contained in this newsletter is intended to be, nor shall it be construed as, investment advice, nor is it to be relied upon in making any investment or other decision. Prior to making any investment decision, you are advised to consult with your broker, investment advisor or other appropriate tax or financial professional to determine the suitability of any investment. Neither Main Line Investors, Inc. nor Robert D. McHugh, Jr., Ph.D. Editor shall be responsible or have any liability for investment decisions based upon, or the results obtained from, the information provided. Copyright 2017, Main Line Investors, Inc. All Rights Reserved.


