U.S. Stocks 'Vacuum' Looms Close; Gold Update


 Last week's trading saw the Gold market forming its low in Monday's session, here doing so with the tag of the 1841.10 figure. From there, a firm push higher was seen into mid-week, with the metal hitting a Wednesday peak of 1891.30 - before consolidating the action into the weekly close.
Gold Market Update
For an update on the gold market, in my last article (posted 5/9/21), I mentioned that the next short-term peak was due to materialize for gold, coming from the smallest-tracked wave, the 10-day cycle:
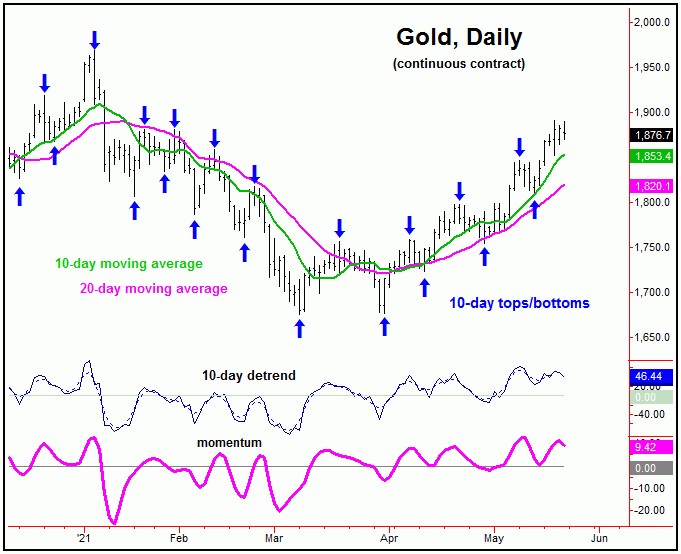
From my 5/9/21 article: "In terms of price, gold is likely to see a quick drop back to the 10-day moving average in the days ahead, as the next short-term bottom forms."
As mentioned, the 10-day moving average was noted as the price magnet to the recent downward phase of the 10-day cycle, which was easily met, dropping right back to this 10-day average into the 5/13/21 trough. In our market report, we noted that the odds favored that decline to end up as countertrend, giving way to higher highs on the next swing up - which we have obviously seen.
With the above said and noted, at minimum, another short-term dip is due to materialize, coming from this same 10-day cycle. And, as before, the 10-day moving average would be a normal price magnet, a move which may - or may not - end up as countertrend, due to the position of the larger 34 and 72-day cycles.
Gold's 3-6 Week View
As mentioned in past articles, the upward phase of the 34 and 72-day cycles was seen as being in force, ideally pushing higher into the mid-May timeframe or later. Here is the smaller of the two waves, the 34-day component:
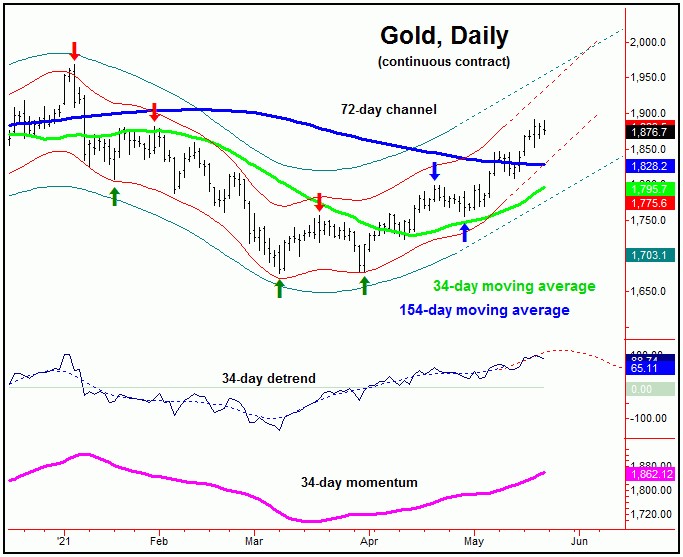
In terms of price, as mentioned over the past month or so, the higher 154-day moving average was noted as the ideal upside magnet to price - which was obviously hit with the action that followed. This moving average was also noted as a resistance level, which has recently been taken out to the upside, thus putting the same as first support to any short-term decline.
Stepping back then, the next swing top - and thus correction phase - is expected to come from the smaller 34-day wave, and which is due to materialize at anytime, with this cycle next projected to trough in the month of June. In terms of price, we would be looking for the 34-day moving average to act as the magnet to the next decline phase of this wave, which has yet to be confirmed to be in force - with the exact reversal level noted in our thrice-weekly Gold Wave Trader report.
Gold Prices, Mid-Term
For the mid-term picture, as mentioned in past articles, we were awaiting confirmation of a turn higher with one of our largest-tracked waves, the 310-day cycle:
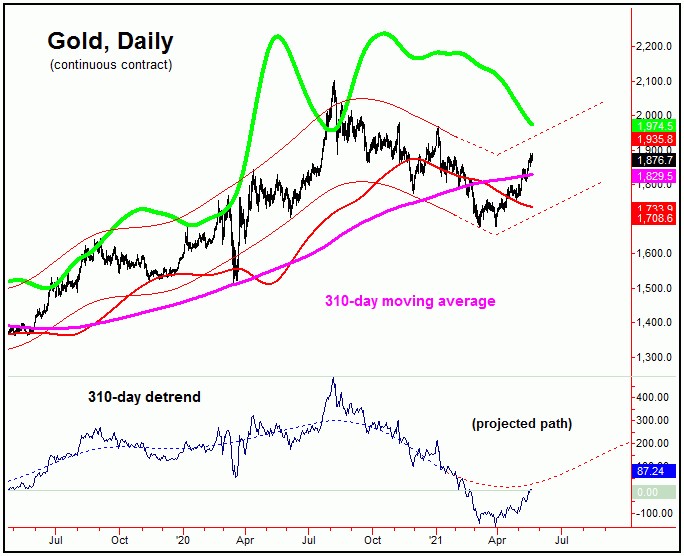
With the action seen in past weeks, we now have our best indication/confirmation of a turn higher with our 310-day component, with the current upward phase of this wave favored to remain intact into what looks to be early next year - but with the normal up-and-down movements in-between.
With the above said and noted, the probabilities favor the next correction phase of the smaller 34-day cycle to end up as countertrend, giving way to higher highs in the coming months, as the upward phase of the larger 310-day cycle progresses.
U.S. Stock Market 'Vacuum'
As mentioned in some of my prior articles from back in late-April/early-May, the U.S. stock market - as measured by the S&P 500 index, or 'SPX' - was seen as topping. What followed was a sizeable correction, with the index dropping some 4.2% in the weeks that followed, so far forming a mid-May low of 4056.88 on the SPX.
Even with the above said and noted, we are looking for a much larger-degree correction to play out in the coming months, a 'vacuum' period for U.S. stocks - one which will pull prices down substantially off their highs, in what is expected to be the largest percentage decline of this year.
Going further with the above, the coming 'vacuum' period for the U.S. stock market should come from two of our largest-tracked waves, the 180 and 360-day cycles, with the larger 360-day component shown again on the chart below:
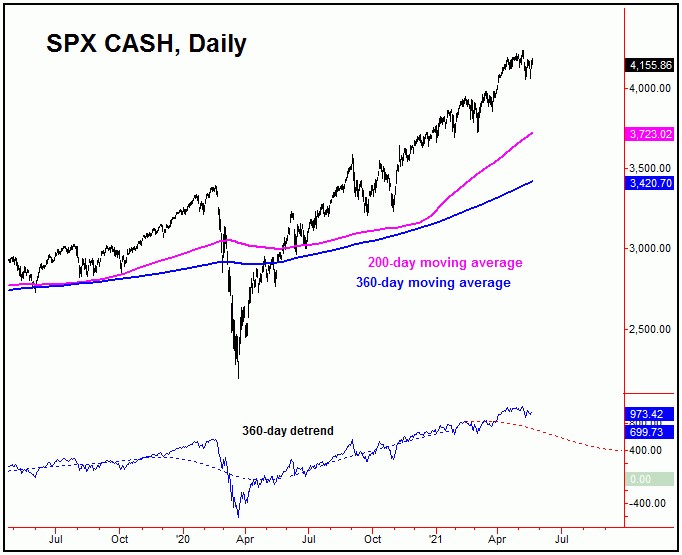
Even with the above, it is not clear yet as to whether our 180 and 360-day cycles have actually topped - with a higher high for the swing having the 'ideal' technical look to complete this peak. There is a key turn date coming up very soon - which has the potential to mark this high - with the exact details noted in our daily Market Turns report, and which focuses on the U.S. stock market.
Alternately, the 3988.00 SPX CASH figure is our current downside ‘reversal point’ for the combination of 180 and 360-day waves. In other words, if taken out to the downside at any point going forward, this would be our best indication/confirmation that the rally phase of these waves is complete - and their next downward phase is back in force. That number is expected to rise going forward, depending on the action seen in-between.
Good News/Bad News
The bad news is that a larger-degree decline is readying to unfold for the U.S. stock market, once again coming from the aforementioned 180 and 360-day time cycles. The good news is that this decline is anticipated to end up as a larger countertrend affair, due to the position of the bigger four-year wave, which is shown again below:
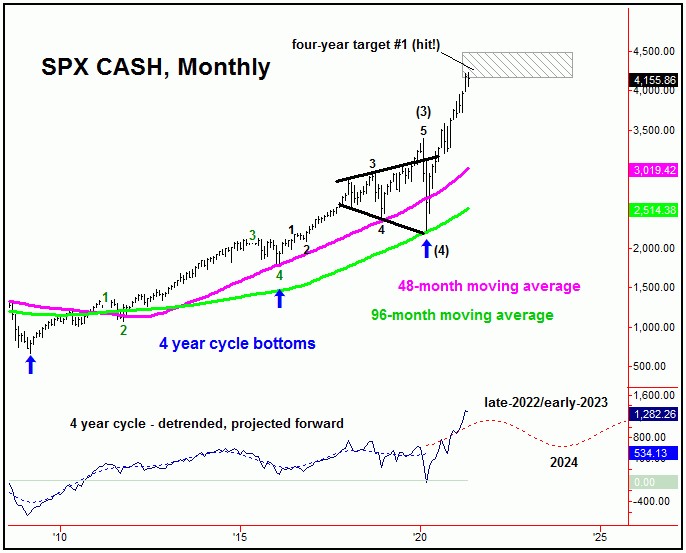
The four-year cycle is seen as 294 trading days along and is currently labeled as bullish, ideally pushing higher into what is looking to be the late-2022 timeframe or beyond. With that, the next downward phase of the smaller 180 and 360-day cycles is expected to end up as countertrend - though it could be a very scary affair.
As mentioned in prior articles, the coming decline in U.S. stocks - if the 180 and 360-day cycles do their job - will trick many into thinking that the larger bull market phase has run its course. We will be tracking (and trading) this very closely in the coming months, as the action plays out in real-time. Stay tuned.
Jim Curry
The Gold Wave Trader
http://goldwavetrader.com/
http://cyclewave.homestead.com/
********
More from Gold-Eagle


