Various Markets; Weekly Views


It occurs to me that in public writing I tend to bludgeon people with macro fundamentals (like gold vs. positively correlated markets, yield relationships and even confidence in global policy makers), market indicators (VIX, Equity Put/Call, Gold-Silver ratio, Sentiment, Participation, etc.) and other views beneath the surface of things. So much so that I sometimes forget that people might like to see simple nominal charting as a frame of reference.
We update charts like these every week in NFTRH, but I have done relatively few for public review. So here it is, a simple weekly chart update of various markets with very limited commentary interference from me.
US Stock Market
As you can see, US indexes have so far held critical support. Best projected case would be a bounce to SPX 2000 (+/-). The market continues to roll over on the intermediate trend as of now.

If the above is suspect to bearish, the broader US indexes are just bearish. Lower lows and lower highs abound and resistance is noted.
Global Stock Markets
Every week we review a broad global landscape, but for the purposes of this post we narrow it down to Europe, Toronto and Japan. Each market is in an intermediate downtrend. TSX is working on a cyclical bear. They are all trying to bounce from support areas and they are all bearish until they break those trends.
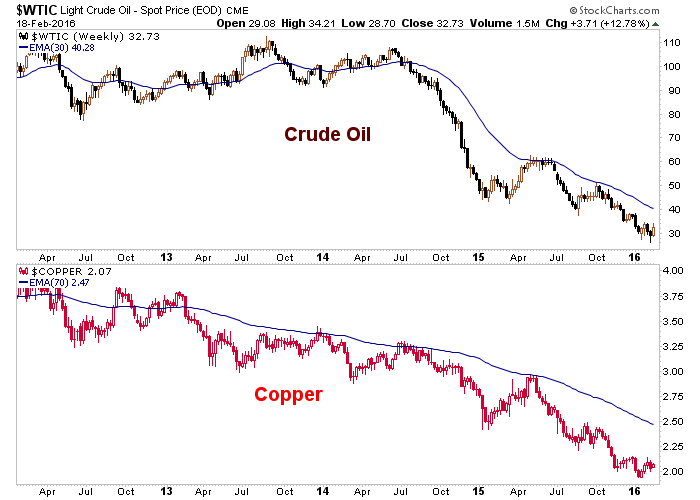
Commodities
This chart is so simple. Commodities are bearish and have been for years.
Despite the hype that crops up occasionally in these two headline commodities, they are marching along in bearish trends. We have had a technical target on Doctor Copper of $1.50/lb. going back years now (by monthly charts).
Precious Metals
We use many different charts over different time frames to look at this now-favored (risk ‘off’/counter-cyclical) sector. Here is the simplest chart of gold I can imagine. The EMA 75 was our guide saying “BEAR” for years. Hence, that is very important support now (coinciding with a 38% Fib retrace level), eh?
Silver however, is still dealing with its comparable resistance in the form of the EMA 55 and the October 2015 high.
HUI, like gold, made an important move above the moving average that defined its bear market (EMA 55). It also popped above the October 2015 highs. As you can see, 140 is very important support for Huey now. It has already been tested once.
Bottom Line
Okay, so there were a couple indicator(ish) items included. If I were to put a ‘bottom line’ on a world of asset markets I’d call it a risk ‘off’ global backdrop. Stock markets are bearish but bouncing, commodities are bearish (in the absence of overt inflation signals), bonds still see deflation, but we can anticipate a change to an inflationary issue out on the horizon. The gold sector is doing exactly what it should do in this environment; getting bullish. Currencies are reflecting a global waning of confidence in policy makers.
For reference see: Gold’s Macrocosm: The Planets Align
********
Subscribe to NFTRH Premium for your 25-35 page weekly report, interim updates and NFTRH+ chart and trade ideas or the free eLetter for an introduction to our work. Or simply keep up to date with plenty of public content at NFTRH.com and Biiwii.com. Also, you can follow via Twitter @BiiwiiNFTRH.
More from Gold-Eagle


