Wall Street Is Bull And Will Remain So!


Suspicion that there is surreptitious official support for Wall Street has gained much ground in the alternative media since the blatant Fed support for the stock exchange and the economy in 2009. Two more recent bear spikes on Wall Street tested official resolve to keep the stock market afloat and bullish, but failed to start a bear trend. Since April this year, efforts to maintain Wall Street near its current high level with frequent new all-time highs to boost investor confidence, required more and more blatant intervention. Exploration of last week’s action on the Dow-30 stocks reveals the footprint of what is done to keep Wall Street afloat and also explains why turnover on Wall Street has declined from what it used to be some time ago.
My 1980s model of the way prices and turnover vary over time implies the following to hold true, all based on how a market reacts to supply and demand:
- When neither bulls or bears in a market have a clear idea of its direction, the price drifts sideways on low turnover
- When bulls establish a rising trend, initially there will be some increased selling as bears use the opportunity to get out above the sideways drift
- When it is clear a rising trend is established, sellers prefer to hold back and wait for a better price, so that the volume declines again
- When sellers think the price is near or at a ceiling, they return to begin selling. The turnover picks up while the trend slows down and tops out, if selling is sustained. As the price tops out, it could again drift sideways on low volume or, if more aggressive selling continues, the price begins a bear trend
- In the latter case, the new bear trend that follows repeats the pattern, initially with some buyers stepping up at the lower prices to extend the period of relatively high volume, at least until it is clear to potential buyers that the bear is back and that they ought to wait for a better price, while the trend lower continues on low volume. When the price gets low enough, fresh demand increases the volume and the price begins to level off and then bottoms. Afterwards, either a sideways drift commences, again on low volume, until the bulls decide to get back into the market and the cycle repeats.
The 5 minute chart below shows the trading in the Dow-30 stocks on Wall Street for the past week. The start of trading each day is indicated with a short vertical blue line at the bottom of the price chart. A distinct change in the price-volume relationship is visible between the early part of the week and the later part after the market had shown strong bearish tendencies.
On Monday, the first half hour showed a gradual rising trend, ending with the volume standing as a tall green bar – the rally was running into selling resistance! When the sellers took over the market the DJIA gapped lower. During the next 50 minutes tall red volume bars show high turnover while the price was falling and finally bottomed.
This is a major change from expected behaviour; rational buyers should stand back when a new bear trend is established to wait for better prices. Here the selling started the moment the price fell, and remained high until the bottom was reached – clearly a prepared or well coordinated action, depending on the number of players involved in this. When the bears recognised what was happening, they stopped selling, allowing the price to bottom and begin to recover halfway, on relatively low volume.
When the sellers again appeared, they were quickly rebuffed with strong buying, again reversing the trend. From that point on the Bears knew the game was over, so that the price moved steadily higher on sustained low volume; the day ending on a high.
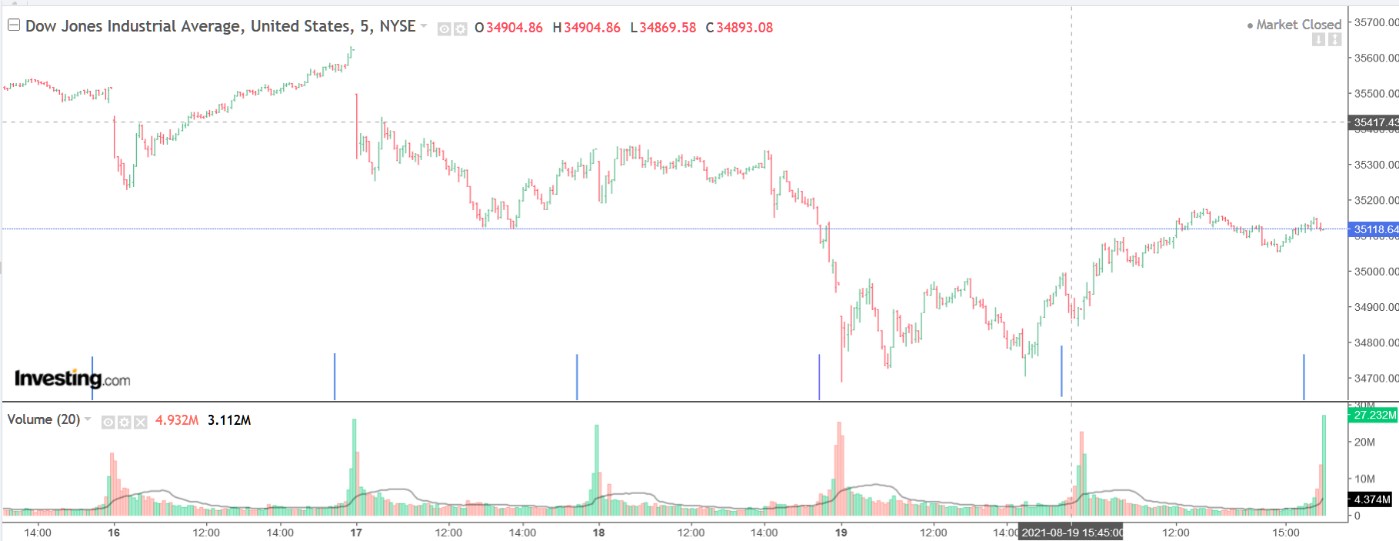
On Tuesday, the price moved sideways and higher during the first 20 minutes, but it required increasing volume every five minutes to sustain the rising trend. Renewed much selling again had the price gapping lower, but did not require much fresh buying to end the slide. Some churning took place on reduced turnover until the price made a bottom, after which it was allowed to drift lower, still on low volume, until the double bottom was made. The technical rebound that followed, still on low turnover in the absence of much selling, lasted until the market close.
On Wednesday, the price immediately moved higher, initially again on low volume. However, whoever was doing the buying soon had to step up to the plate to keep the price moving higher and the volume increased. Before 1000 new selling had the price dipping lower briefly. This failed to overcome the buying, so that the price continued higher and sideways until after lunch, when sellers appeared again. A new bear trend was soon reversed, but prices continued to drift lower to the close.
On Thursday the market began bearish and despite a jump in volume to show support was in place, the volume of selling still had the price gapping lower until mid-morning. It required a peak volume similar to the buying on the previous two days to reverse the bear trend, leaving a steep lower bottom spike in place. Afterwards, the price was volatile as the bulls and bears fought each other to a draw. By early afternoon the bulls had taken control and the price ended level with the two intermediate highs earlier that day, requiring only a relatively small increase in the volume to end on a higher note.
Into Friday’s open, the Dow futures market had been deeply negative for most of the day. Yet Wall Street opened up by more than 20 points, only to fall steeply within the first few minutes by about 50 points as sellers piled in. Being the last day of the week after two down days, a demonstration of Wall Street strength did not surprise. Soon, sustained strong demand set the trend for the day and had the market in a bull trend - on lower volume again as sellers held back. Why keep on selling if prices are moving higher? Having reached a high of 35 177 (+310 off the low) earlier, at the close at 35 120, the DJIA was still up 226 on the day.
Lots of detail, but the main point is that when sellers take over and Wall Street takes a dive, strong support almost immediately enters the market to halt the slide. Buyers – or is it one large Buyer? – do not wait for a lower price to buy a better bargain, as one would expect of a rational market, but acts in an irrational fashion to support the price and to make sure that negative sentiment does not overtake the market. Whenever a sell-off did take hold in the recent past since 2009, the recovery has always carried much higher than the point where the sell-off had taken hold, as is done here as well.
The behaviour is consistent – at sell-off time and during the trading when sellers have been taught they are mistaken about the desired trend. Selling is associated with high volumes to turn the tide, and a rising or sideways trend happens on low volumes. The low volume suggests the market effectively has only two active elements – the sellers who believe the market is much overbought and the prominent buyer of last resort. Most other market players prefer to sit on the sidelines and wait for a clear trend to appear out of the heavy churning going on. Their inactivity causes the daily volume totals to be much lower than when the whole market used to be more active.
Wall Street recovered from major panics and sell-offs, in 2009, 2018 and 202, in each case to then proceed to new highs. One will require a deep conviction to go short right now, given what has happened in the past and again during last week.
My speculation last week that the net short positions of the Commercials may have reached a point by the end of the previous week that would enable the release of the selling pressure on silver appears to have been mistaken – or perhaps just too early still. The gap island low was still intact when the week ended, with the net positions as Large specs = +21 220, Small Specs = +14 270 and Commercials = -35 490. The latter only decreased their net short position from 39 848 by 4 358 contracts during the previous week. This still leaves them too short for comfort and so selling pressure can be expected to continue until the specs get closer to going net short.
It is now evident that it is not only the Large specs that have to be convinced to at least disinvest and close their long positions or even go short, but also small Specs, who seem even more bullish in the face of a lower silver price. It seems near certain that unless there has been a significant change in the spec long positions, the silver price will be pushed even lower this coming week to see if the specs can be convinced by new margin calls to reduce their long positions.
Euro–Dollar
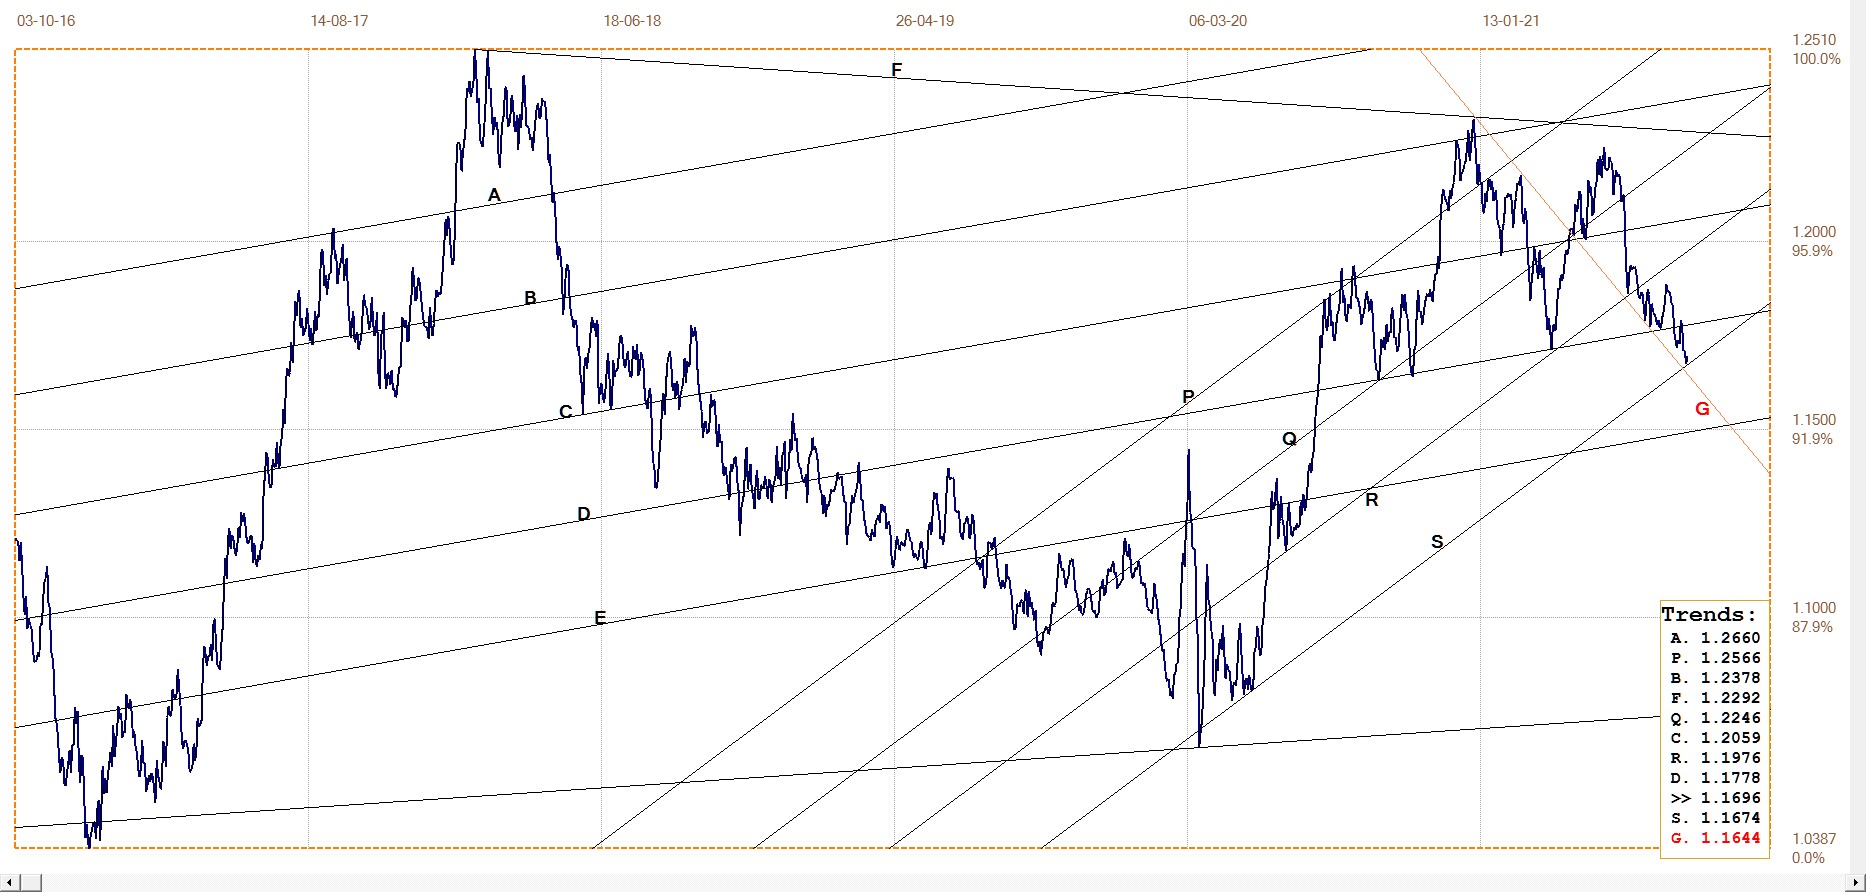
Euro–dollar, last = $1.1696 (www.investing.com)
The recent strength in the US dollar still has the euro moving lower along line G. After trying to hold at line and begin a recovery, the slide resumed to break below line D and reach line S, the bottom of bull channel PQRS. That was on Thursday; the small bounce off line S is a tiny hint that perhaps the dollar has ended its rally and is due to reverse and allow the euro to begin a more definite recovery than it did off line D.
A definite break below the bull channel will imply further strength for the dollar, to make shallower rising channel AE acting as the path of recovery for the euro, with line E as the next line of technical support. Much will now depend on whether the euro can hold above line C and perhaps later manage to break higher through line D.
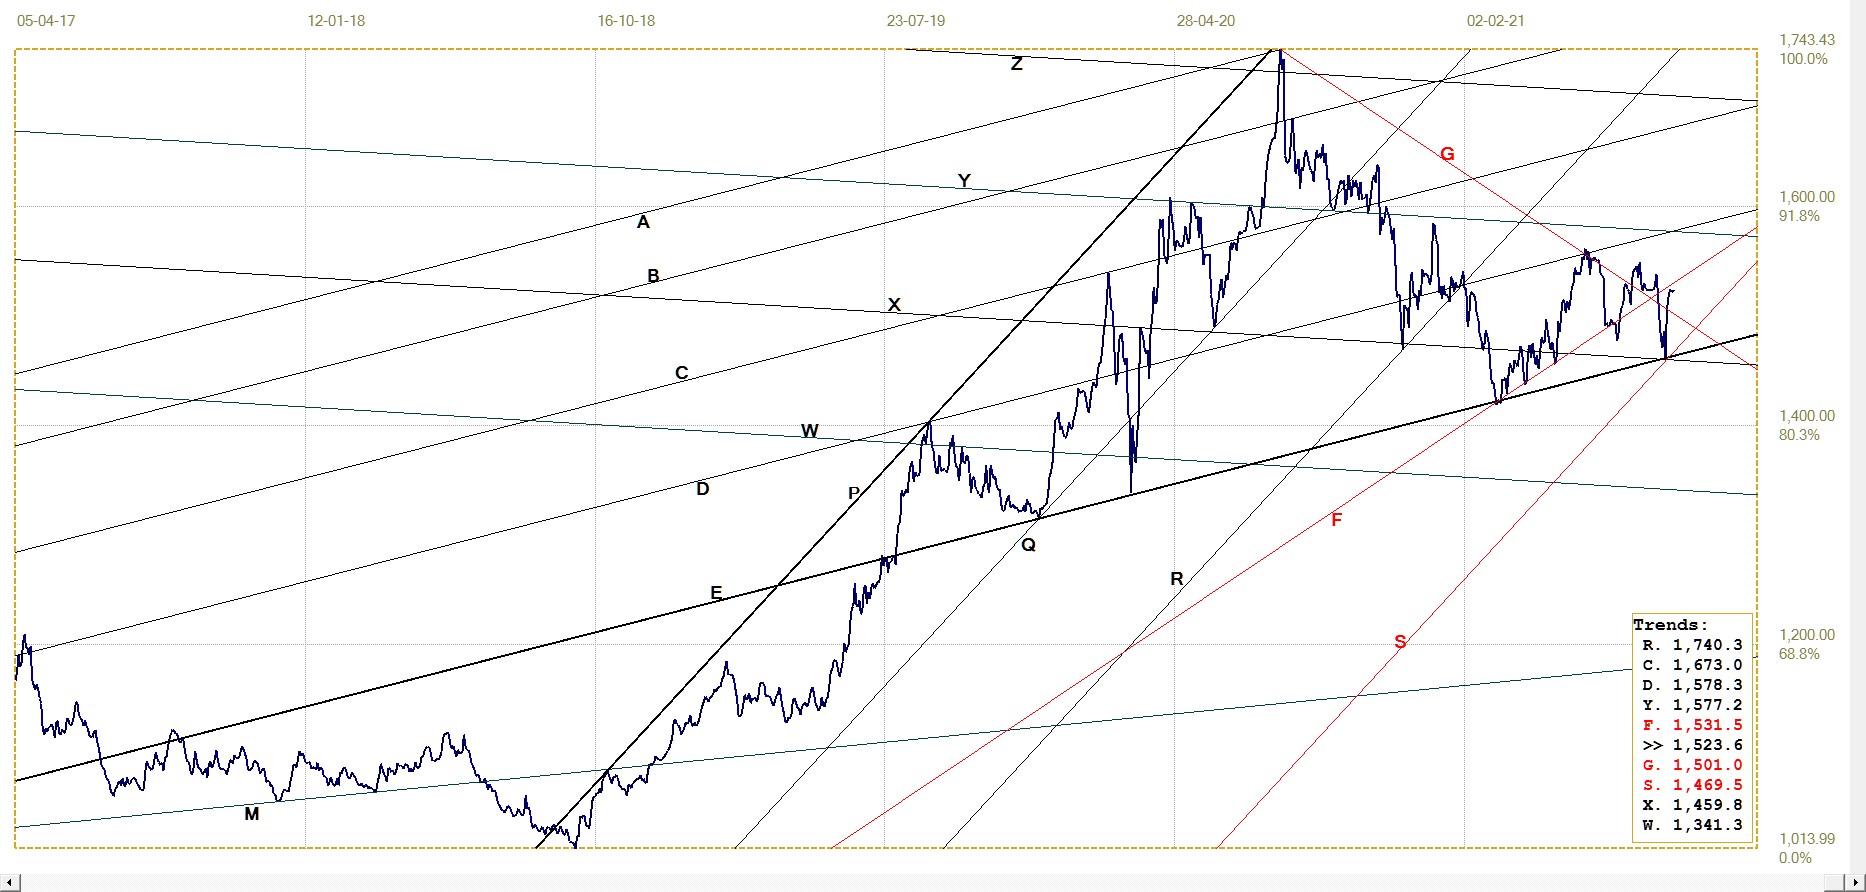
DJIA daily close
As discussed above, there is credible evidence that whenever Wall Street comes under selling pressure a buyer of last resort steps up to halt the slide, mostly as soon as the selling builds up and before it can gain momentum. Once the early selling has been blunted, is as if the bears accept the presence of very deep pockets in the market and typically remain quiet, except sometimes with a new probing attack, right through to the close of trading.
This behaviour has built a ragged top at least since early in April, complete with some new all time highs. Last week saw some new weakness that has not been recovered, but low volumes show there is no panic selling as yet. Given that support will appear when selling picks up, Wall Street should continue to hold, at least until panic erupts.
The intensity of the selling has been building up. Last week saw three down days for the first time in perhaps some months. Granted, on two of those days the loss was small, but on those two days the market was hauled back from being way down and the recovery barely failed to break into positive territory. Sentiment is changing on Wall Street and more selling can be expected.
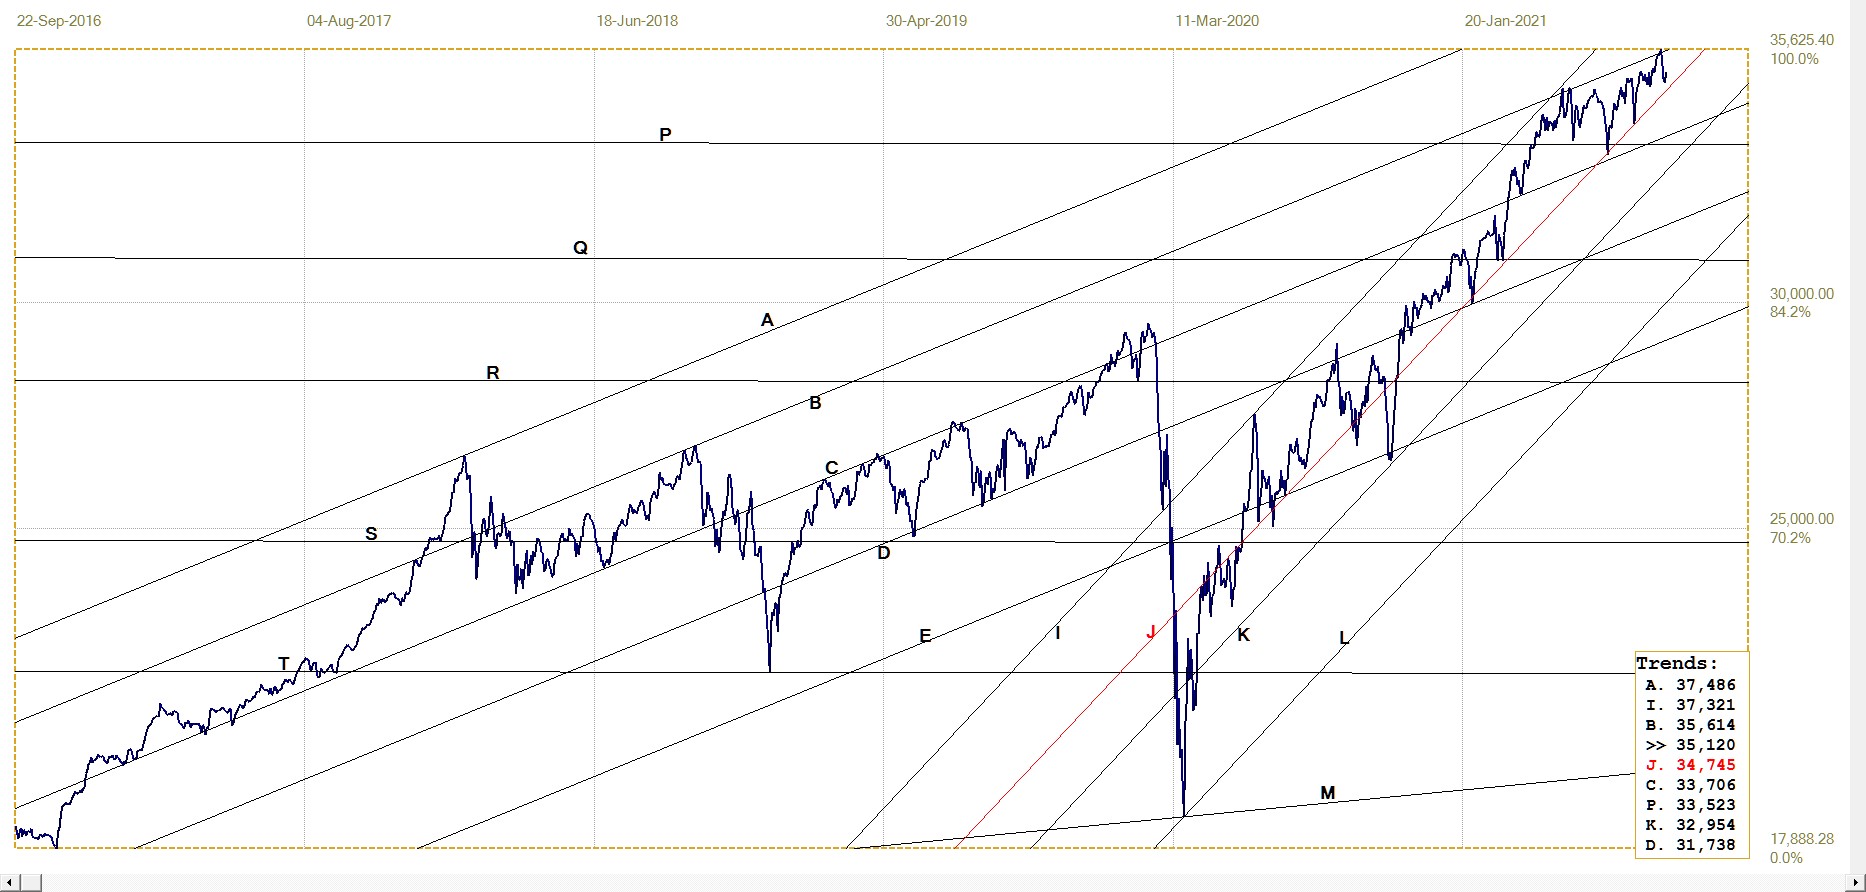
DJIA. last = 35120.08 (money.cnn.com)
Gold London PM fix – Dollars
As discussed a week ago, gold per the London PM fix reversed higher from its earlier low off line Y. However, the price is being kept away from any challenge on $1800 – success in that respect would drag the silver price higher and make it more difficult for the Cartel to complete the ambush in silver that is being set up for the specs.
On assumption that the ambush is a major effort to reduce the net short position of the Commercials, it seems unlikely that the price of gold will perform well this week – apart from the usual Comex end of month shenanigans also due to happen.
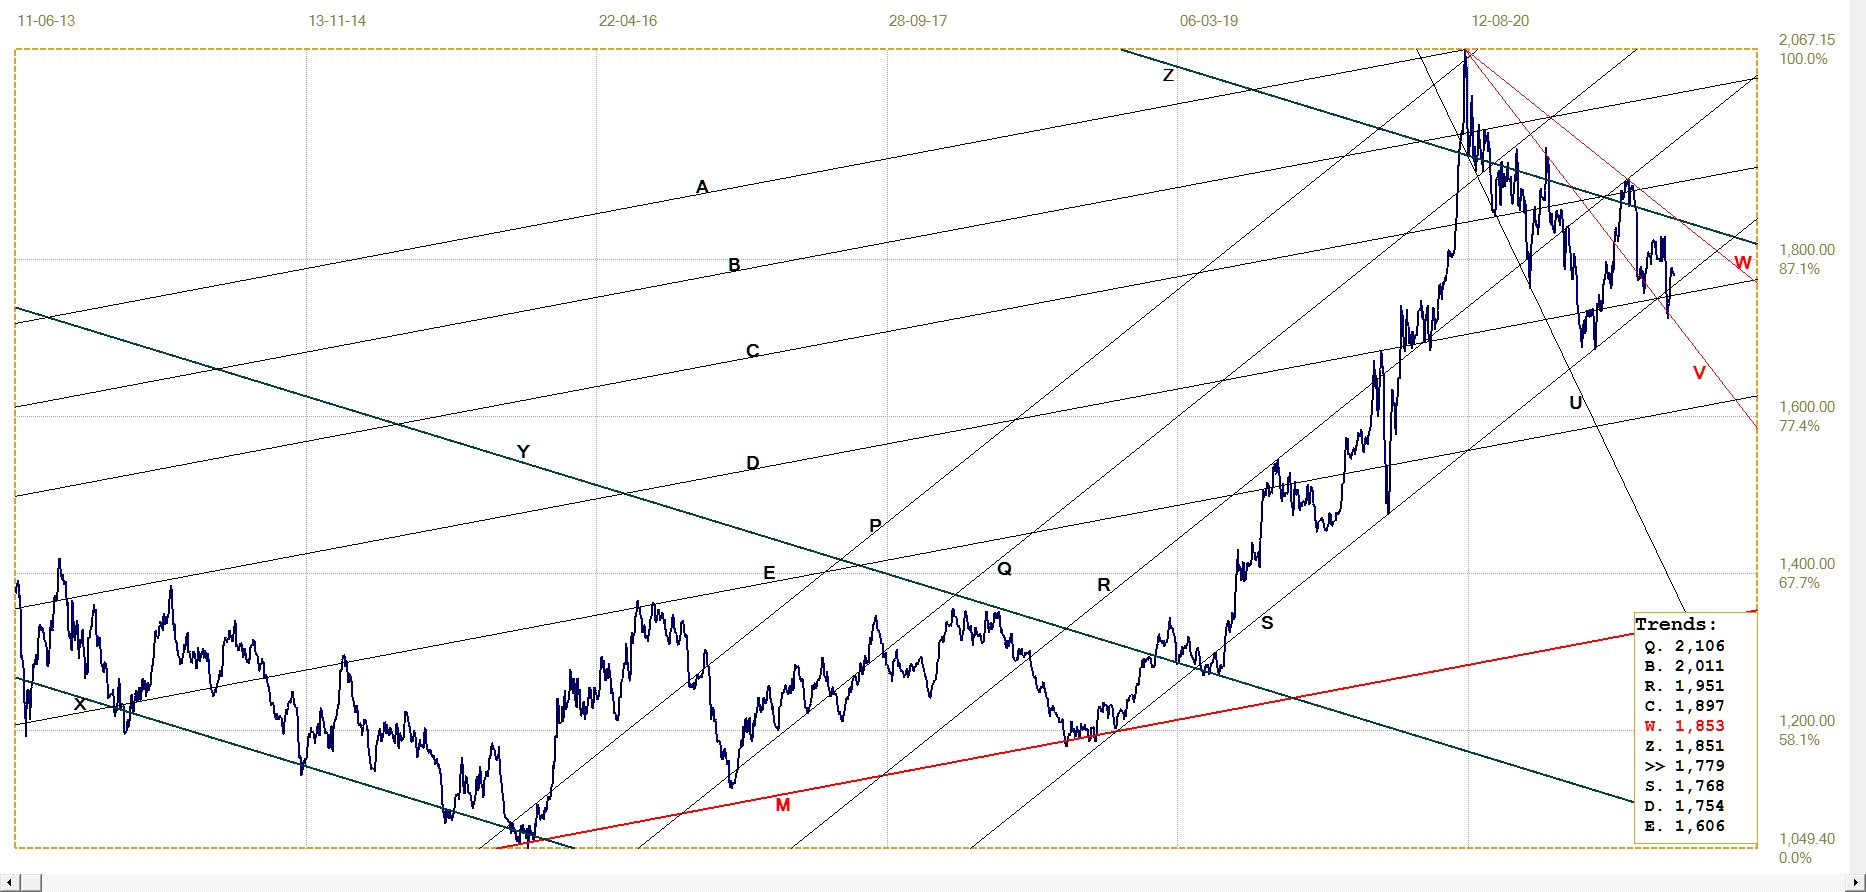
Gold price – London PM fix, last = $1779.05 (www.kitco.com)
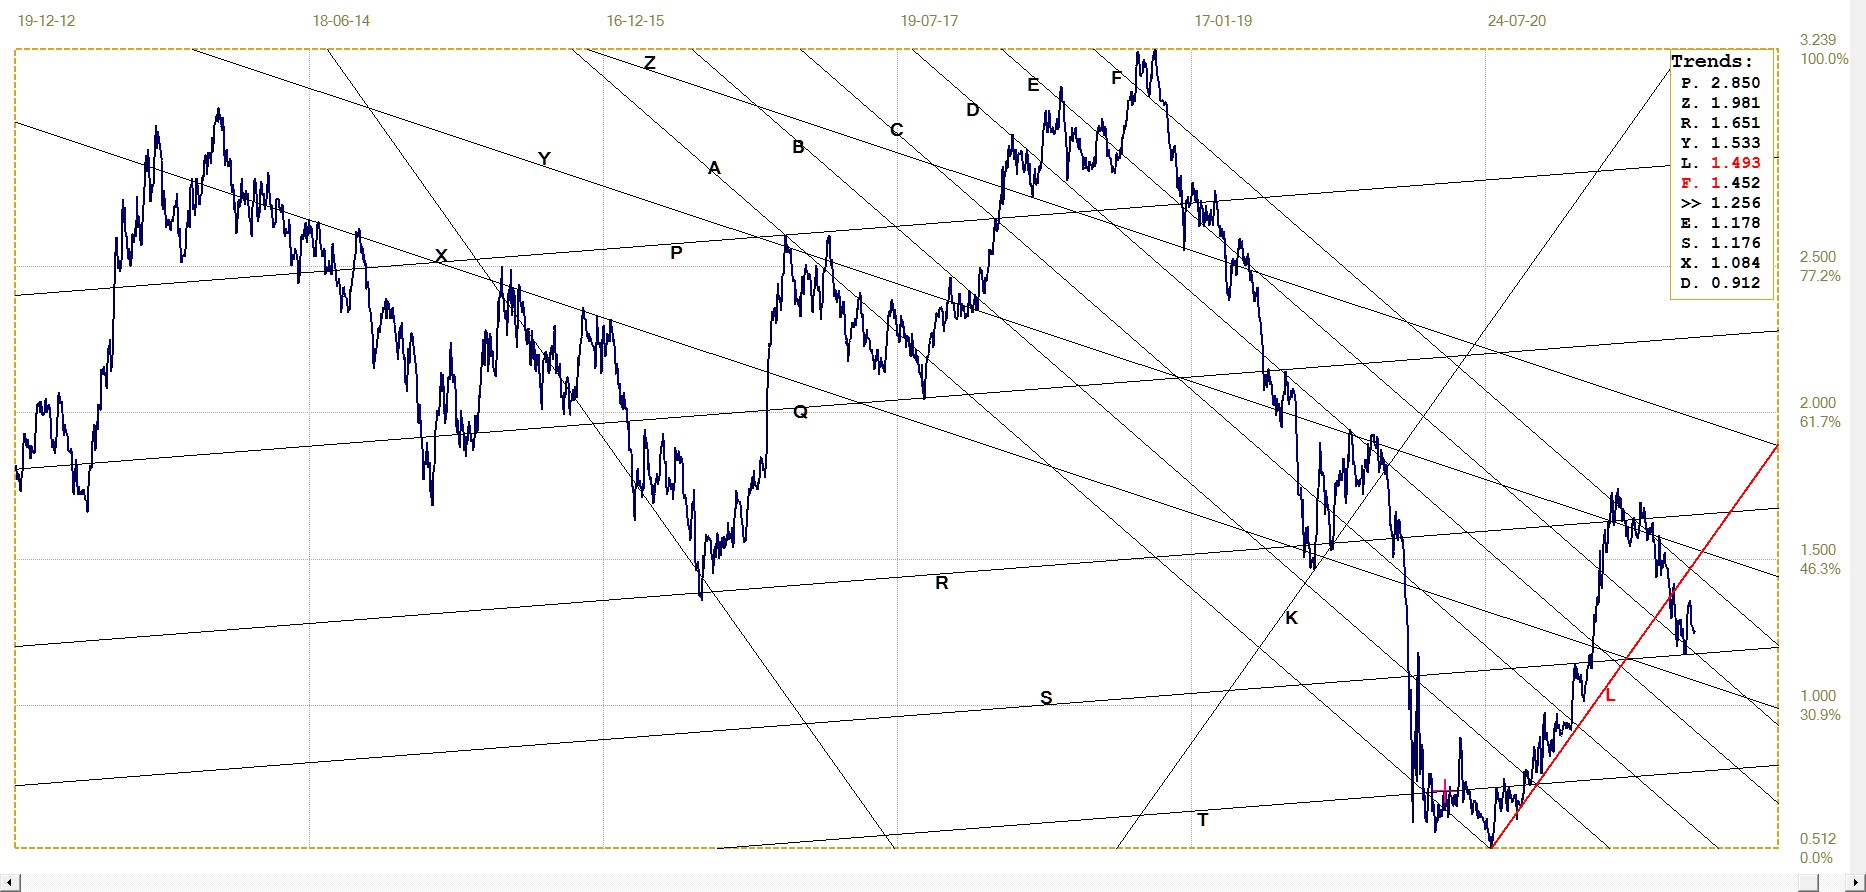
Euro–gold PM fix
Euro gold price – PM fix in Euro. Last = €1523.58 (www.kitco.com)
The reversal off the cross-over of lines X and E to break again above the descending resistance of line G confirmed the two trend lines as indicating important support. It is evident that much of this performance is due to a weaker euro and not to exceptional gains in the dollar gold price. With the euro possibly at a reversal point against the US dollar, as per the earlier chart, any extension of the rebound off lines X and E has to come from a stronger dollar price of gold.
That the second half of the chart is a volatile consolidation within the megaphone PE, can be considered a positive factor anticipating a sustained move higher after the rebound off the bottom boundary of the chart pattern. Megaphones are known for the volatile and steep trends they contain and also strong sustained moves after the price breaks from the chart formation It is a large and extended pattern and we might have to wait 2-3 weeks to see if the anticipated move does develop.
Silver Daily London Fix
Silver daily London fix, last = $23.205 (www.kitco.com)
Silver’s price action last week, holding the break below line S while using line Y as its support, fits the possibility mentioned a week ago, namely that the Cartel is keeping the price of silver as low as possible to entice more specs to switch to short positions.
While the effort to build a short squeeze in silver requires more time and effort to get to where it will influence the silver supply, the risk of something happening that would spike the metal prices higher is something the cartel cannot afford to ignore.
Current volatile circumstances practically compel the Cartel to reduce their net short position to where they can survive and perhaps even profit from a resumption of the long term metal bull market. Based on the CoT numbers of last week, they are still some distance away from feeling safe. It seems possible the attack on the price of silver will persist, perhaps until the support at the bottom of bull channel at line L has been tested and even briefly penetrated, while the price of gold is held steady or also placed under new pressure.
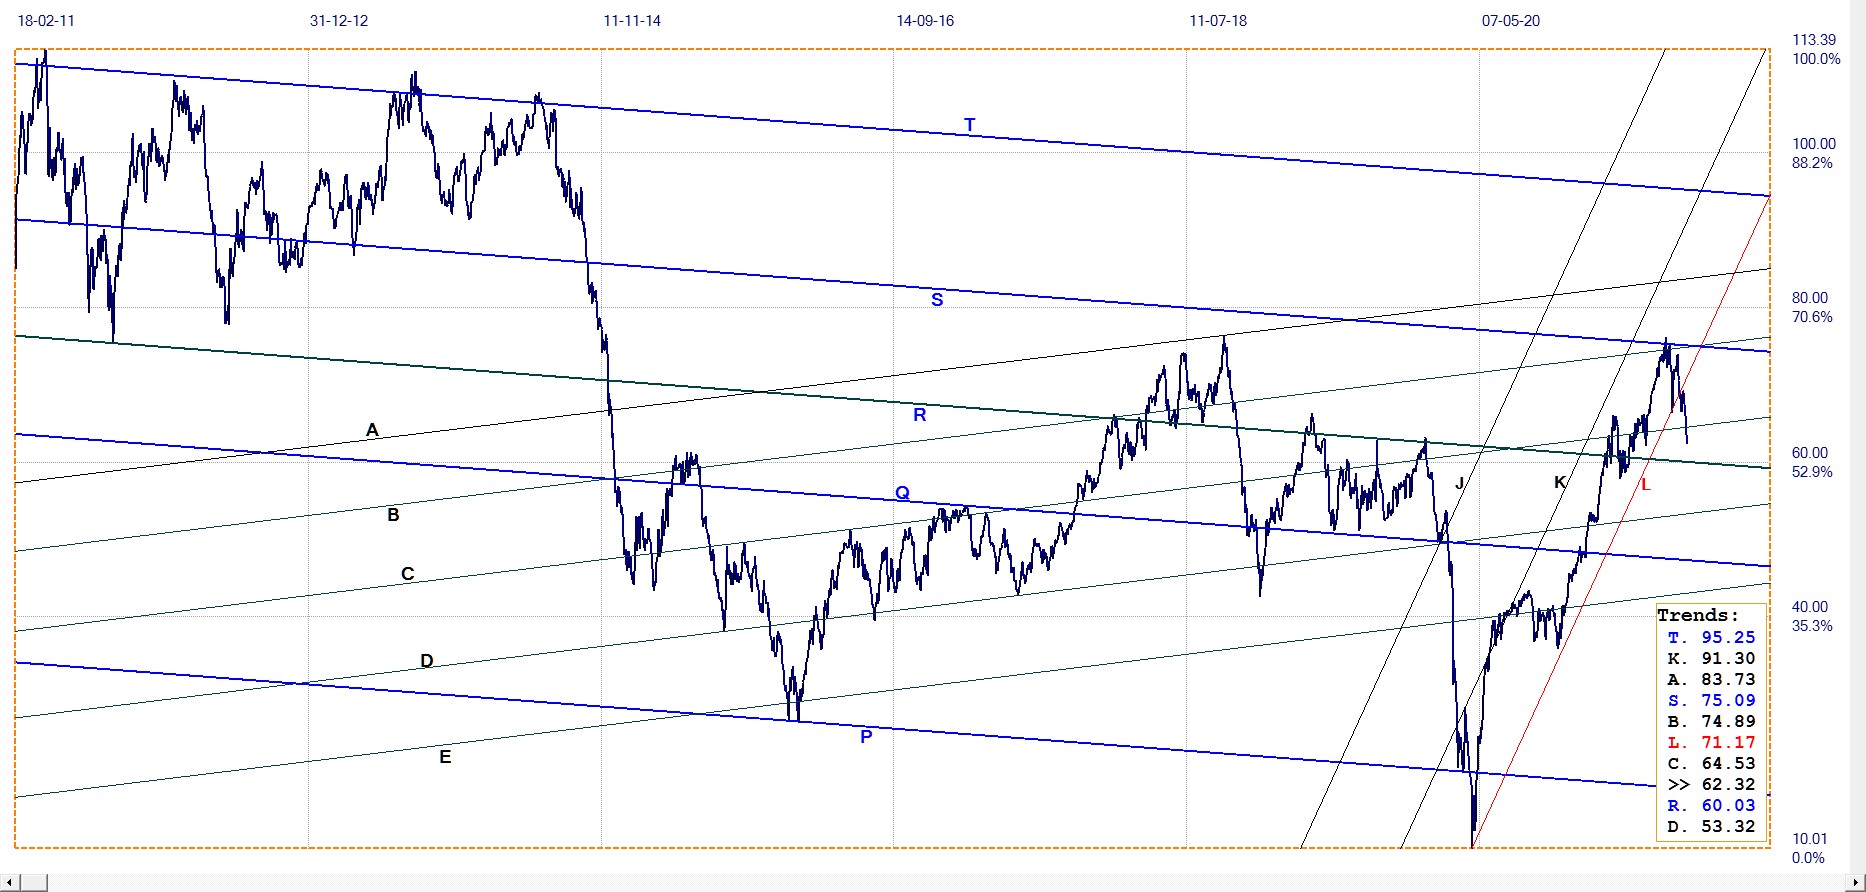
U.S. 10–year Treasury Note
The trend towards lower yields on the 10-year US Treasury note has now ended, with the reversal higher off line S. The rebound in the yield has not yet made it back into bear channel KL and until it does so, the yield is expected to move mostly sideways and perhaps higher, holding above line S and breaking above steep channel AF in due course.
U.S. 10–year Treasury note, last = 1.256% (www.investing.com )
West Texas Intermediate crude. Daily close
The break below bull channel JKL, followed by a goodbye kiss on line L before the price extended the break lower, is a bearish sign with the potential of becoming a lasting sideways to lower trend. Technically, a reversal to recover back into channel KL cannot be excluded – to leave a bifurcated bottom at line L – but then this has to happen quite soon.
The drop in the price despite OPEC’s refusal of Biden’s request to produce more oil is perhaps an indication that despite some positive numbers for the US economy, it is not really firing on all cylinders. The key question to find an answer to is whether the economy is still gaining momentum or whether the initial recovery is proving to be all fake news and official pronouncements and no substance.
********


