We have seen the first cracks! Where do you park your money when bond yields break out of their 32-year downtrend?


Are falling commodity prices warning us of deflation? And is the fall in the gold and silver prices and lumber price a frontrunner for the fall of the SPX?
Lumber has followed in the same footsteps as copper, precious metals, and the other commodities, falling 25% from 405 to 302 since March. Meanwhile, homebuilder stocks have continued upward and finally followed the price direction of lumber. Could this be a good indicator when homebuilders, the housing market, and the equities market as a whole are finally about to roll over or not? See the chart showing the correlation of homebuilders versus lumber prices.

Especially when one analyzes the monthly lumber and SPX chart (see below) the conclusion could be drawn that the lumber price acts as a forerunner for the SPX. If this assumption is right the SPX sell off should continue its downward move, give it a few more weeks considering the efforts of the authorities to keep the biggest bubble in history going. The market will probably move up in the next couple of weeks following an easing of the interest rates as a reaction to the initial “overdone” reaction to the “tapering” remarks. In my point of view the economy is not really improving and therefore it might very well be that Ben will have to swallow his words about tapering. And when it turns out to be the situation that the weak economy doesn’t justify any tapering it could signal the turning point for gold and silver. The weakness of the economy in combination with the continued stimulus could convince investors that they need a safe haven to preserve their capital going forward.
Are home price increases for real?
In April U.S. home prices jumped 12.1% compared with a year ago, the most since April 2006! It turns out to be that a growing number of buyers are bidding on a “tight” supply of homes, driving prices higher and helping the housing market “recover” (see hereafter). The Standard & Poor's/Case-Shiller home price index also showed that all 20 cities measured by the report posted annual gains for the fourth straight month. Therefore in this context it is the more remarkable that since mid March of this year the Lumber index/price fell by 25% from 405 to 302. How is that possible if there is such a strong housing demand with associated strong prices?
House prices are rising whilst incomes, purchasing power and lending are not keeping up
Housing prices have risen at 12.1% the fastest rate in seven years, as the Case-Schiller Index of national housing prices showed. Though whilst house prices are rising, incomes, purchasing power and lending are not keeping up. In other words prices are “formed” due to special circumstances. House flipping in California has reached levels not seen since 2005, according to the Wall Street Journal. Year on year price rises reach 15%. In California, the number of homes sold in recent months that had been flipped—described as bought and resold within six months—has reached the highest levels since late 2005, according to Property Radar. About 6,000 homes have been flipped in the state this year through April, or more than 5% of all homes sold in California. House flipping in my point of view is an indication that prices are rising too fast over a certain period due to extraordinary factors. Housing prices, like prices for all products, depend on supply and demand. When supply decreases - when there are fewer homes on the market - then prices will rise. This is what is happening now. There is evidence that banks are controlling/restricting the housing supply, and thus prices, by reducing the number of houses for sale. Last year, AOL Real Estate's reporting suggested that as many as 90% of available properties were not even really on the market, but just polished for sale and being held back to keep supply low.
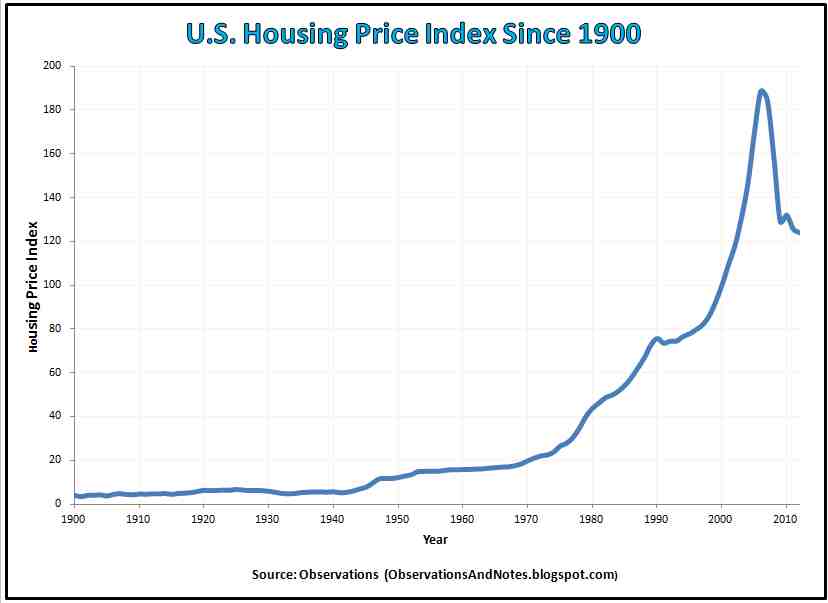
Fitch, the ratings firm, recently issued a warning that the alleged recovery in housing is moving too fast and could reverse. Since when are housing prices acting like they are shares? Is there something wrong here? The average annual home price increase for the U.S. during the whole 1900 - 2012 period was only 3.1% a year, just a shade better than the inflation rate of 3.0% annually, and definitely not 12%+.
100-Year Housing Price Index Graph
|
|
|
U.S. Housing Price Index (1900 - 2012) |
The banks and private equity groups and hedge funds “create” illusory strong home prices!
Blackstone is one of America largest house owners, buying large repossessed portfolios from the banks to upgrade the properties and rent them out. Subsequently companies like Blackstone are looking to securitize the rent flows and flip the properties (MBS all over again, securitize the CF stream consisting of different risk profile debtors and reap the “rewards”). It is estimated that these private equity groups and hedge funds account for some 25% of all existing house purchases. Last month, three major banks, including Citigroup and Wells Fargo, halted all their sales of homes in foreclosure; this reduced the supply of homes on the market. Next to that the banks are not lending conveniently helping a “recovery” in the already “tight” housing market! The reduction in housing supply thus is largely artificial, designed by the banks and institutions that hold thousands of houses looking to capitalize on the current price rises. Next to that the higher prices “serve” the purpose of the Fed building consumer confidence which for about two thirds is determined by home prices. The question is for how long.
The real estate devaluation in Japan since 1989, causing deflation because its importance in the economy, is showing us what is to come to the Western economies. Real estate is the crucial asset the economy evolves around. It is the most important asset of the lower and middle classes and thus crucial to consumer confidence.
Anyway lets just look at Japan and what the effect of the incredible hype in the real estate market was on the economy since the peak in the Nikkei in 1989 (24 years ago). The Tokyo Imperial Palace, which total surface area including the gardens is 3.41 square kilometer (1.32 square mi), was, during the height of the 1980s Japanese property bubble, valued by some at more than the value of all the real estate in the state of California! There you have your deflation when prices need to get back to the median!! The higher real estate prices go and the more ludicrous the valuations the longer it takes for the bubbles to deflate. And as we know in general markets always overshoot.
The Japanese real estate market is a clear example of what happens when artificial markets (the Japanese could only invest in the Japanese market and not abroad) are not allowed to correct regularly or naturally and create bubbles and subsequently deflation as we have been witnessing in Japan since. Depending on the nature of the underlying assets, real estate has different characteristics than bonds, and the level of excess, the deflating process takes more or less time.
The Yen/Dollar/Gold correlation determines the direction of the gold price
In my point of view in this context, discussing the Japanese market, it is the more interesting that the gold price and the Yen have been falling in tandem. The reason I am saying that is because the gold/US dollar standoff is ultimately one of the factors at the basis of the tensions in the system in my point of view. Hence why the strong correlation between the yen's decline and the correlated collapse in gold is so interesting (as previously discussed in my last blog), see below the gold and Yen chart and the parallels.
The main currency blocs that anywhere come close in importance to the US dollar are the Euro and the Japanese Yen and of course gold! The Euro already has its monetary easing so what currency was left for easing and thus a stronger dollar: the Yen. A stronger dollar logically means that people are willing to pay fewer of those dollars for gold, so gold prices drop. This Yen/Dollar/Gold relationship is extremely important for the direction of the gold price as illustrated by the chart here above. In other words the strength and weakness of the Yen could be one of the factors that could signal what could happen to gold!
In 1987 U.S. pressure on Germany to change its monetary policy was one of the factors that unnerved investors in the run-up to the crash of 1987!! I believe there is an analogy with the US putting pressure on Japan to adhere to aggressive easing forcing the gold price down!
So in which currency should investors put their money when all the currencies except gold are being diluted by trillions of dollars, by trillion of euros and quadrillion of yen without any economic growth to account for? The answer is: gold!
What are these historic low interest rates, in a downtrend since 1981 in an ever-connected world, telling us?
Interest is a fee paid by a borrower of assets to the owner as a form of compensation for the use of the assets. Interest is compensation to the lender, for a) risk of principal loss, called credit risk; and b) forgoing other investments that could have been made with the loaned asset. These forgone investments are known as the opportunity cost (Wikipedia). The virtually zero interest rates are basically saying that there is no risk and that there are no competitive investments. Well nothing is less true as we have witnessed the risk increasing violently in the last three weeks. Every day that the enormous QE measures are not delivering the desired and much needed growth the risks of failure are increasing exponentially (QE è Historic low Interest Rates è No Earnings From Bonds èNo Confidence è No Lending è No Velocity Of Money è No GDP Growth è No Improvement In Unemployment è Even Less Confidence è Deflation è Debt Implosion). Looking at the velocity of money chart of the Fed of St Louis you tell me if the QE is working!
© Gijsbert Groenewegen
g.groenewegen@goldarrowpartners
As I have stated several times in previous blogs I can’t emphasize enough that we are witnessing a clear transformation from intangible or paper assets (inflation) to tangible or real assets (deflation) and in conjunction with that a correlated switch from yield, income to preservation of capital! The saying “I am not interested in a return on my money but in the return of my money” is gaining more and more ground. The reason we have been able to kick the can down the road for so long has been the fact that the enormous amounts of funds have been able to continuously chase asset classes for yield around the world, hopping from asset class to asset class to get a return till it gets to the point that “no asset classes are left to invest in”. There is no yield left and if there is yield than the capital values are likely to incur more capital losses. A few weeks ago the junk bonds were trading at historically low 5% and are now trading in the 7% region, imagine the capital losses. The question subsequently begs where do you park your money in order to preserve your capital? Where will the funds go in order to lose as little as possible capital value? Forget yield!
Is the performance of the emerging markets, with their increasing unrest, a precursor of what is happening in the other markets?
According to the following chart first emerging markets (represented by red bar chart) and precious metals (black line) took a hit followed recently by currencies, corporate bonds (JNK), municipal bonds and government bonds. Stock markets always tend to come in last!! Surely their valuation is next to the companies’ valuations a derivative of the underlying interest rates and currencies.
I wonder if it is a coincidence that we see increasing citizen unrest in the emerging countries such as Brazil, Turkey, and Russia (China can’t be far off). Is this unrest, with people having enough of corruption, abuse of power and the discrepancy between poor and rich, what is waiting in store for the rest of the world? Is everything in terms of exhaustion of the markets and tolerance converging? Brazil’s Bovespa’s index is down 22% so far this year, the Shanghai index is down 13% and Turkey share index is down 18% since its peak last month due to unrest. According to EPFR some $22bn came out of emerging market funds in the last weeks ending last Wednesday leaving $1trn in emerging market stock funds. In the past month also $10bn was withdrawn from municipal bond funds according to Lipper.
How risk-free are US treasuries? What are more realistic rates?
Considering the fact that the treasury yields have been in a downtrend since 1981 and are at historic lows or close to it (normally an indication of near perfect credit conditions!?) one has to wonder how risk-free they really are especially in context of the overwhelming debts in many countries and the out of control budget deficits! Especially in light of the fact that the whole world owns treasuries and because a break out of the 32-year downtrend, breaching the 3% level, which will cause an exodus, is just a matter of time. We saw what a panic was caused by interest rates climbing to 2.67%! Public and private investors abroad sold a net $54bn in US government bonds and notes in April, the highest since 1978, according to the Treasury. Since 1995, the rate of growth of U.S. nominal GDP has averaged almost exactly the nominal interest rate on 10-year Treasuries. As a yardstick the 10-year Treasury note yield is normally 1.5%-2% higher than the inflation rate. So you determine were normalized interest rate should be! Real GDP growth in the first quarter in the US was 1.8% whilst inflation was 1.1%. Consumer prices climbed 1.1 percent in the 12 months through April. In other words 10-year treasuries should yield approximately 2.9%.
Many people have compared the QE in the US to a huge Ponzi scheme, in other words not sustainable!
The CIO of Guggenheim Partners wrote that the Federal Reserve’s bond-purchase program, known as quantitative easing, has introduced false confidence into the market because investors believe treasury investments will continue to increase in price, though this believe might have been shaken recently. Better described in my point of view is that investors believe that they will get their money back! Ask the Madoff victims! People don’t believe that countries can go bankrupt because they have never experienced it and because of the misperception that Big Brother can’t fail. Just like a Ponzi scheme, the value of treasury assets has become disconnected from its underlying value and the issued treasuries can only be returned when new debt is issued. Though the previously issued debt is becoming worth less and less every time new debt is issued because we are facing unmanageable debt levels and the printed money is not “backed” by real economic growth, there is no velocity there is no trust. You can’t pay existing debt with newly issued debt! You can repay debt with income but not with debt, debt is only buying you time in anticipation of expected better times.
What is a Ponzi scheme?
A Ponzi scheme is described by Wikipedia as a fraudulent investment operation that pays returns to its investors from their own money or the money paid by subsequent investors, rather than from profit earned by the individual or organization running the operation. The Ponzi scheme usually entices new investors by offering higher returns (safety net of the Fed) than other investments, in the form of short-term returns that are either abnormally high or unusually consistent. Perpetuation of the high returns requires an ever-increasing flow of money from new investors to keep the scheme going. The Fed buys approximately 70% of all treasury auctions!!! Wake up!! In other words investors keep still on buying treasuries because investors believe in ever-lower yields and thus higher prices or because of lack of better alternatives or because they want the security of having a “risk-free” asset (about this more later).
Another way in determining the “real” 10-year yield
Though one indication of the distortion between make believe reality and actual reality is a comparison between the real, or inflation-adjusted, 10-year Treasury note yield and the University of Michigan’s consumer confidence index. “The two have historically moved in tandem, but that relationship broke down at the end of 2011, see chart. On the basis of this correlation the yield on 10-year treasuries should be roughly 150 basis points higher than it is today if the market was not being distorted by Ponzi (uneconomic) buying,” Minerd wrote. The 10-year note yielded as high as 2.67% last week. In other words according to this comparison the 10-year treasuries should trade at 4.17%.
The more QE is injected the more volatility is induced in the different asset classes, besides the money has to go somewhere!
The believe in better returns is becoming unstuck, as we just witnessed in the last couple of weeks with significant bond net outflows. Bernanke remarks on May 22 priced in earlier tightening than previously assumed and caused the bond markets to take a hit. We do not know when the Fed will taper QE, but the longer its expansionary policy continues, the more volatility-inducing pressure will build in currencies and bonds. The Fed and the markets are between a rock and a hard place.
Currency volatility is the most devastating of all volatilities because it affects the capital base of every asset values versus the much smaller bottom line (profit contribution)
Two weeks ago we had the largest spike in currency volatility in percentage terms (May-June 2013 +61%) since Lehman. Deutsche Banks VCix index, the currency market equivalent of the Vix, rose last week to levels last seen in mid 2012, which was the low point in the Eurozone crisis.
QE effect on global currencies
· Mexico Peso: had a 9% move in 30 days
· US Dollar: Off 4.2% from the Bernanke taper moment on May 22
· Australian dollar: Off 9.4% since mid April
· Dollar/Yen: Off 9% since May 23rd
Source: Larry McDonald, Newedge
According to Larry McDonald of the Newedge group the last time we had this type of really sharp currency and bond price volatility was right before the debacle of Long Term Capital Management. The volatility for the Nikkei hit levels not seen since the aftermath of Lehman’s. Higher volatility, representing instability and unpredictability, can prove very unsettling especially when it directly concerns currencies because all asset classes are denominated in a currency and thus affects the total value of the asset, the capital value which is expressed in a certain currency and swings with the currency moves! Of course the bottom line has much less impact on the total currency translation.
I can’t emphasize enough that the currency moves have the greatest impact on the underlying asset values versus the impact on the bottom lines. In other words if you have $10m in bonds yielding 2.2% or $220,000 an 2% adverse currency move on the capital sum (2% of $10m = $200,000) wipes out almost all interest income whilst the impact on the interest income is only $4,400 (2% of $220,000). See the difference, that is why currency moves, which are often closely linked to interest movements, are so devastating and unsettling. There are ample examples like loss of the Dutch and English investors in savings accounts of Icelandic banks or Hungarians getting low interest mortgages from Austrian banks.
Anyway don’t forget that the banks around the world are long a lot of sovereign bonds and thus currency risks hence the danger. Considering the currency volatility it cannot be ignored that stock and bond markets could be in for a rough ride over the next six months or so.
On May 28 the 10-y treasury yield matched the S&P 500 dividend yield
Another important development happened on May 28 when the 10-year treasury yield matched the S&P 500 dividend yield, rendering null and void the call for the early mentioned possible “Great Rotation”.
The surge in the 10-y treasury yield on Tuesday May 28, to 2.17%, put the yield on par with the S&P 500 dividend yield. The crossover was just a matter of time considering the bond selloff and rising stock prices lowering the dividend yield. Especially in the context of the “hunt for yield” the lowering of the stock market’s yield advantage has been closely watched in the context of asset allocation.
The question is whether the erosion of the dividend yield premium will halt the stock rally and draw investors back into treasuries. Historically the S&P 500 dividend yield has averaged just 42% of the 10-year Treasury yield. That would put the 10-year Treasury note yield, assuming a dividend yield of 2.17%, at around 2.17%/0.42 = 5.17%. Again ask yourself should equities come down or interest rates go up or both?
Comparisons with the bond massacre in 1994
Last but not least people tend to compare this situation with the bond massacre in 1994. The Federal Reserve increased its benchmark rate 3 percentage points from February 1994 to February 1995, from a then record-low 3% to 6%. The yield on the 30-year U.S. Treasury bond surged above 8% in late 1994 from below 6% 12 months earlier. The rate increase and corresponding collapse in bond prices and stock markets caused losses for Wall Street trading desks and investors.
What people forget to mention though is that worldwide sovereign debt levels nowadays are substantially higher and that we didn’t have the same vulnerability in the housing markets. Next to that we are dealing with seriously inflated and subsidized asset prices due to massive QE measures next to that the world is far more interconnected. In other words the impact and ripple effect is likely to be much more serious.
How risk-free are the treasuries after the interest rates break out?
See in the chart below how since August 2011 the S&P 500 and the 10-y treasury yield have gone inverse to each other. Again so either interest rates have to rise significantly or the S&P500 has to come down or interest rates will rise and the S&P500 will come down which in my point of view is the most likely result. The question then is where is the equilibrium! On the basis of the chart it looks like 2.67% for the 10-y treasury yield will be a crucial medium term resistance level for a breakout.
In order to look at the long term chart since 1981 let’s have a look where the main resistance is there. On the basis of the chart provided by the St Louis Fed the breaking point is most likely around 3% before it breaks out of the long-term trend. This would mean a serious earthquake like reversal of valuations for bonds, equities and precious metals. So the question you have to ask yourself is how risk-free are bonds at this moment in time considering the overwhelming debts everywhere and the fact that every investor has bonds in its portfolio. It is like the Apple situation, every investor had Apple shares and we all know what happened after the share price hit $705.
Next to that it should also be emphasized that much higher interest rates won’t miss their impact on the budget deficits of many countries and their economies triggering further downgrades of their ratings. As a result we will see duration risk, the risk of falling bond values due to interest rate increases, shifting towards credit risk, the risk of bond defaults. This is not unthinkable considering the historically high debt levels we are witnessing worldwide that can barely financed grace to historically low interest rates.
"Cheap money makes it easier to borrow than to save, easier to spend than to tax, easier to remain the same than to change," (BIS). Precursor for disaster!
Bondholders in the United States alone would lose more than $1 trillion if yields leap, showing how urgent it is for governments to put their finances in order, the Bank for International Settlements said. The BIS, the central banks of central banks, was one of the few organizations to foresee the global financial crisis that erupted in 2008.
According to the BIS a rise in bond yields of 3 percentage points across the maturity spectrum would inflict losses on U.S. bond investors - excluding the Federal Reserve - of more than $1 trillion, or 8% of U.S. gross domestic product. The potential loss of value in government debt as a share of GDP is at a record high for most advanced economies, ranging from about 15% to 35% in France, Italy, Japan and Britain. Imagine what the snowball effect will be on budget deficits and thus ratings subsequently resulting in again higher interest rates. A downward spiral will engulf.
"As foreign and domestic banks would be among those experiencing the losses, interest rate increases pose risks to the stability of the financial system if not executed with great care," the BIS said. Underlining the BIS's warning, U.S. bond prices slumped after Fed Chairman Ben Bernanke said on Wednesday June 19 that the U.S. central bank can be expected to reduce its pace of bond buying, now $85 billion a month, and cease purchases completely by mid-2014 if the economy continues to improve and unemployment falls below 7%.
The BIS said countries must redouble their efforts to make their debt manageable because growth, if there is such a thing as growth, alone will not do the job." Over-indebtedness is one of the major barriers on the path to growth after a financial crisis. Borrowing more year after year is not the cure," the report said. As I have stated many times we have passed the tipping point, we live in complacent and corrupt societies, we are at the end of a cycle, and everybody is out for them selves and nobody takes responsibility for their actions or is being held responsible! And governments have balked at labor and product market reforms, despite overwhelming evidence that making it cheaper to lay off workers and reducing the barriers to competition in sectors such as retailing would deliver a big boost to growth. Debt levels all over the world (China (200%), Japan (245%), Euro-zone (90%), the US (103%) have become too big too manage and are clearly having strong adverse effects on economic growth and employment.
Not only has the debt of households, firms and governments increased as a share of GDP in most countries since 2007, but debt-service ratios are now higher in most rich countries than the 1995-2007 average—despite low interest rates. The country with the highest debt ratio is Sweden. Imagine what will happen when interest rates really start to rise! The fiscal adjustments required in rich countries are especially sizeable when projected increases in age-related spending for the baby-boomers are taken into account. In fact, expenditures related to the greying of our societies are so large that governments are watering down pension entitlements.
Anyway the conclusion is that bonds are in for a rough ride, something we might not have witnessed ever before!
Gold qualified as a risk-free asset by the BIS! Gold is the only triple A $ in the world!
In this context of the BIS warnings it is noteworthy that recently gold has recently been qualified as a risk free asset by the BIS, the central bank of central banks. This is no coincidence in the light of the central banks having become the largest buyers of gold and this is excluding the gold China most likely has amassed, but not officially registered since 2009. According to the Basel Committee’s new rule, known as “Basel III,” as of 2013, physical (not paper) gold will be counted at 100% of its market value when a bank’s assets are audited instead of 50%. Gold has intrinsic value, value by itself and not because the words “Hundred Dollars” are printed on it by the Treasury. It proves my point that the risk free status is shifting from paper money to real money. Gold is the only triple A $ in the world! Treasuries are no longer risk free in my point of view as confirmed by their downgrade from AAA to AA and the interest rates getting close to a break out of their 32 year downtrend which is just a matter of time. The question is where do your invest your money when most asset classes are getting exhausted. See the reverse pyramid chart.
In a sell-off investors will first buy US $ denominated assets for liquidity reasons followed by investments in gold and silver
A last point I would like to raise in this context is that when the markets sell off investors tend to park their money in US dollars, hence why gold and silver go down next to technical selling, because it is a $10trn market where investors can easily park large sums of money, next to that it still is the reserve currency. Gold incurred a loss of more than 23% for the second quarter of 2013, closing at $1,193/oz, the steepest quarterly decline since the start of Comex gold trading in 1975. Silver closed at $19.47 an ounce, and fell by around 31% on the quarter. Though with all the political and economic turmoil in the US and in countries around the world one has to wonder for how much longer gold can keep on falling! I believe that ultimately in the ongoing tug of war between the reserve currency ($) and the ultimate currency (gold), gold and silver will ultimately win. As we know paper can be printed ad infinitum gold can’t and installs discipline that we are in dire need of. And the US is definitely not in a better place than the other countries. And don’t forget everything is interconnected. Ask the NSA!!
In this context of economic, political and social problems (Brazil, Egypt, Syria, China, it might also be no coincidence that the precious metals have gone down since mid 2011 before all other asset classes have gone down and therefore, in combination with their specific characteristics (intrinsic value and no manipulation), represent the best of all bad options to park investor’s money going forward. As I said before “C’est reculer pour mieux sauter”, you have to step back to jump higher.
If the Fed has to reaccelerate its QE program gold and silver could be the main beneficiaries
Another possibility that could reverse the slump, the precious metals have been in since mid 2011, is if the Fed has to reverse it taper stance and needs to reaccelerate the stimulus programs because a weakening economy or deflationary pressures. A weak economy is contrary to what hedge fund manager David Tepper believes, he told CNBC Friday, “any Federal Reserve money-tightening will come due to a stronger economy and shouldn't scare investors”. Anyway despite his incredible success in investing I believe this time he is wrong a stronger economy is wishful thinking. In this case, when the Fed needs to reaccelerate again, we could possibly see the precious metals finally take off to new all time highs in the search for one of the few safe havens left to preserve capital.
According to CNBC and a lot of other commentaries gold and silver are dead!!! That is the best buy argument you can have for buying the precious metals. Mind my words within 2 years gold will have touched $3,000/oz and silver $150/oz
On the charts it looks like gold could correct to $1,100 or $800 whilst silver is showing a downside on the charts to $14-$15. The question then begs how long it will take the precious metals to bounce back to former highs. Again it will not be a timing issue but an event driven issue confirmed by the matrix shown below.
What happened in the gold and silver markets is nothing unusual, look at the performance of the gold stocks after their previous declines
The recent gold stock bear market has had the fifth largest decline in history (data starts December 1938). It is also the third longest in history. Let’s look at what has happened after 60% gold stock bear markets. According to an article of James Debevec of Minyanville of July 1 every single time gold stocks went down 61% to 73%, they went up least 164%. See below.
On the basis of these facts the next move in gold stocks should mount to at least 429%! Although the majors such as Barrick, Newmont and Kinross all have encountered their own specific problems investors will go for liquidity “n’importe quai”. Exploration plays that follow the normal life of mine cycle and thus will be in need of approximately 7 years of financing from inception to production could be avoided when interest rates start to rip up due to credit constraints. Though I wouldn’t be surprised if the medium low cost producers with ample room for capacity expansion and geographically well spread operations would be the biggest winners in the next run up.


