Weekly Market Update Excerpt


US Dollar Chart
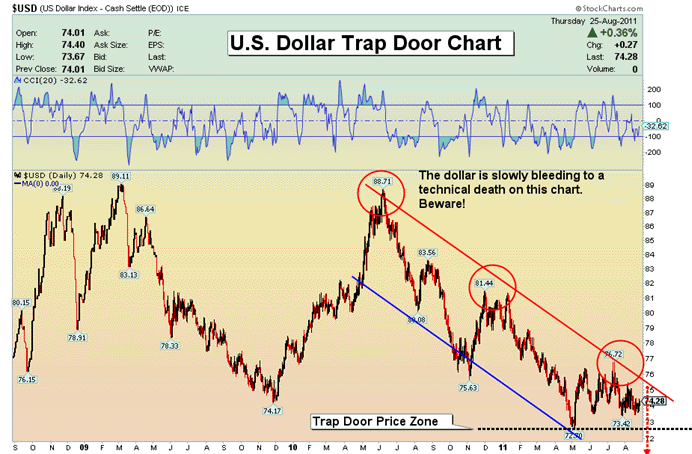
Dollar Commentary
- I am projecting that the USD falls to the 65 area on the above chart, likely in the Sept-Nov timeframe. Gold has started a huge devaluation of the dollar. The reason gold has been hitting highs is because of a serious loss of confidence in the world's fiat currency system, one that is gaining momentum by the day.
- I see no reason to alter my target of 65. Recent economic data has caused one economist after another to steadily trim their growth estimates. The odds of a double-dip recession, or worse, are rising.
- Debt remains front and center, and committees of congress will try to work out an agreement. The problem is congress knows they need to diet, and they promise to cut back on their calorie intake after every "next election". The situation is very serious, and a lack of credibility on this matter could create a confidence disaster. Gold's skyrocketing price is offering politicians a warning that their actions are failing badly.
Bank of America Death Chart
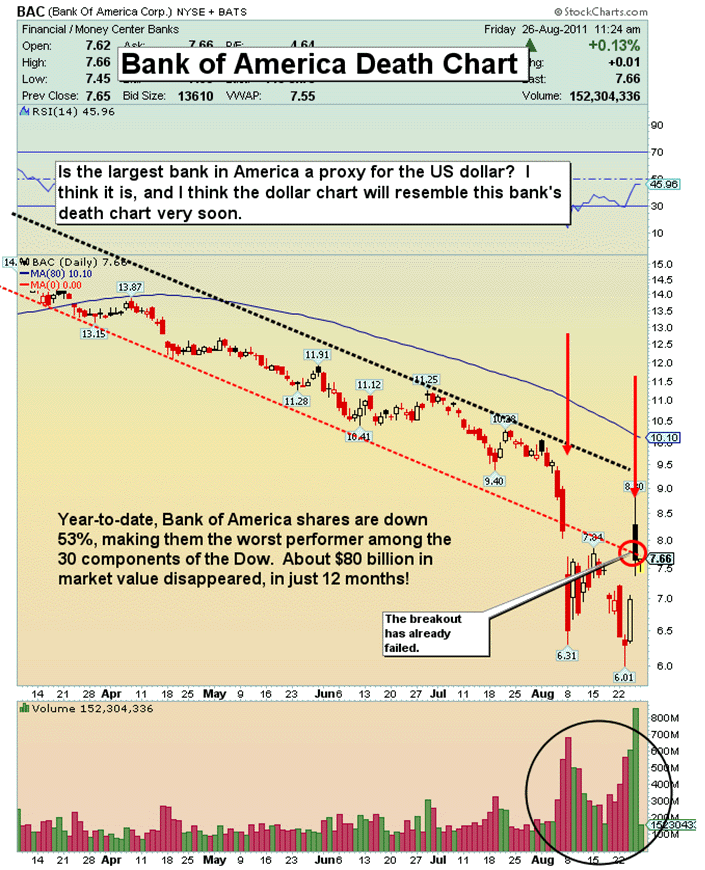
- One of the most important lead indicators for the dollar and the economy is the bank stocks. Bank of America is the largest bank in the United States. This chart looks like the company is going to be delisted. It is an ominous sign for the banking industry, and the dollar.
- Some investors bought Bank of America on the news that Warren Buffett bought the stock. You need to ask yourself what kind of deal he may have really gotten, versus the deal you might be getting, if you buy the stock in the open market.
- Also, the "breakout" exhibited by the stock on the supposedly great news that Bank of America is in a desperate situation… is already a technical failure! I expect the dollar chart to mimic what you are seeing now on the price charts of the nation's largest financial institutions.
Gold Super Highway Chart
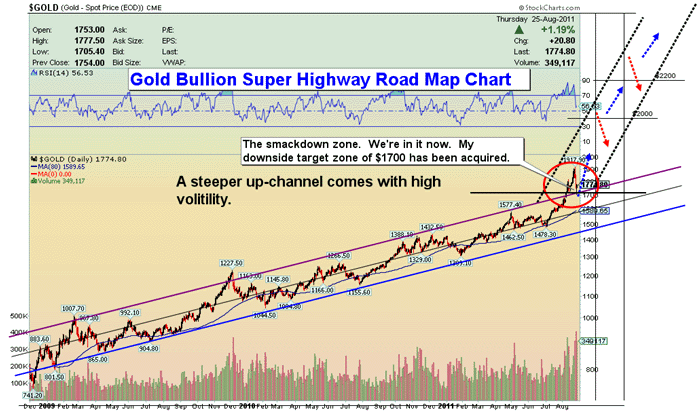
Gold Analysis
- Supply and demand are like truth detectors. Fresh gold supplies are mined and brought to market, but the rate it occurs at is physically limited. Compare the growth in the ability of miners to supply gold to the refiners with the ability of a central bank to print paper currency and decide which item holds the real value for you.
- The public is really just barely aware of the fact that fiat currencies are on fire. There are few places for people to run to outside of the fiat currency system. Gold offers liquidity and is fairly portable. What is most important right now is that gold has burst through the upper window of the previous uptrend. It has entered what appears to be, technically, a parabolic superhighway.
- The gold overshoot of the up channel has been truly spectacular. It took place around Aug 8th, and I then projected that gold would enter into what I termed, "the smack down zone".
Gold Smack Down Chart
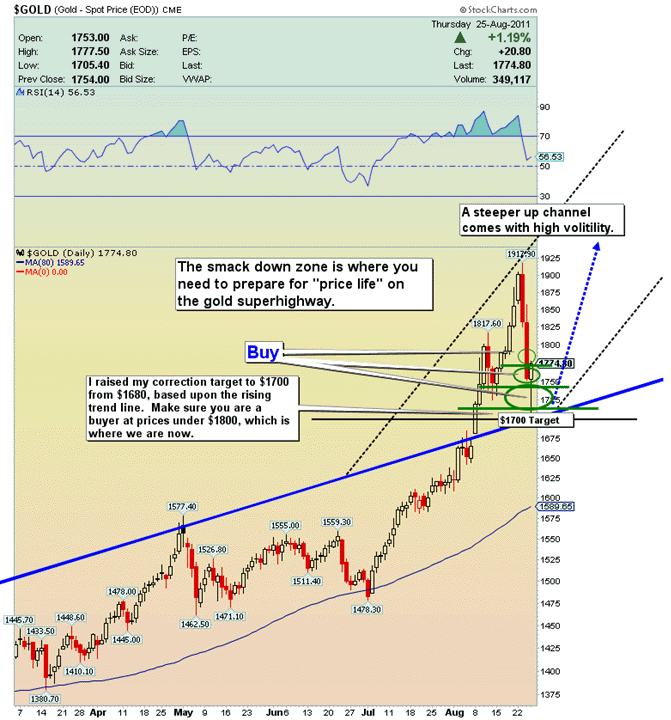
- This chart is a magnified view of the price action I projected would occur at the entrance to the superhighway price channel. This price correction could be your last opportunity to buy before gold goes to much higher prices, and does so at a much faster rate of rise.
- I continue to look at the top of the previous upper channel, which is approximately $1700, for the end of correction target zone. This hard two-day correction feels like a clean-out type of move; a sort of vicious good-bye to gold's price chasers. I have urged my people to add to gold positions this week, because the smack down zone is also likely your "last chance to buy zone"!
GDX Head and Shoulders Chart
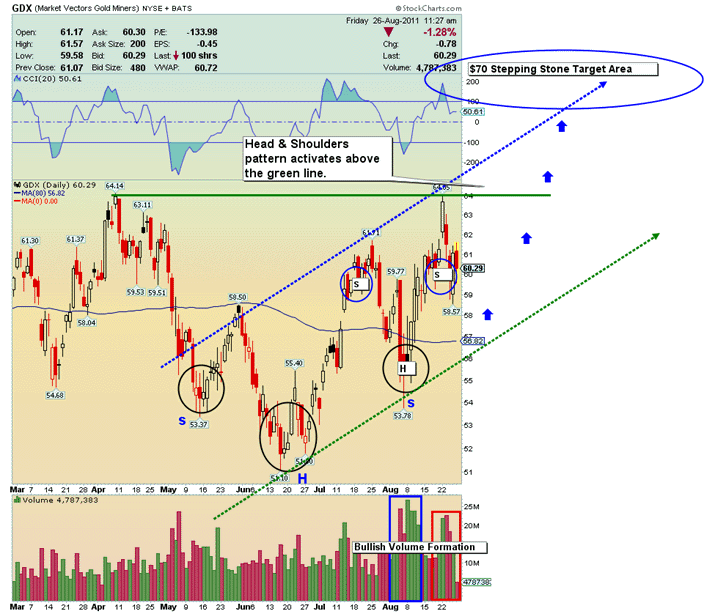
- Gold stocks are setting up for a major move! One of the most bullish technical patterns in technical analysis is the inverse head and shoulders pattern. That is the pattern you are looking at on this GDX chart. A secondary H&S pattern has also formed in the last three weeks, giving this technical situation even more firepower!
- Gold stocks have started moving with powerful volume. The H&S patterns project GDX will rise to $70, and I believe that number is simply a stepping stone target. Take a hard look at the next chart, and you will see why I believe a rise to GDX $70 is only the beginning of an immense move in gold stocks.
Gold Stocks To Gold Bullion Ratio Chart
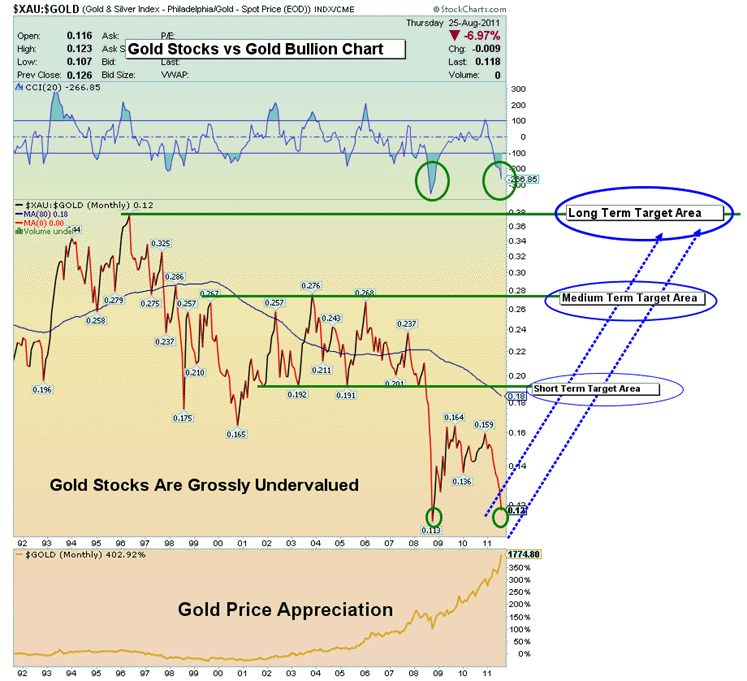
- Gold has continues to be a stellar performer in this debt crisis. Venezuela appears to be intent on nationalizing their mines, which may take future gold out of an already tight international market. The country is also moving hundreds of tons of gold out of Europe, which seems to have put additional pressure on the physical gold market.
- It is wise to prepare for a day when a shortage of gold becomes a real issue for investors. I'm referring to physical gold. Gold stocks have severely disappointed investors for many years now, in this bull market. That is about to change.
- My technical chart work continues to indicate that the smack down zone is your last buying opportunity, before an enormous move higher occurs in bullion, and gold stocks! The head & shoulders pattern on gold stocks is a powerful price activation mechanism. You are very likely to see gold stocks move well above $70, basis GDX, and stay there for years to come.
GDX vs S&P500 Chart
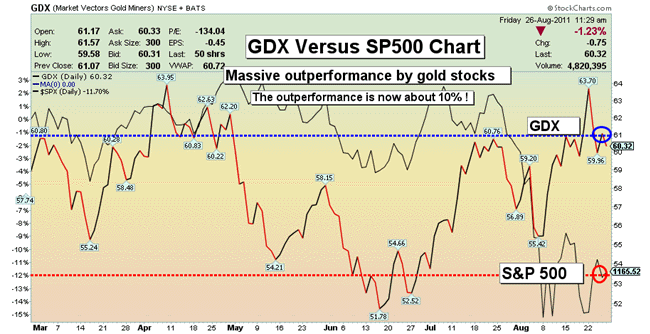
- I brought this situation to your attention several weeks ago when GDX was starting to outperform the S&P. I want to give you an update today. GDX is almost blowing the doors off the general stock market now, in terms of relative performance!
- My internal indicators point to a continuing and even expanding superior performance for gold stocks against the stock market! Gold stocks are drastically undervalued and are poised to begin an almost immediate and enormous catch up phase, relative to gold bullion. On the superhighway, I fully expect the gold stock "racecars" to actually pass gold bullion in terms of absolute performance.
GDXJ Action Chart
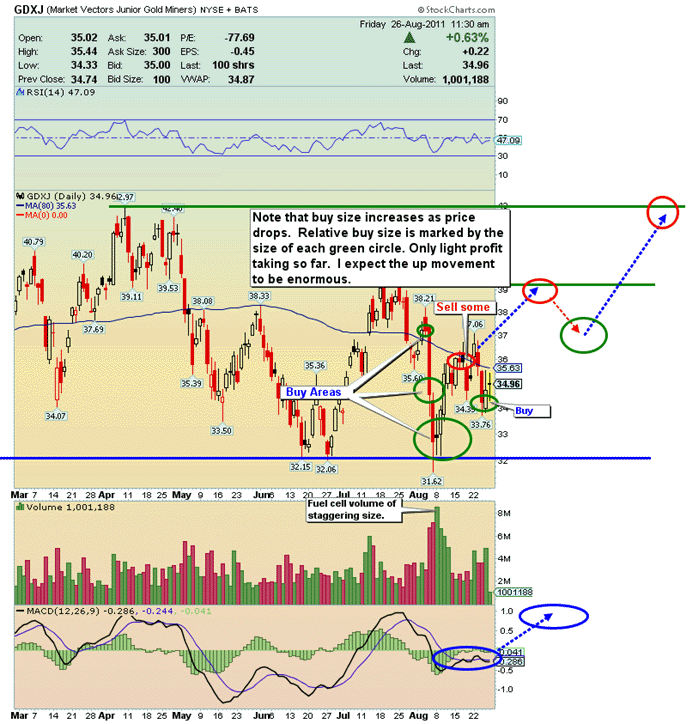
- This chart is a snapshot of the power of fuel cell volume. My technical volume analysis indicates the picture for gold junior stocks is stunningly bullish. Note that the fuel cell volume day has been followed by soft volume pullbacks. This is picture-perfect chart action for the bulls!
Silver Chart
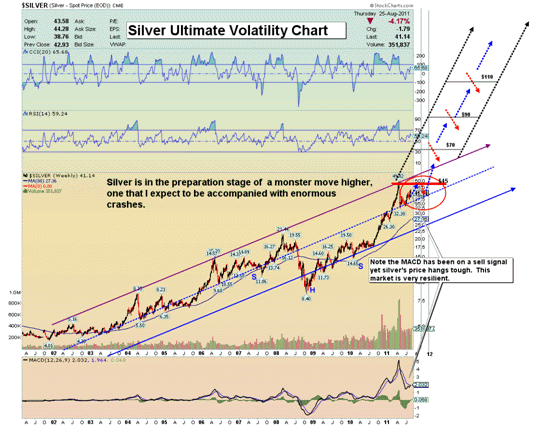
- Silver offers an absolutely enormous opportunity, and price has held in very strong, in the face of a powerful MACD sell signal. In coming years, I'm looking for massive gains. Your strategy should be to buy the physical metal on significant price weakness.
- I issued a new buy signal on silver into the carnage that occurred on Wednesday. Physical silver is my second largest holding, second only to gold. I strongly advocate you hold a large core silver position!


