Welcome to the Zombie-land Of Investing (Part I)
 share
share
 share
share
 share
share
 share
share
 share
share
This current market environment is very reminiscent of the 2006-08 market environment where price rotated into weakness on technicals and continued to establish new all-time price highs in the process – creating what we are calling a “zombie-land melt-up”. This very dangerous price action is indicative of money chasing a falling trend. Where technicals and fundamentals are suggesting that price is actually weakening quite substantial, yet the process of price exploration is continually biased towards the upside as investors continue to pile onto the back of the beast expecting a further melt-up.
Let's take a look at what happened to the ES and Gold in 2006 and 2007. But, wait before you continue reading make sure to opt-in to our free market trend signals newsletter.
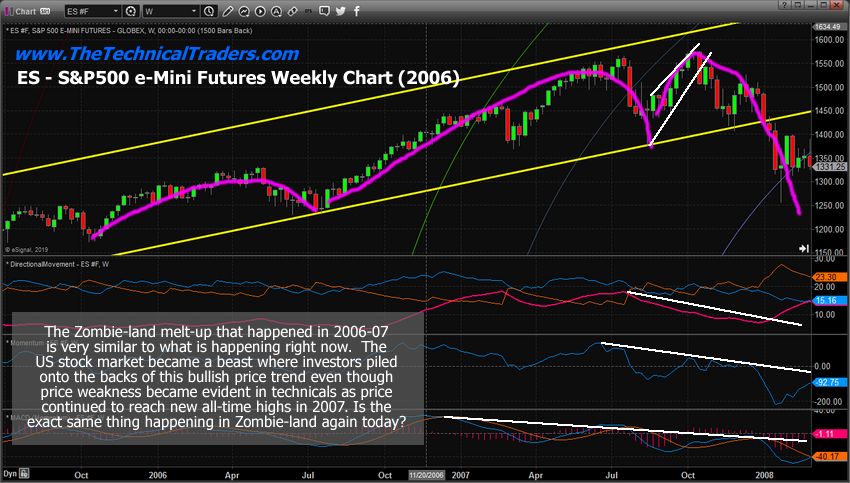
S&P500 Weekly Index Chart in 2006-2007
First, we'll start with the ES (S&P 500 E-mini futures contract). Pay attention to the MAGENTA arcs we've drawn on this chart that highlight the continued new highs reached throughout 2006 and 2007. Pay attention to the price rotation and volatility that started to happen near the absolute peak in July and October 2007 – just before the massive price collapse began. Notice how the technical indicators had been suggesting that price was weakening quite extensively since the beginning of 2007 and more aggressively after July 2007. Pay very close attention to the last peak on this chart and how a very deep price correction setup a new price high in a very tight FLAG formation just before the breakdown event.
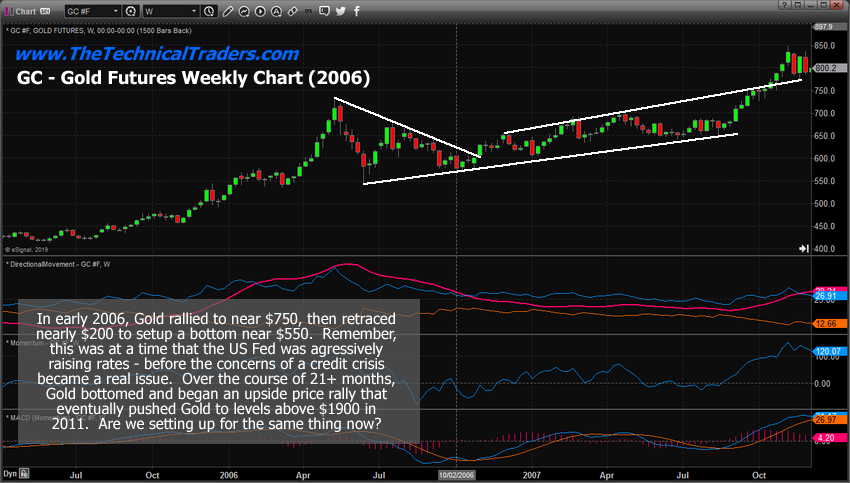
Price Of Gold Weekly Chart in 2006-2007
This Gold chart from the same time period highlights how Gold anticipated the market weakness by rallying up to a level near $750 in May 2016 – then retraced nearly $200 before forming a lengthy price bottom/base. Gold, acting as a safe-haven for investors, rallied almost 94% in the 24 months prior to this peak in 2006. It rallied another 256% (at the ultimate peak) from the low point established in June 2006. The process of this rally was an extended base/bottom in Gold between the base/bottom in 2006 and the renewed uptrend that started just before the end of 2007 (just before the markets started crashing).
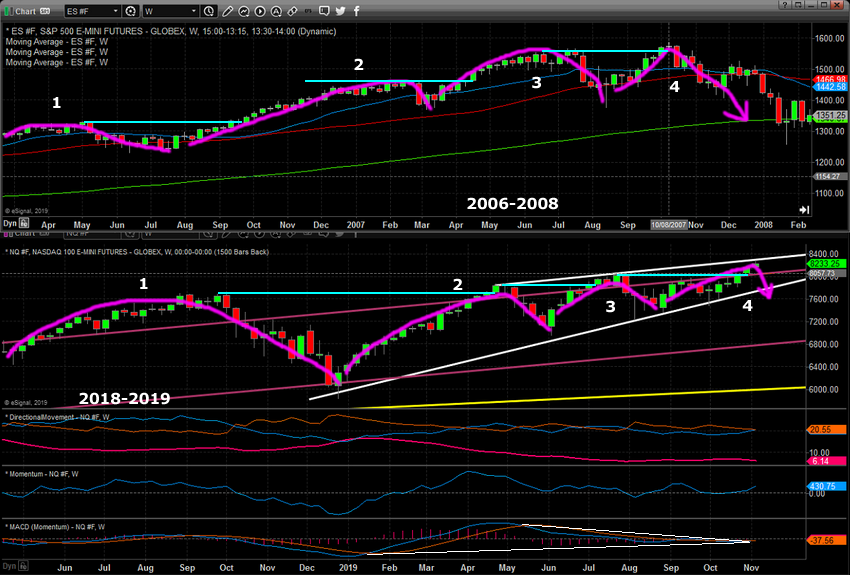
Compare S&P500 Index 2006-07 to 2018-19
We believe the current uptrend in the US stock market is acting in a very similar price formation to what we've highlighted in the 2006-07 market “zombie-land melt-up”. We believe that investors are piling into the US stock market when price weakness is clearly being illustrated by the technical and fundamental data. We believe a capital shift has continued to pile money into the US stock market as foreign investors pile onto the backs of other investors seeking safety and security within a stronger US economy.
Concluding Thoughts
We believe the current Zombie-land market is anticipating a price roll-over event (reversion) and that technical and fundamental data supports this analysis. We believe the credit/debt expansion of the past 8+ years has fueled a massive bubble that may result in a deep price correction if given the right circumstances and events. We believe this upside price move in the US markets, which are setting up near the exact same time-frame as the 2008 price collapse, maybe a very stern warning for traders and investors – BE PREPARED.
In Part II of this research post, we'll highlight the similarities setting up in the current market “Zombie-land” and what happened in 2006~2008. The expansion of the credit market over the past 8+ years has been extensive throughout the globe. The biggest difference this time is that risk may come from foreign markets vs. from within the US.
Keep reading our research because our proprietary tools have been nailing all of these price targets and move many months in advance.
I urge you visit my ETF Wealth Building Newsletter and if you like what I offer, join me with the 1-year subscription to lock in the lowest rate possible and ride my coattails as I navigate these financial market and build wealth while others lose nearly everything they own during the next financial crisis. Join Now and Get a Free 1oz Silver Bar!
As a technical analysis and trader since 1997, I have been through a few bull/bear market cycles. I believe I have a good pulse on the market and timing key turning points for both short-term swing trading and long-term investment capital. The opportunities are massive/life-changing if handled properly.
Chris Vermeulen
www.TheTechnicalTraders.com
********
share
share
share
share
share

Chris Vermeulen has been involved in the markets since 1997 and is the founder of Technical Traders Ltd. He is an internationally recognized technical analyst, trader, and is the author of the book: 7 Steps to Win With Logic
Through years of research, trading and helping individual traders around the world. He learned that many traders have great trading ideas, but they lack one thing, they struggle to execute trades in a systematic way for consistent results. Chris helps educate traders with a three-hour video course that can change your trading results for the better.
His mission is to help his clients boost their trading performance while reducing market exposure and portfolio volatility.
He is a regular speaker on HoweStreet.com, and the FinancialSurvivorNetwork radio shows. Chris was also featured on the cover of AmalgaTrader Magazine, and contributes articles to several financial hubs like MoneyShow.com.


