What Is Dennis Gartman Thinking Of?


I said I wasn't going to write any more articles until mid-January, but Dennis Gartman and the media got my goat one more time with their bearish bias on the gold and silver market. So it seems that once again, it falls to me to refute him and the financial media who never passes an opportunity to beat their copper kettles with their wooden spoons every time Dennis gets acrophobic on the shiny stuff. Note to CNBC: are you aware that Mr. Gartman sometimes gets bullish on the metals?
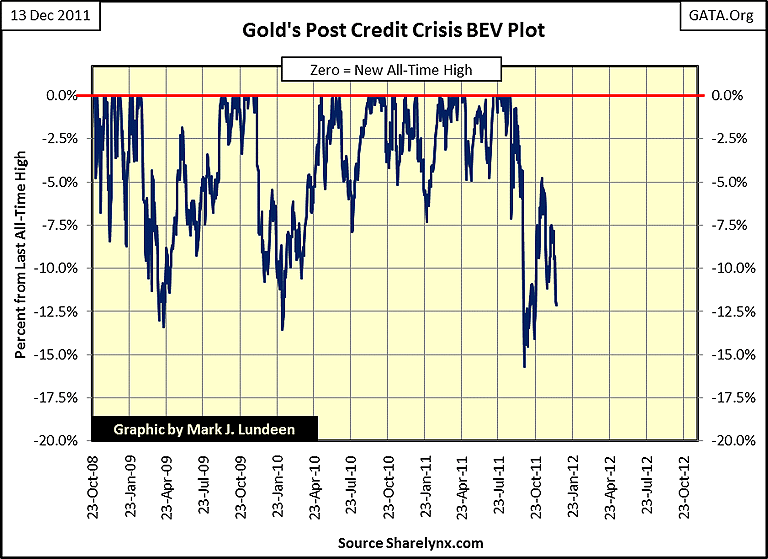
Here are the Bear's Eye View (BEV) Charts for the post credit crisis gold and silver prices. BEV charts convert price data into a plot that is restricted to a percentage range bound by 0% for each new high, (and never more) and -100% for a total loss in valuation. So, in the charts below, we are looking at post credit crisis highs, and percent declines from those highs. Remember, gold and silver bottomed in late 2008, not in March 2009 as did the stock market.
Gold's BEV chart look okay to me, if not to Dennis Gartman. Since October 2008, it has retraced by double digits three times. On the first two occasions it took months to recover before going on to new all-time highs. I expect this will be true with the current decline too.
A fact that seems to be unknown to many in the financial media is that all bull markets see double digit corrections. From 1989-2000, whenever the Dow Jones saw a significant correction, even by 20%, it was a buying opportunity. During the Dow's bull market seen below, these declines were followed by new all-time highs. For your information, the Dow Jones went from 2,734 in August 1989 to its bull market top of 11,722 in January 2000.

Now we can all agree that silver's post credit crisis BEV chart looks horrible.
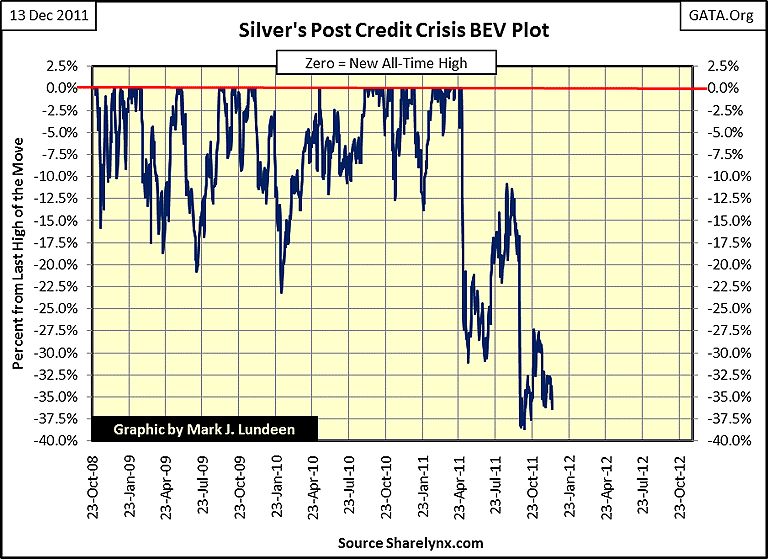
But silver's big declines in 2011 look damn suspicious too! Look at the plunges in silver (May & Septembers), one day market volatility looks normal, days later we see silver down by 20%!
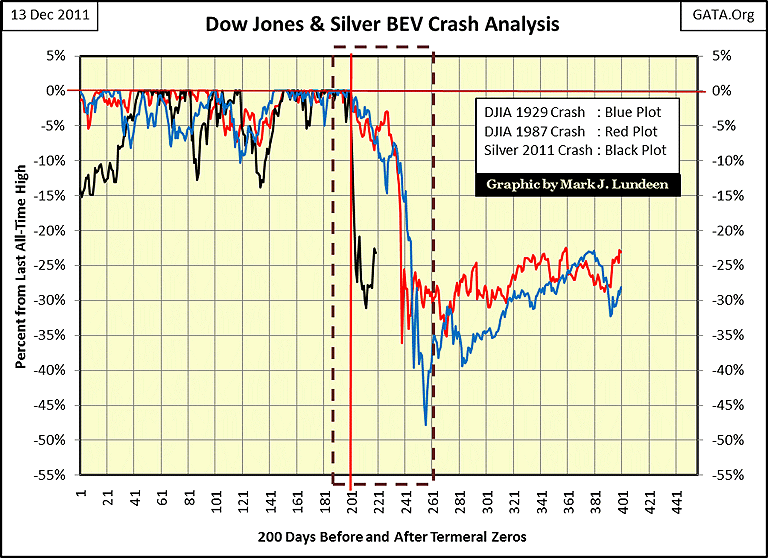
Take a long look at my next BEV chart, where I compare the Dow Jones crashes of 1929, 1987 with Silver's crash of last May. I positioned these three charts so that their Terminal Zeros (last highs) align with 200 days before and after the market's last high. Both Dow Jones crashes for 1929 & 87 (blue and red plots) saw 30 to 40 days after their BEV Terminal Zeros where the Dow gradually trended downwards before their steep historic crashes. This was not so for silver's crash of May 2011 (black plot): one day it was at a new post credit-crisis high, five days later it's smashed down 27%! In the last 100 years, I don't believe any other market has ever caved in this quickly, certainty now twice in the same year.
Here are two tables with the specifics. TZ (Terminal Zero) is the date of the last all-time high for that market.
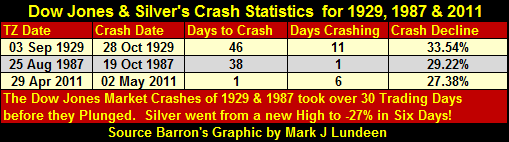
The next table shows the Bear's Eye View declines for the first twenty days after their terminal zeros. I included silver's second crash for 2011. Note that silver's "market top" was actually the high of September 2nd of this year, just before it plunged 30% fourteen trading days later.
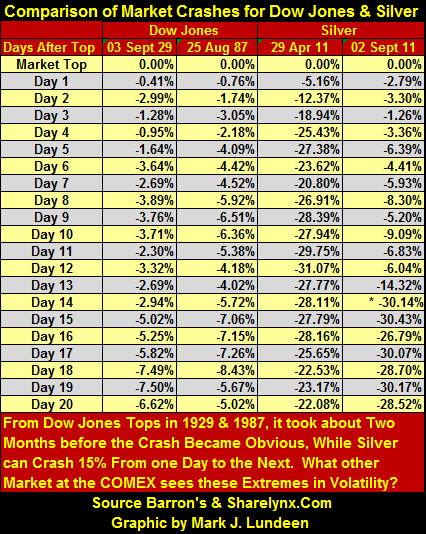
Someone's finger prints are all-over the silver market. The CFTC's perennial investigation of the silver market is a hoax on the public.
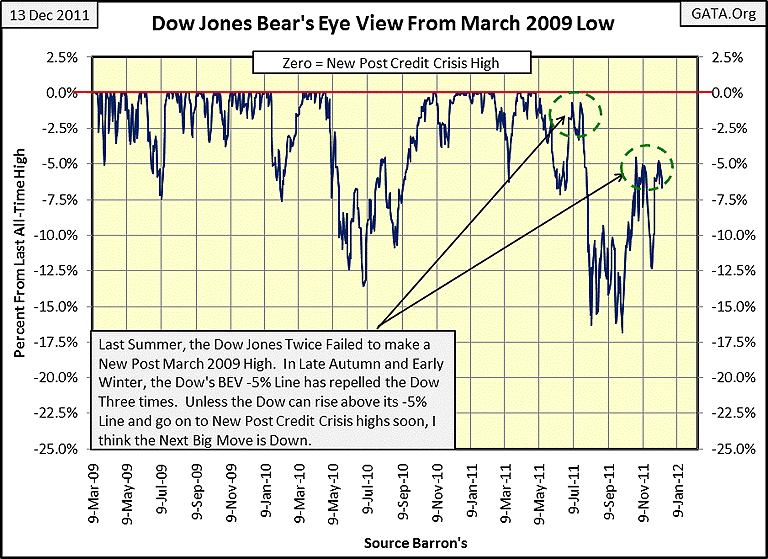
Let's take a look at the Dow Jones. This is a tired old bull trying to fight market gravity's downward pressure. In July, the Dow twice failed to find the strength to rise up a puny 1% to make a new post credit crisis high. Then from October to December, the Dow's bar was lowered to its BEV -5% line, where three times it made it to its BEV -5% line, only to fall below it again. Who knows what is going to happen tomorrow? I don't! But looking at what the Dow Jones has done since its lows of March 2009, if it can't get above its BEV -5% line, and then make a significant new post credit crisis high pretty damn soon, the next big move must be down unless the "policy makers" throw a few trillions of dollars of inflation at the stock market again. Doctor Bernanke has even admitted that he was responsible for the post March 2009 recovery on CNBC with Steve Liesman.
"Policies have contributed to a stronger stock market just as they did in March 2009, when we did the last iteration of this. The S&P 500 is up 20% plus and the Russell 2000, which is about small cap stocks, is up 30% plus."
- Doctor Benjamin Bernanke, CNBC Interview with Steve Liesman 13 Jan 2011 (1:40 PM).
No market today trades on its own virtue. Listen to the "experts" on CNBC as they place their market bets based on what this, or that central banks is suspected to do next week or next month. It's all bull shit! Prices in the global financial markets; and cauliflower in the supermarket are contrived by cake-eating academics who've never had a real job in their lives. The world would be much improved if these twits went back to their old classrooms to pollute the minds of pimpled faced adolescents.
Here's the Dow's BEV chart from 1996 to December 13, 2011. As of today, Dec 13th, it was -15.60% below its last all-time high of October 2007. The Dow's last all-time high was over four years ago. I wonder if Dennis Gartman is becoming bullish on the Dow and the S&P, now that Europe's policy makers are finally getting serious about their financial system. Clearly, Europe's gift to mankind (the EU's "policy makers"), have only been fooling around for the past two years.
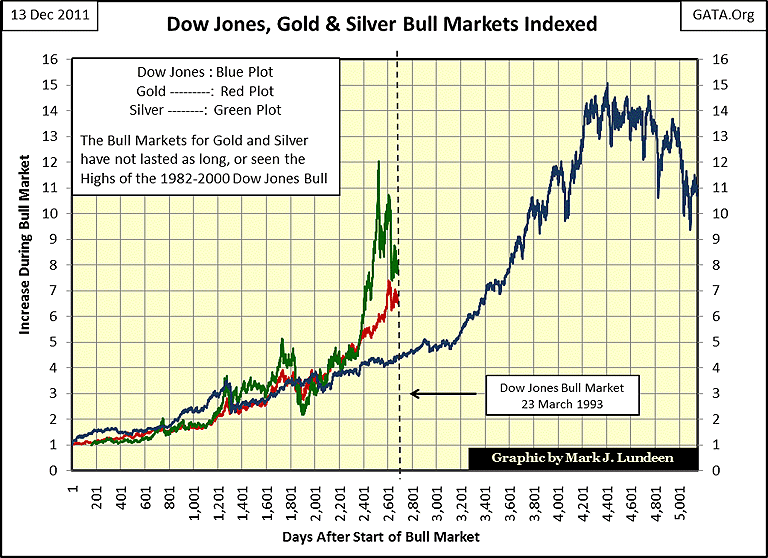
Here is a chart for the bull markets in the Dow, gold and silver, indexed to their pervious bear market lows. As of December 13, 2011, gold and silver have seen 2,684 days in their bull markets. A time comparison with the Dow's 1982-2000 bull market would place the Dow at March 23, 1993. I wonder what made Mr. Gartman call gold a sell? Was it that gold's bull market has lasted only half as long as the Dow Jones; or that it has only managed to make half the gains of the Dow Jones' August 1982 - January 2000 bull market?
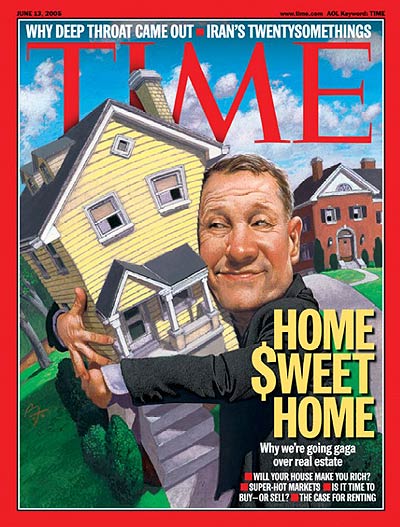
His bearishness on gold couldn't be that a mania has developed, where grandmothers stand in snow outside a crowded coin shop to buy gold and silver. Below, courtesy of TIME Magazine, is what a top in a market looks like, when the media knows as a fact that a particular market is going to make everyone rich. Good job TIME with assisting Congress and the Fed bankrupting millions of people, and polluting the reserve base of the world's pension funds and insurance companies with illiquid US mortgages. People today just have too much respect for people in the media, people who have done nothing to earn it!

The real estate bull market is actually funny when we think of the role the media had in it. From 2004-07, the media was very bullish in investing in housing. When the market crashed, they blamed Bush, never mentioning their part in inciting a financial mania in the mortgage market.
I'm really getting sick of "market experts" in the financial media like Dennis Gartman. I'm not saying Dennis is a bad guy, it's just that he can't rise above the trader's short-term mentality and see the big picture of massive fraud by government and market officials.
One thing is for sure; millions of people follow these market "experts" seeking an exit from the coming collapse in government benefits for the aged. But the financial media has fallen far from the time when Clarence Barron, founder of Barron's Financial Weekly stated the purpose of financial journalism:
"You are in the field to defend the public interest, the financial truth for investors and the funds that should support the widow and the orphan."
- Clarence W. Barron's Mission Statement for the Financial Press.
"Mr. and Ms. Expert", in the years to come, your readers and listeners will remember what you told them today. But will you feel proud for providing a real service to the consumers of your opinions? In most cases, I expect not.
Mark J. Lundeen
[email protected]
[email protected]


