What Goes Up, Must Come Down . . .But Sometimes, Only A Little
Posted for members of Elliottwavetrader.net on the prior Sat night
As I have been warning for weeks now, expecting a standard pullback in the metals and miners may leave you in the “DUST,” (yes, pun intended). You see, those with experience in the metals market know that the market will not usually provide much in the way of a standard pullback when they have really returned to their bullish state. So, I have been warning those that are waiting for the standard Fibonacci 0.500 to 0.618 retracements that the train may leave the station without them.
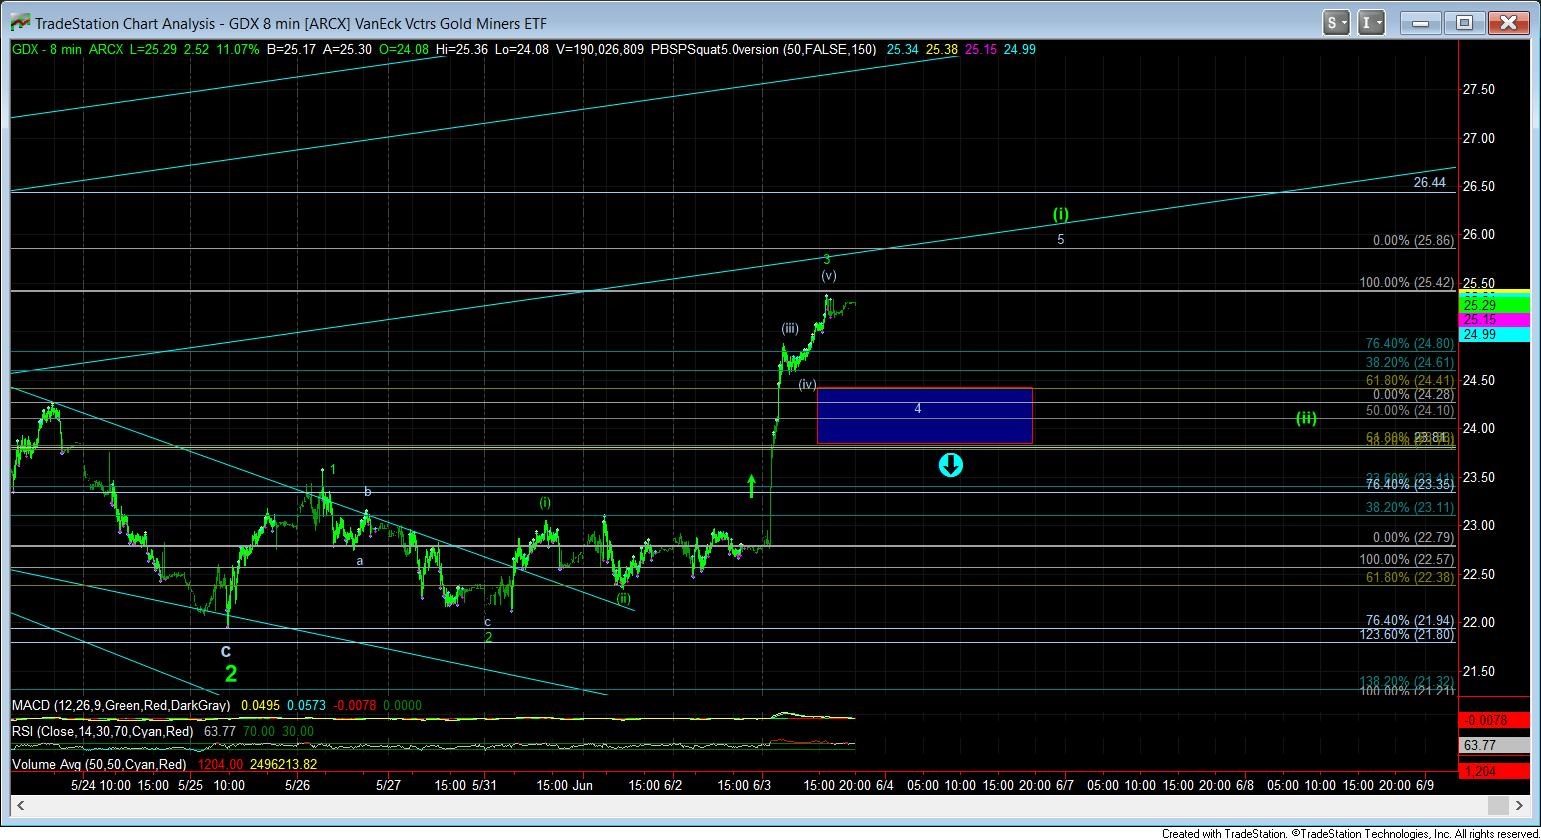
It is for this reason we have been tracking the smaller degree patterns as closely as we have in our Trading Room. In fact, when the GLD and silver struck their minimal patterns for a completed downside structure this past week, I sent out my Wednesday evening metals update with the title “Downside Patterns Have Completed.” Moreover, I noted that if we see a strong move up in the GDX to confirm the heart of the 3rd wave has begun, “the next degree wave (i) of 3 of iii should be targeting the 25.85 region, which is the main break out region for GDX.”
So, as we struck the lows this past week, we were busying ourselves with buying various stocks our EWT Miners Portfolio management team had identified at our last meeting, and now have healthy further gains in our portfolio, which will all be protected by appropriate stops.
But, I do have to note that when the GDX meandered higher on Thursday in unconvincing fashion, I was seriously questioning whether they were going to break out in a 3rd wave, or if we needed to strike the 21.20 level before they turned higher. Yet, as those in our Trading Room know well, I had sold almost all of the short term hedges I held (most of which I bought a month ago) as I did not have the stomach to play the short side of this market in any meaningful way. As I explained to those in my Live Video (as I was selling those shorter term hedges), the setup was in place which can permanently wipe out any of the gains made in those June hedges quite quickly. So, I did not want to hold them any longer, and I cashed them, and, as it turned out, right before we rallied. As I have noted time and again, in a bull market in metals, surprises will be to the upside.
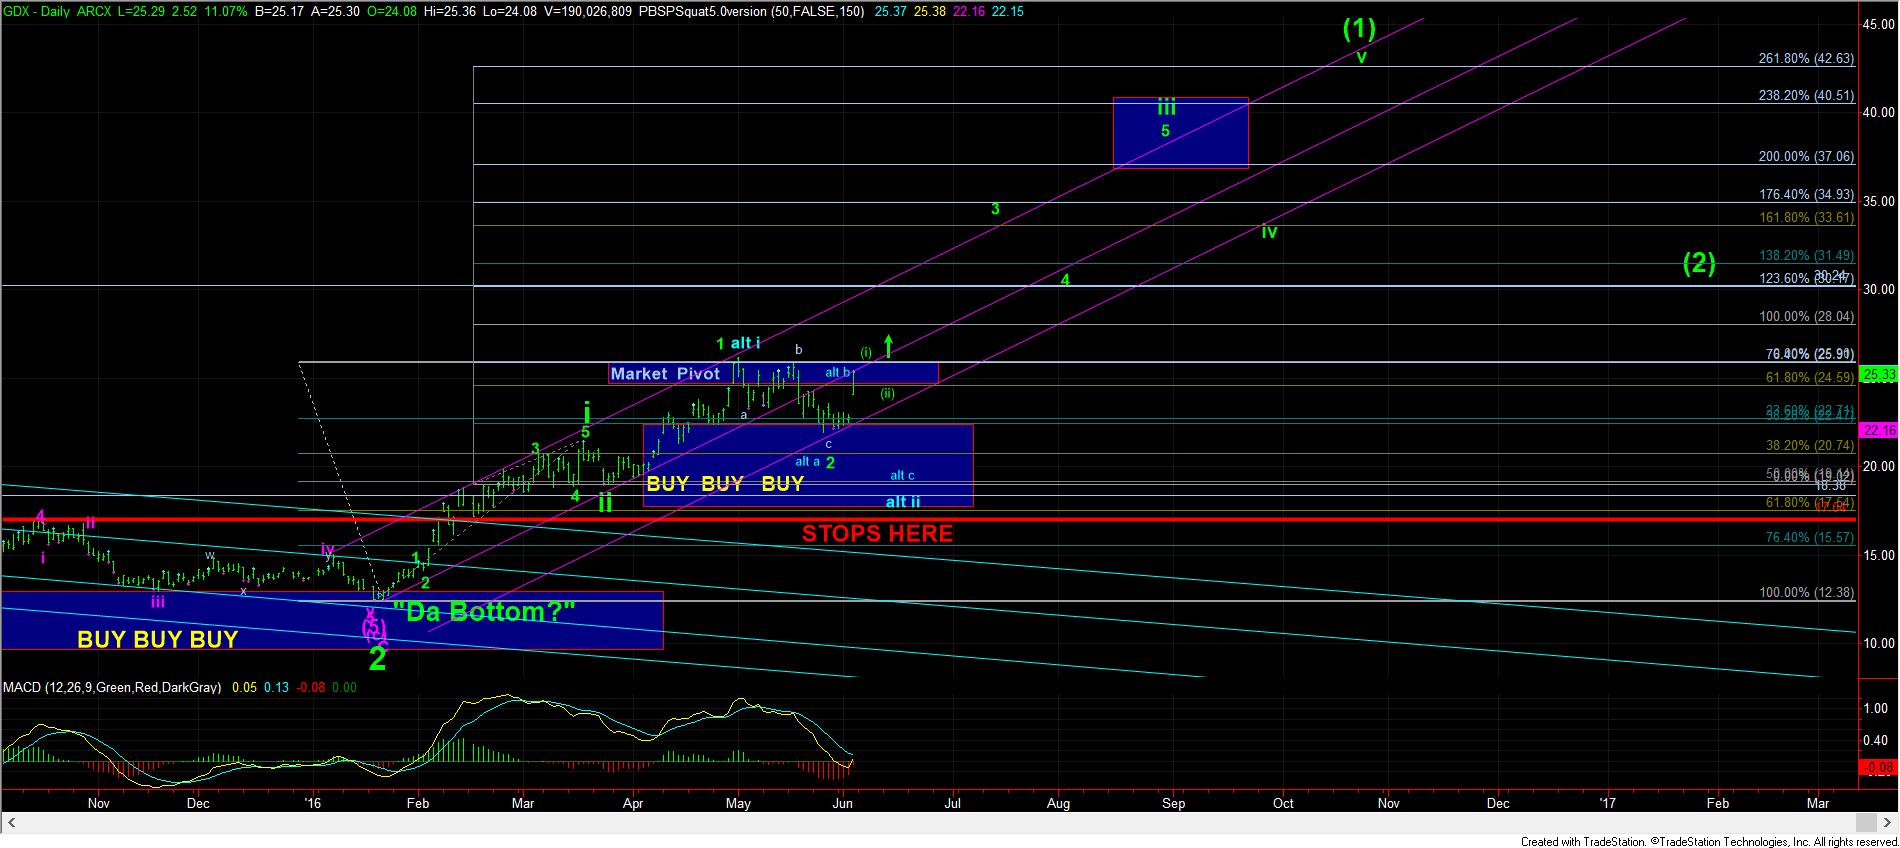
With Friday’s break out, it gives us a lot more confidence that the rally to the 40+ region in the GDX, 155+ in GLD and 27 in silver may have begun. But, as those who follow me know, I still seek confirmation, since we still do not have our larger break out signal. So, for those that got long with us this past week, you must remain vigilant.
GDX has the cleanest looking chart at this point, so I will use it for illustrative purposes. While I have been highlighting the i-ii, 1-2 set up on the GDX, I have also been noting that this needs confirmation that we are heading to 40+ sooner rather than later. With the rally we have seen on Friday, it still looks like we will need a micro wave 4 and 5 to complete wave (i) of wave 3 of iii. Should we complete that 4-5 in the upcoming week, I will then be looking for a corrective wave (ii) to set up our major break out signal, along with confirming that a long term bottom is in place, with probabilities of 70% or higher. That break out signal will be an even stronger break out over the high of wave (i), the level at which we will know once it completes.
As a further warning to those who are still looking lower in the complex, please do not assume that this rally which was seen on Friday is “clearly” a counter-trend rally. One of the hallmarks of a 3rd wave is that we see very strong gaps in the market due to the power of a 3rd wave. In fact, Friday’s action was the strongest action we have seen in the complex since the GDX bottomed earlier this year. This is truly a hallmark sign of a 3rd wave, and I would not ignore it if you are assuming that this is only the b-wave in blue, as presented as the blue alternative count on the daily GDX chart. From the perspective of how I am positioned in this market, the b-wave has to prove itself more than the 3rd wave does.
In order for me to consider the blue b-wave count on the GDX chart as having a reasonable probability, I would have to see the GDX break back down below the 24 region again. If it is unable to do so over the next week, then it becomes much more likely that we are on our way to the 40+ region, but still needing a wave (ii) pullback/consolidation over the next week or two.
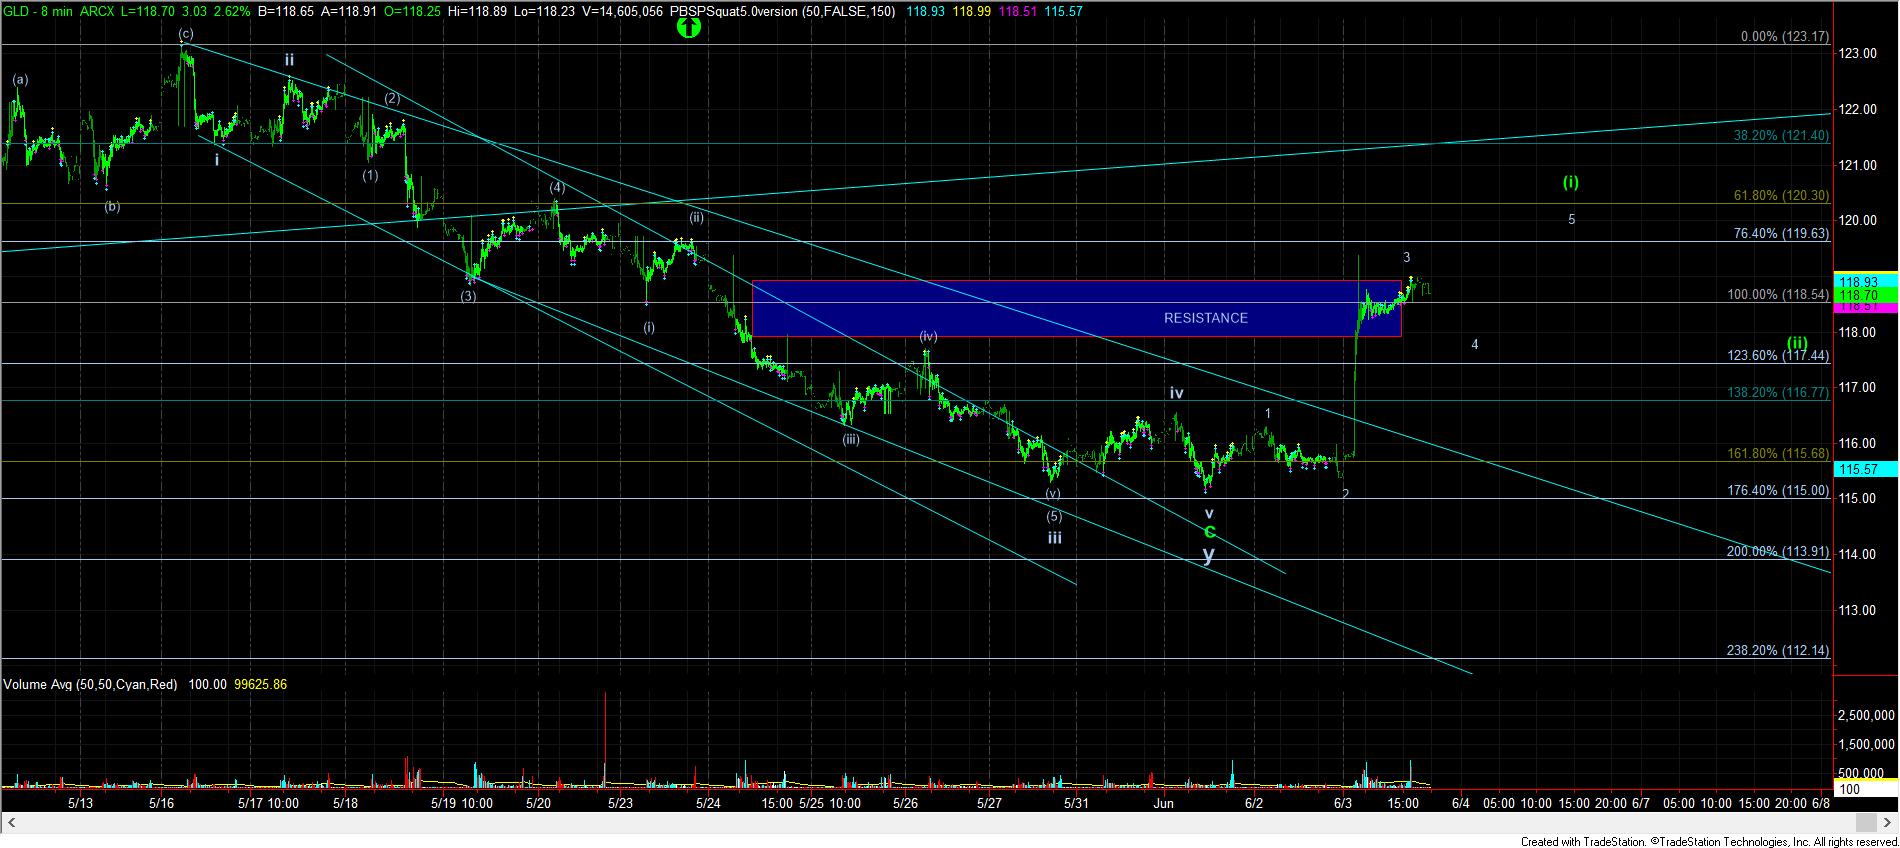
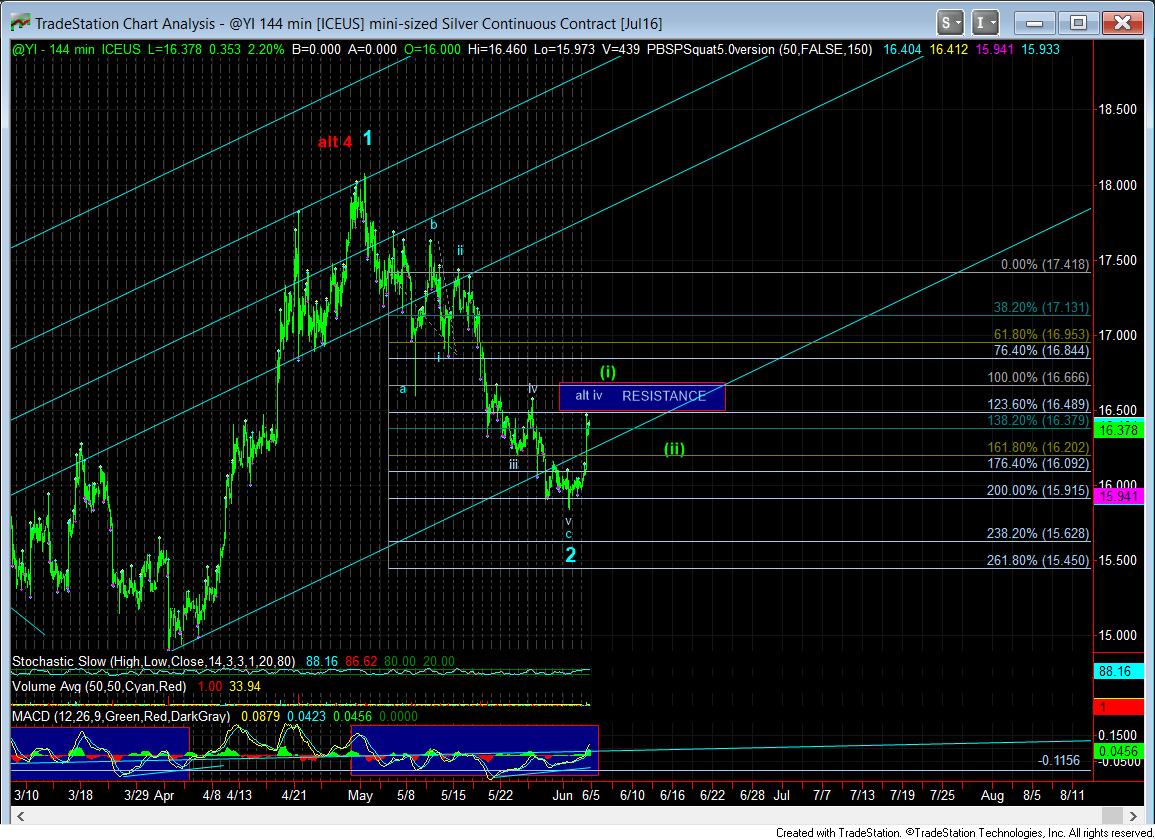
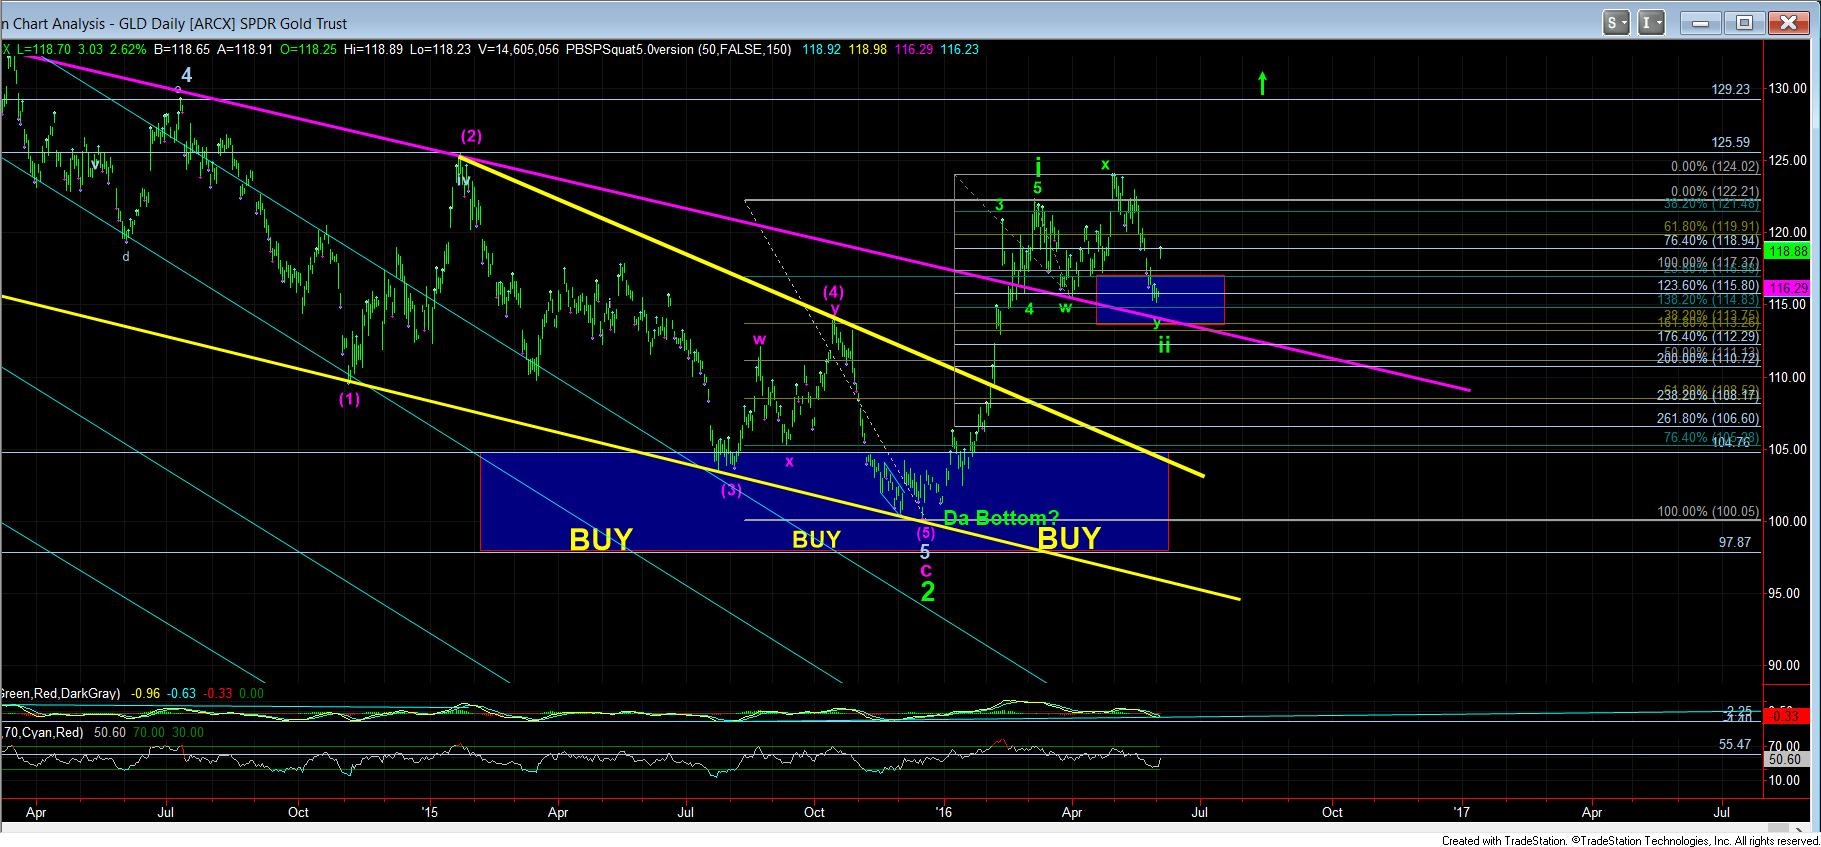
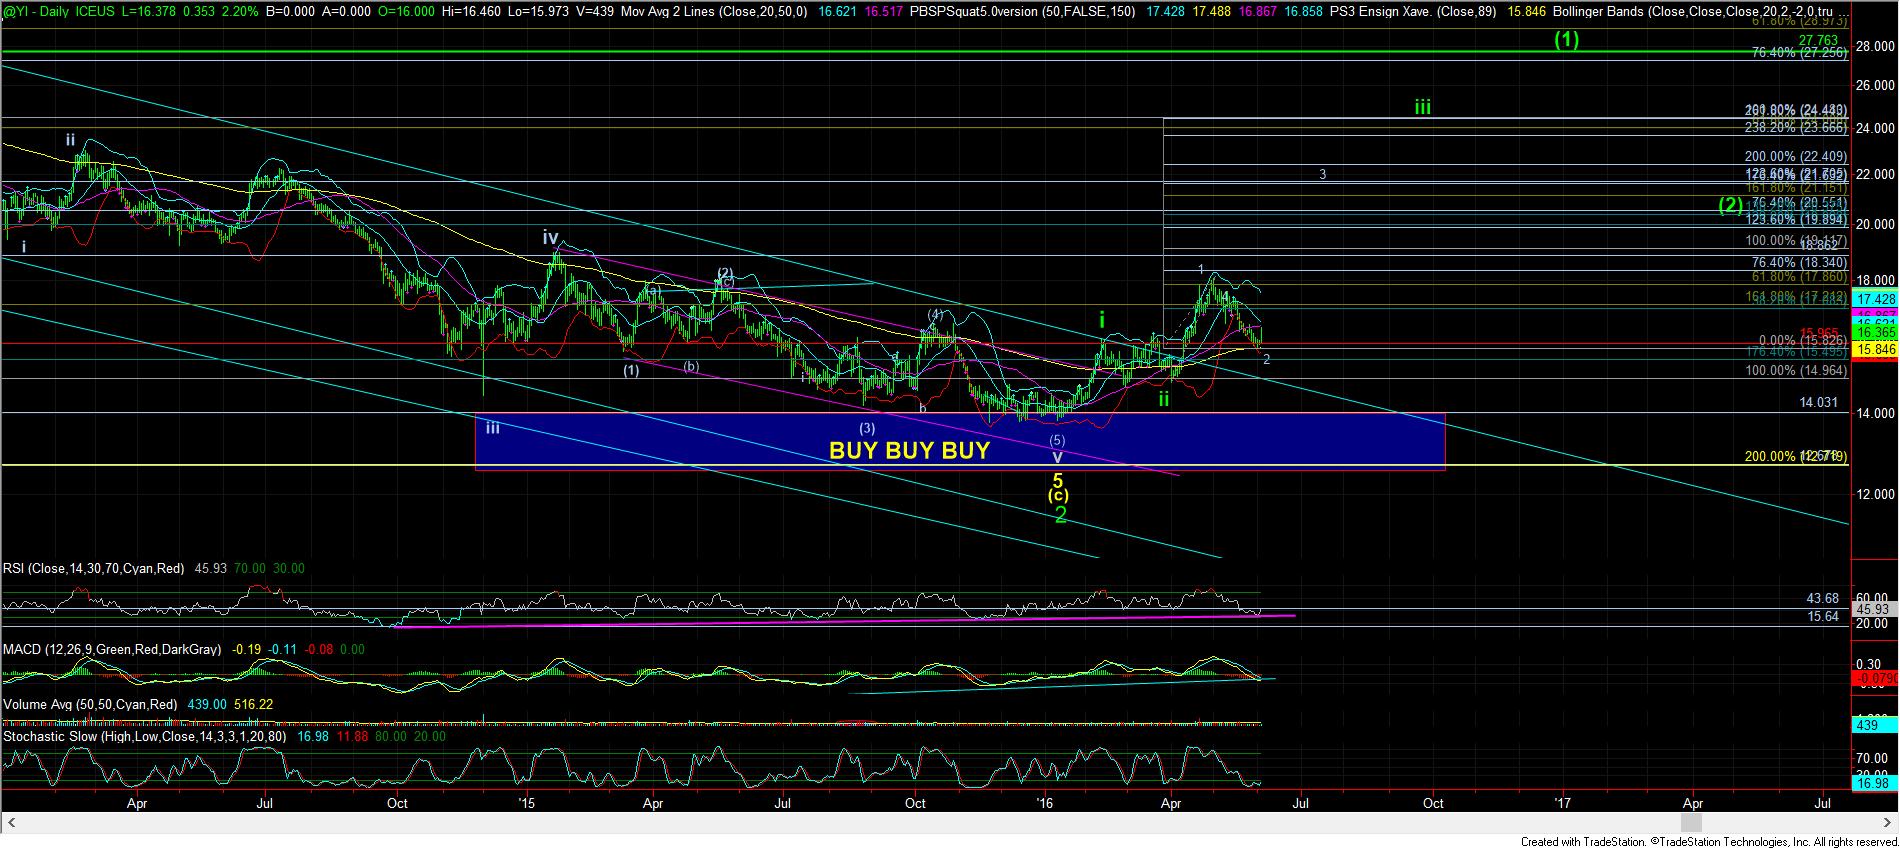
As far as silver and GLD, as you can see from the attached smaller degree charts, they have still not broken out of their respective resistance regions, as you can see from the attached charts. But, as I had been noting through the early part of the week, the positive divergences seen on silver supported that the market was bottoming, and the setup was in place to begin the next uptrend. In fact, the last time we had this exact setup on the MACD on the 144 minute chart, silver rose from 14.90-17.80 within 3 weeks. And, if this is truly the start of the heart of the 3rd wave, we “should” be able to exceed that performance on this rally.
However, we still do not have a full 5 wave structure off the lows to make a stronger assumption that the next bull phase has begun. My expectation is that by the time I am ready to publish my mid-week metals review, the metals will have either provided us with a 5 wave move off the lows, or will have shown us that this was nothing more than a corrective rally. Based upon the strength seen in the miners this past week, my expectation is the former rather than the latter.
See charts illustrating the wave counts on the GDX, GLD and YI:
- Avi Gilburt


 Avi Gilburt is a widely followed Elliott Wave technical analyst and author of


