What a Slide in Gold! What a Jump in the USDX!


Both are completely unsurprising, as the technical analysis (and common sense) provided insights beforehand.
Yes, the U.S. – China dramatic tariff decrease announcement was the direct trigger – the technical writing was on the wall for a long time.
This goes in particular for the situation in the USD Index, where the sentiment was particularly negative while it reversed by forming a classic inverse head-and-shoulders pattern, and it did so at extremely strong support levels based on long-term 61.8% Fibonacci retracements.
However, before moving to charts, let’s discuss what’s going on from the fundamental point of view.
The Dollar-Tariff Dance: How Trade Tensions Reshape Markets
The relationship between the US. Dollar Index, stock markets, and commodity prices during periods of trade tension follows distinct patterns that experienced investors can leverage for strategic positioning. When the US imposes tariffs, the dollar typically strengthens through reduced import demand and safe-haven capital flows, creating predictable ripple effects across markets. This dollar strength then exerts downward pressure on commodity prices—particularly industrial metals like copper—through decreased global purchasing power and financial market dynamics.
How tariffs strengthen the greenback
Trade disputes consistently drive dollar appreciation through multiple reinforcing channels. During the 2018-2020 US-China trade war, the Dollar Index strengthened from approximately 90 to 98—an 8-9% appreciation—as tariffs escalated from 3.8% to 19.3% on Chinese imports.
The relationship operates through three primary mechanisms:
1. Demand channel: Tariffs reduce US demand for imports, decreasing the need for foreign currencies to purchase those goods. This creates direct upward pressure on the dollar as fewer dollars are exchanged for foreign currencies.
2. Capital flow channel: Trade tensions trigger global uncertainty that drives safe-haven capital flows into dollar-denominated assets. During the 2018-2019 escalation phase, the DXY index increased approximately 2% when tariffs rose from 10% to 25% on $200 billion of Chinese goods.
3. Interest rate differential channel: If tariffs generate inflationary pressures domestically, central banks may respond with tighter monetary policy. Research from economist Stephen Miran suggests a 10% change in tariffs theoretically leads to approximately 4%-dollar appreciation, though retaliatory tariffs can diminish this effect.
When the dollar rises, copper falls
Statistical evidence confirms a consistent negative correlation between dollar strength and commodity prices, particularly for industrial metals like copper:
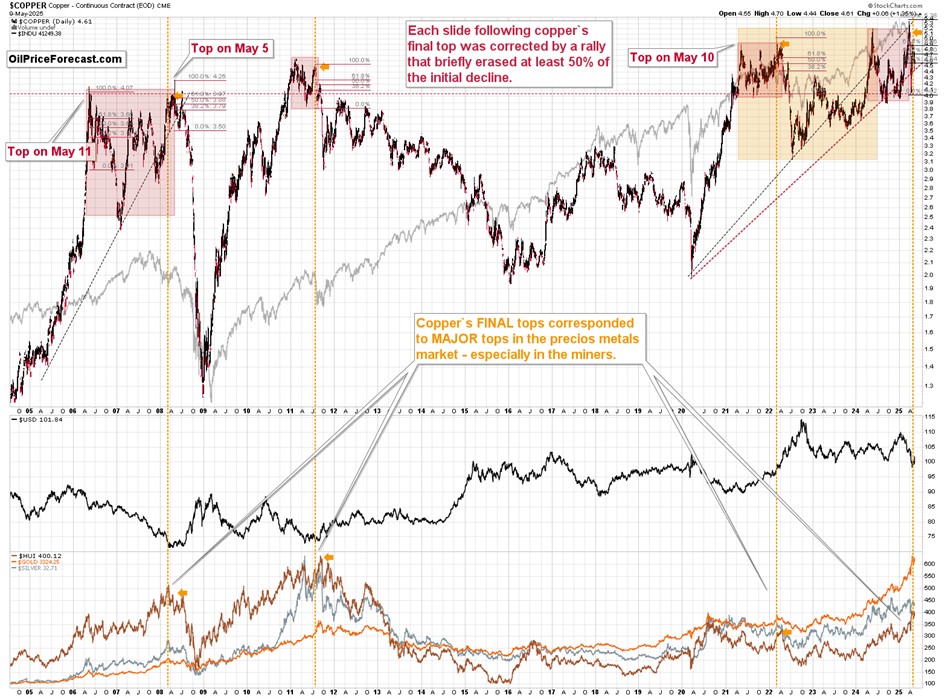
Please take a look at the key tops in copper that I marked with orange vertical lines. In each case, this was a major, medium-term bottom in the USD Index it was still relatively close to it (ahead of a powerful rally). This was also true for the 2018 top in copper (bottom in the USDX) that I didn’t mark on the chart.
This inverse relationship operates through several mechanisms:
- Purchasing power effect: When the dollar strengthens, commodities become more expensive in non-dollar currencies, reducing global demand and pressuring dollar-denominated prices downward.
- Production cost effect: For commodities produced outside the US but priced in dollars, a stronger dollar means producers receive more in their local currency per unit sold, potentially incentivizing increased production and lowering prices.
- China factor: As the world's largest copper consumer, China's purchasing behavior significantly impacts prices. Dollar strength against the Chinese renminbi directly affects Chinese copper demand, as imports become more expensive.
During the early 2018 tariff announcements, copper prices declined by approximately 15-20% as the dollar strengthened, demonstrating this relationship in practice.
Why stock rallies after trade deals fizzle
Market data reveals that stock rallies following trade deal announcements often prove short-lived despite initial optimism. This pattern was evident in the 2018-2020 US-China negotiations and is likely about to repeat itself based on the current agreement to reduce tariffs.
Economic theory explains this phenomenon through three distinct mechanisms:
1. Information asymmetry resolution: Trade deals initially resolve uncertainty, triggering market rallies. However, as investors process the detailed implications and implementation challenges, initial enthusiasm gives way to a more nuanced assessment.
2. Discount rate vs. cash flow effects: Announcements temporarily reduce the risk premium (discount rate), causing immediate price increases. However, if actual cash flow benefits prove more modest than anticipated, prices subsequently adjust downward.
3. Tariff persistence effects: Even reduced tariffs continue to disrupt supply chains and global trade. Soon after the May 2025 US-China agreement, Flexport CEO Ryan Petersen noted that even with tariffs reduced to 30%, significant trade disruption would persist after the previous 145% rate had caused shipments from China to plunge 60%.
Why tariffs remain headwinds even at reduced levels
Economic theory explains why tariffs create persistent headwinds for global trade and stock markets even when reduced:
Price distortions: Tariffs create wedges between domestic and global prices, leading to inefficient resource allocation. Research shows that even modest tariffs of 5-10% can significantly alter trade flows.
Supply chain disruption: Modern production relies on complex global supply chains. Tariffs force costly adjustments to these arrangements with effects that persist long after tariff reductions.
Uncertainty effects: The policy uncertainty created by tariff regimes deters business investment and expands trade costs. A study from Yale's Budget Lab estimated that the 2025 tariff escalation reduced GDP growth by 0.9 percentage points, an effect that will only partially reverse with the recent reduction.
Global transmission channels: Dollar strength impacts global trade through financial channels (tightening conditions due to dollar-denominated debt worldwide), trade financing effects (increasing local currency costs), and liquidity effects (constraining economic activity, particularly in emerging markets).
Research from the Bank for International Settlements concludes that global trade activity is strong when the dollar is weak but suffers when the dollar is strong. This pattern has remained remarkably consistent even during major economic disruptions.
Fundamental Conclusion
The interrelationships between tariffs, dollar strength, commodity prices, and stock markets form a predictable pattern that investors can leverage for strategic positioning. While tariff reductions like the recent US-China agreement provide immediate market relief (an emotional one in particular), historical evidence and economic theory suggest caution about sustained market optimism. The 30% residual tariffs will continue to distort trade flows, maintain upward pressure on the dollar, and exert downward pressure on commodity prices. The rally in stocks is also likely to be temporary.
Technically Speaking
The USD Index soared.
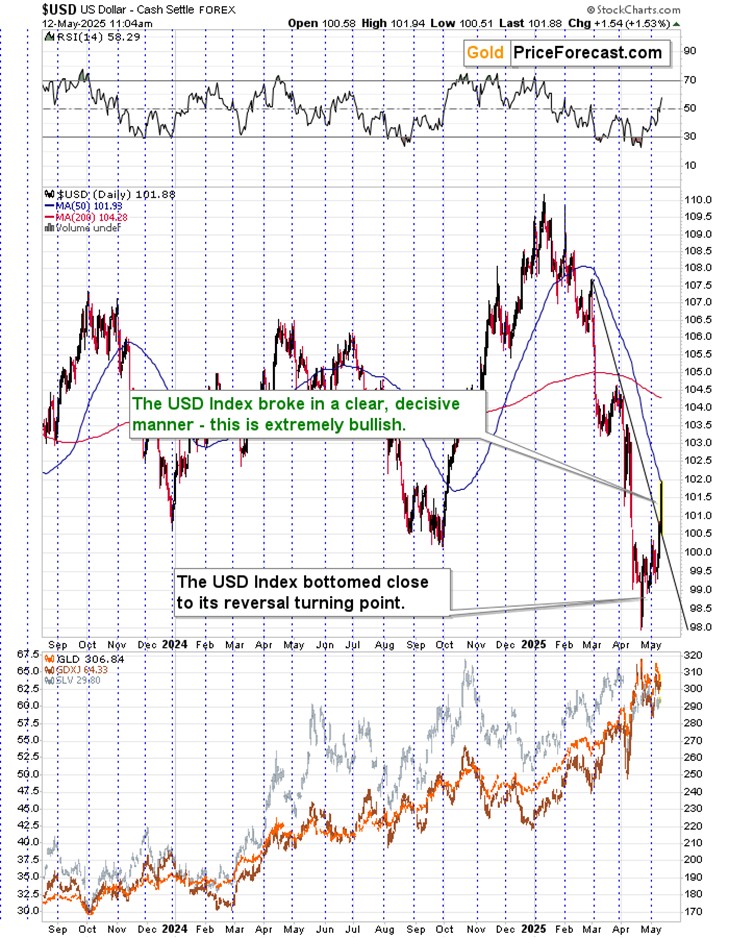
The breakout above the declining resistance line is crystal-clear, and so is the invalidation of the move below the 2023 and 2024 lows. This is as bullish as it gets, especially since this perfectly fits the bullish set-up from USD Index’s long-term chart.
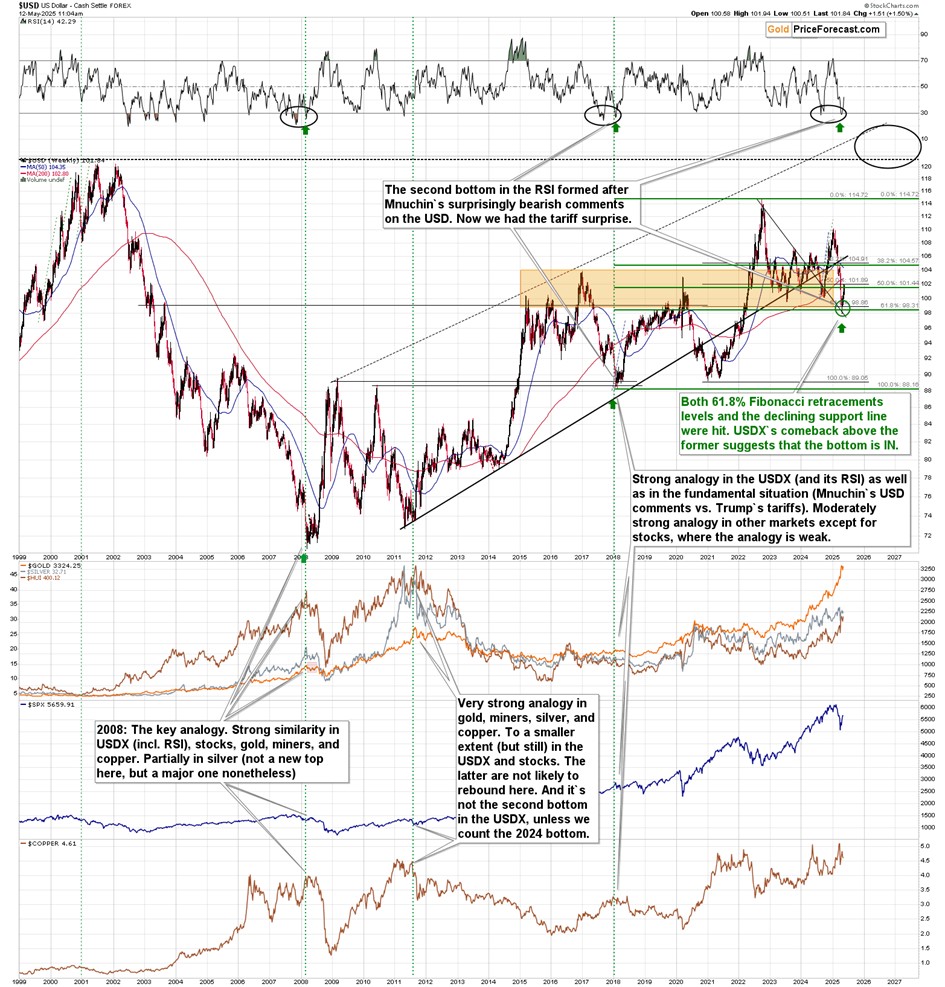
Quoting my previous comments on the above charts:
“On a short-term basis, we see that the USDX is on the verge of breaking above its steep, declining resistance line. At the same time, a rally above this line will also take the USD back above its last year’s lows, thus invalidating the breakdown.
This is the most likely way forward, and when it happens, it will become clear to many market participants that the trend has reversed.
That’s when the declines in the precious metals market will become much bigger.”
Today’s breakout in the USD Index has indeed made it clear, and the decline in gold is also quite sizable, as gold price is down by over $100 dollars this week, even though the markets have yet to open in the U.S. Some people might be using this moment to buy more for their retirement accounts, while other will likely wait for even lower prices.
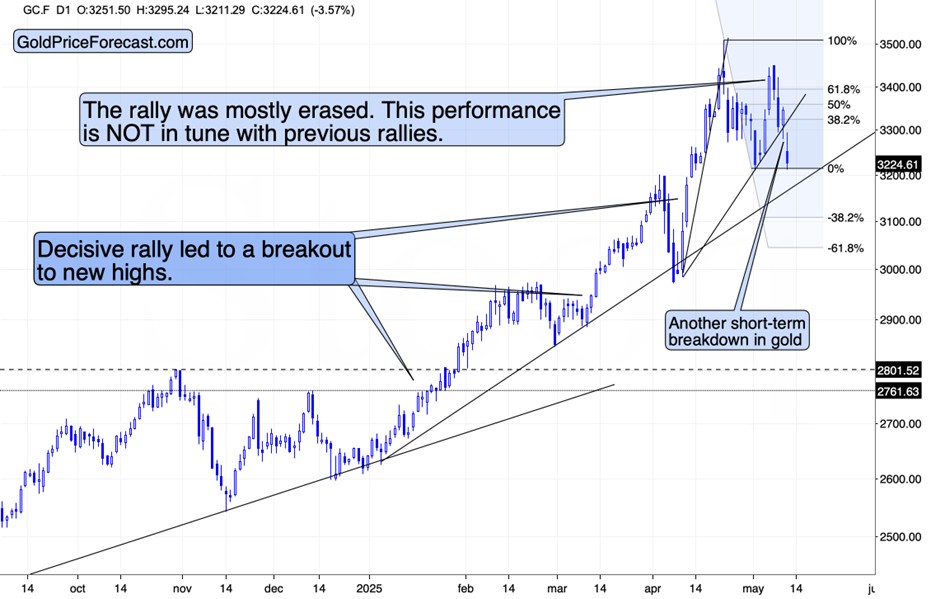
Gold’s slide took it back to its early-Maybe lows and well below the rising support line based on it and the April low.
I told my subscribers that the pre-FOMC rally was likely very temporary and something that’s about to be reversed, and that’s exactly what happened.
What’s next? Just as the rally in the USD Index is just getting started (it’s obvious based on the USD Index’s long-term chart), the opposite is the case for gold, silver, and mining stocks. Declines in them are just getting started.
It seems that there’s just one thing preventing the decline from accelerating – the strength in the stock market.
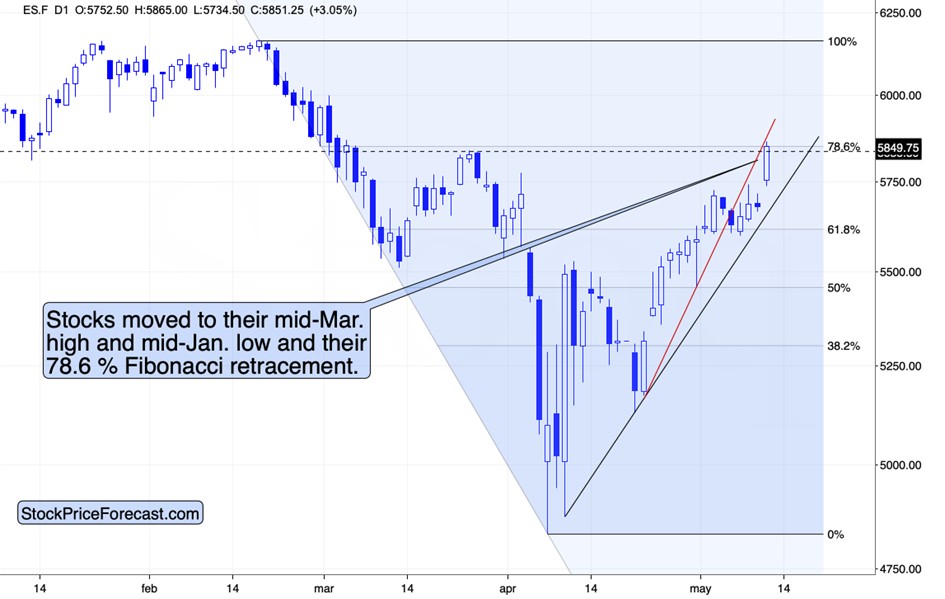
The S&P 500 Index soared based on the news. It turned out that my recently bearish comments on stocks were wrong, while Paul Rejczak’s bullish ones (his Volatility Breakout System flashed a buy signal for stocks some time ago) were correct.
Well, we did profit on the easy part of the rebound, though, which was my deliberate decision. I’m stepping out (with regard to describing trades) of the key area of my expertise only when I see something superb – just like (it does indeed usually yield great results) I now see it in copper (and copper stocks).
So, anyway, what does the above tell us? Two things.
One is that – similarly to what we saw in copper – the rally in stocks is not as big as the slide that we saw in April when the tariffs were announced, which suggests that the market might be waking up to the reality that tariffs will be ultimately negative for the world economies, including the U.S. economy.
The other is that since the current move is unlikely to last based on the fundamental situation, we should be on the lookout for factors confirming or invalidating this. What we see above is that stocks moved slightly above their late-March high as well as the (not that popular, but still important) 78.6% Fibonacci retracement level. This means that a move back below those levels and a close below them would be an invalidation and a sell signal.
Will we see something like that? This is quite likely given copper’s triangle-vertex-based reversal (covered in the full version of the analysis – today’s Gold Trading Alert) that’s due today. Copper and stocks have been moving in sync recently, so a top in copper would likely correspond to a top in stocks.
Now, since the stock market is likely the thing that’s keeping many other markets up despite dollar’s strength (like silver, and mining stocks), the above-mentioned declines in stocks, would likely pull the trigger on the declines also in the other markets.
Thank you for reading the above free analysis. If you'd like to access my complete premium analysis, including specific technical targets for FCX (even options) and silver, detailed analysis of mining stocks, and comprehensive portfolio insights, consider subscribing to my Gold Trading Alerts or – if you want the best – our Diamond Package. If you’re not ready to subscribe yet, I invite you to stay updated with our free analyses - sign up for our free gold newsletter now.
*******
 Przemyslaw Radomski, CFA, is the founder, owner and the main editor of SunshineProfits.com. You can reach Przemyslaw at: http://www.sunshineprofits.com/help/contact-us/.


