What A Week That Was!


The world has changed significantly over, say, the past 4-5 decades. Many of the logical cause-effect relationships that one could rely on in the past to anticipate future trends and events no longer hold true as we have become accustomed they do. Even worse, some of them have become counter predictive. Much of this inversion of relationships is because the world has been made more complex; what used to be, say, a tight link between changes in the local food supply and the price of food, no longer applies since improved transportation resulted in food being distributed from fertile growing area to all over the region. Unfortunately, such improvements are not the only reason for the breakdown in cause-effect relationships.
Consider the situation of consumer goods in the US; that’s right, those things the BLS monitor so that they can calculate the CPI – the so important inflation index. As in the example of food mentioned above, it used to be that when life was more simple, most of the things people made use of frequently originated not far from where they lived, immaterial whether it was goods or services. Durable larger items were manufactured where it was more economical to do so and then transported to where the buyers lived.
Then, the CPI was relatively stable over quite long periods of time – not because the formula used to calculate the inflation rate was fudged to keep it low and stable, but because the supply-demand relationship was both quite constant and non-complex. Today this has changed. Today, most of the goods we purchase on a month to month or even near day to day basis do not originate near to where we live and work. Most of the items on the shelves where we shop no longer even come from our own countries, but have been transported thousands of miles from where they are made.
A more complex world develops more ways of being disrupted; a “just in time”? credo for manufacturing worked wonders in Japan; used globally, it becomes too fraught with disruptions that have wide ranging effects. Bring on Covid and isolation regulations and the supply lines break down – goods become scarce. Add much government largesse to help families to survive and more money pursues fewer goods and prices rise; no surprise. Inflation is back and the mechanisms that were used to suppress the Big Evil – inflation expectations – can no longer work successfully. The demon is loose!
It used to be that when aspects of the normal functioning economy are under threat, whether from natural or manmade causes that would have some lasting effects, the prices of equities would fall. That is a rational and logical response of investors who pursue a positive return on their investments; so they disinvest when that objective happens to be compromised. That model no longer holds; not because investors have become mental and will keep on buying and buying if they have a positive cash flow – that would not be logical, natural or successful behaviour in the face of known facts.
The model is disrupted because it has become politically and financially essential on a wider scale to ensure that – as is done to inflation expectations – consumer confidence is not to be allowed to decline. When that happens there soon follows hardship for many households and that in turn soon results in different choices at the ballot box. This is what has been happening on Wall Street for some time, with an epic event last week when for the first time in many, many decades it looked as if major global powers were moving into a confrontation that conceivably could escalate to a near world war. Wall Street did react normally, by falling steeply. But as we have seen in 2009, 2018 and in 2020, Wall Street is NOT allowed to become and remain bearish.

On Friday, the CNN chart shows, the DJIA started off in green mode after the futures had shown the way and then with only one early hiccup, moved steadily higher all through the day to end up by 2.5% – before the weekend and the end of the month. The volume of the S&P500 stocks traded was more than the three-month average, which shows that there was sustained selling throughout the day. It has cost a fortune to support Wall Street during the past 6-8 weeks and even on a day when sellers had reason to flood the market, it made no impression on the direction of the trend. This is not normal market behaviour and it really has not been so for some time.
The bond market is supposed to be one of the more professional markets; no room for individual traders to get all emotional and create boom-bust cycles. It is the domain of professional fund managers with a long term view and supposedly also a strong profit motive. Their repeating nightmare is to wake up after having dreamt that real rates of return have become negative. It is something that should also haunt the dreams of all heads of households – to the extent that there are still traditional households!
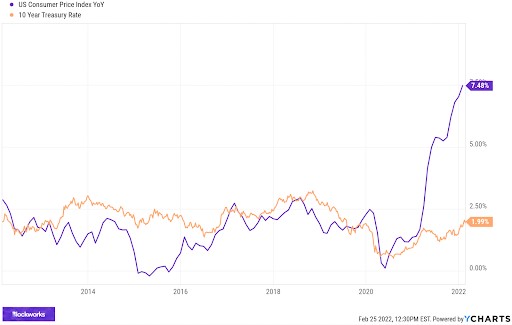
The chart below of the CPI against the yield on the US 10-year treasury note shows how violently the bond market has responded to the non-transitory expectations of higher inflation. Oh, yes, that’s right; there is no response. Can this be that that even fund managers have succumbed to the official campaign that suppresses expectations of higher inflation to the extent that, like most consumers, they lemming-like keep on drifting along; seeing no need to be adequately prepared for double digit inflation.
If we happen to believe Wall Street normally reflects expert expectations about the state of the economy and prospects for corporate earnings anything from 12 to 18 months into the future, then after the brief shock on Monday and Tuesday on the invasion of the Ukraine, investors suddenly realised that the future actually now looks very rosy indeed. On Tuesday after the long weekend the S&P500 dipped 44 points and another 79 on Wednesday, igniting further bearish expectations, as one normally would have expected. Nothing out of the ordinary.
Rampant bearishness had the S&P futures down to about 4220 – down by about 68 points on Wednesday’s close and pointing to a slaughter when the market opened. A wonderful thing happened not too long before the bell rang. As the CNN chart above shows, the market opened up, hesitated briefly and then continued higher to end the day with a gain of nearly 96 points for the S&P500; up by 164 points (4%) from the low in the futures market earlier the day. A true miracle indeed, which convinced a good number of market commentators to predict that the anticipated ‘correction’ is over and the bull market on Wall Street is ready to continue higher!
The technical picture of the S&P500 shows a pattern that confirms an inherent bullish nature of the stock market. Pennants, wedge formations against the main trend, act as continuation patterns. They normally form five legs within the descending wedge of a bull market and then resume the main trend when the price breaks higher from the pennant at the end of leg 5. The daily chart of the S&P500 below shows that such a pennant is developing and it has just completed leg 4 to rebound into leg 5.
While this pattern predicts a continuing bull market, there is a smaller probability that the price could break lower before leg 5 is completed. On the less frequent occasions when such a premature and abnormal break happens, the new trend is more often steep and sustained. The next week or two – or perhaps a day or two? – on Wall Street is going to be interesting; perhaps even in the sense of the Chinese curse.
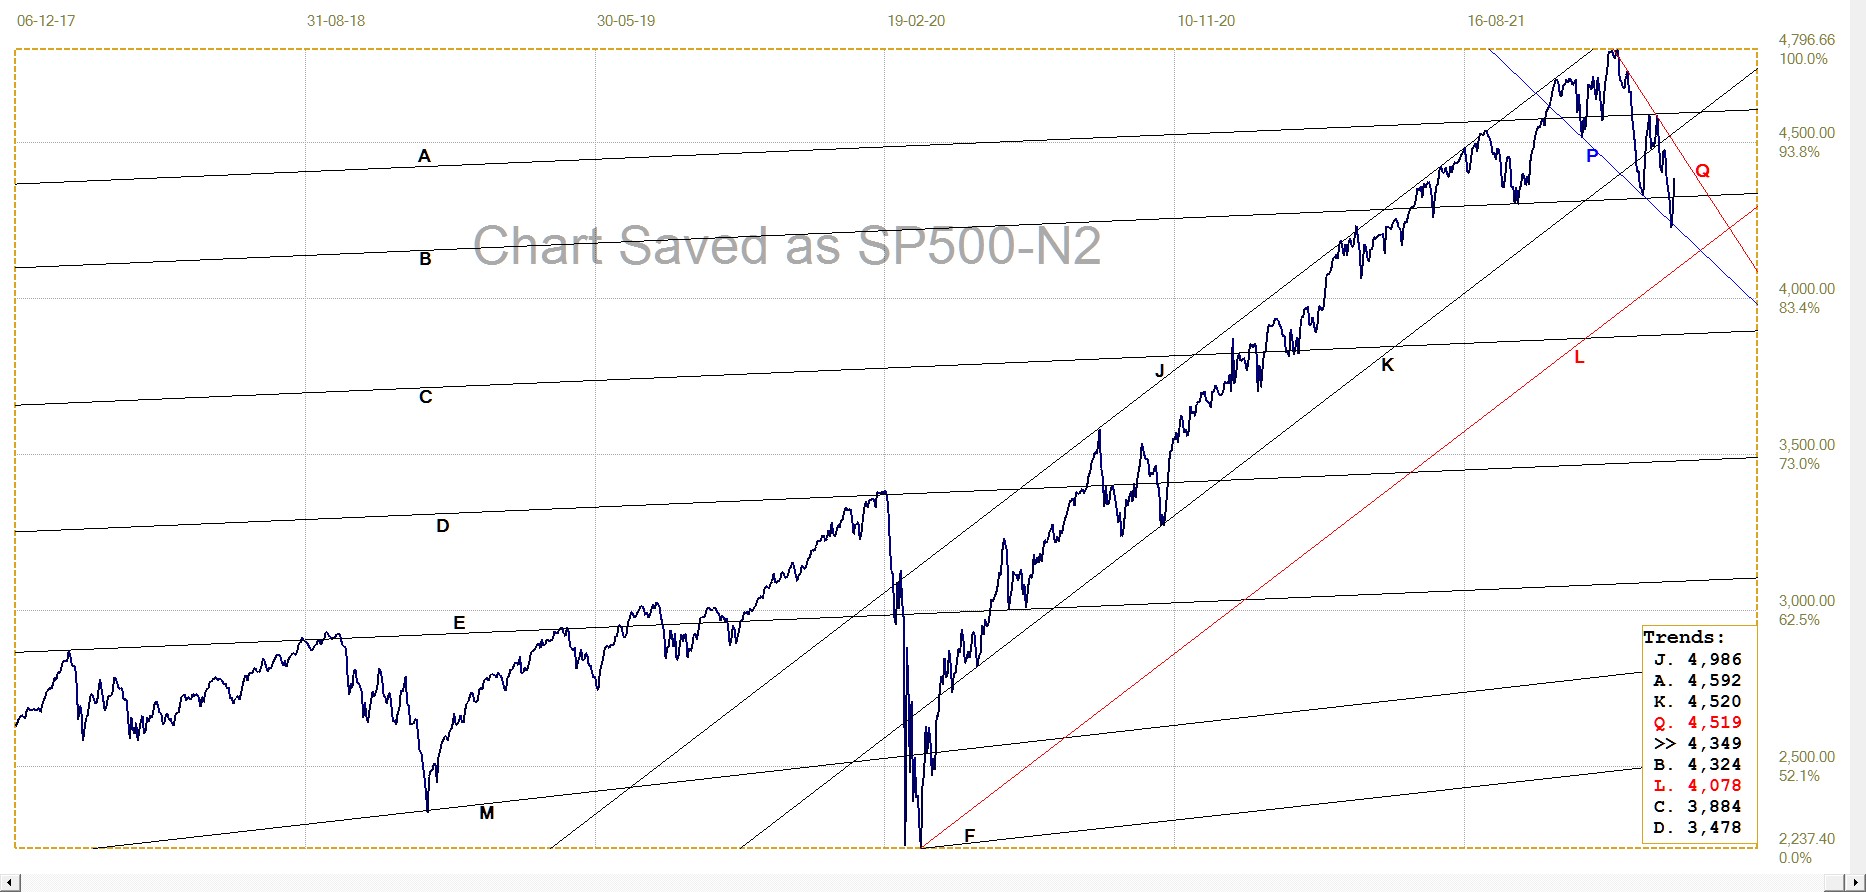
S&P500 index. Daily close. Last = 4384.65
In the gold/silver market we have known for a long time that prices are spurious, a figment of the desires of the Big banks, yet the prices the world accepts as valid and true. Are we all now going to believe that the Wall Street bull is again alive and well so that mass delusion will make it true? I for one do not think so. Unless, of course, the Fed is willing and able to become the majority shareholder on Wall Street.
Euro–dollar. Daily close
Earlier last week, in reaction to an (anticipated) invasion of the Ukraine, the dollar index for a short while spiked higher to above 96, then on Thursday when Wall Street suffered, briefly above 97 settling above 96 as the week ended. This jump caused the euro to decline sharply and also had a negative effect on other markets.
The euro has been trying for quite some time to break above descending resistance of line G, with rare and then only brief success. Now the price has slumped well below that trend line, but it at least has held above the level of its recent low – so far.
Shallow bull channel DE is still intact, but with the recent sideways to lower trend, the steeper bull channel JKL is moving out of easy reach – it would require real weakness on the part of dollar for the euro to get close to line L again. It still appears as if the dollar strengthens when Wall Street comes under pressure of any kind, whether this happens as a direct result of such stock market behaviour or as a covert intervention tactic to help prop up equities, is immaterial. The odds therefore favour a sideways to even lower trend for the euro.
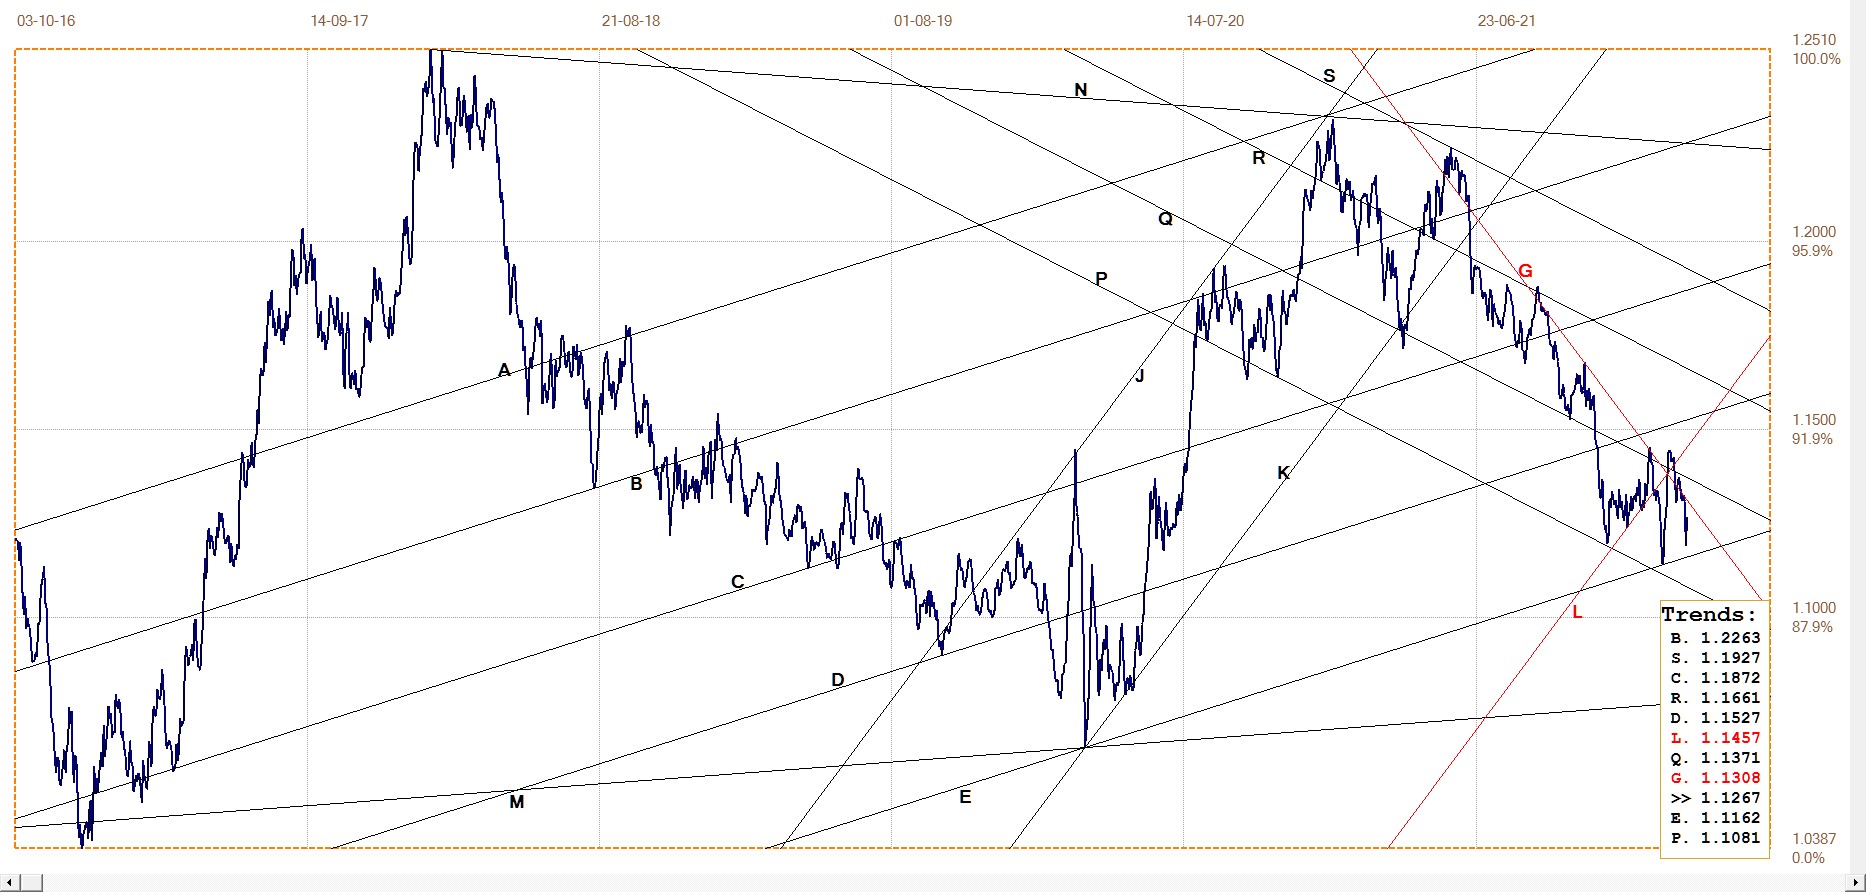
Euro–dollar, last = $1.1267 (www.investing.com)
DJIA daily close
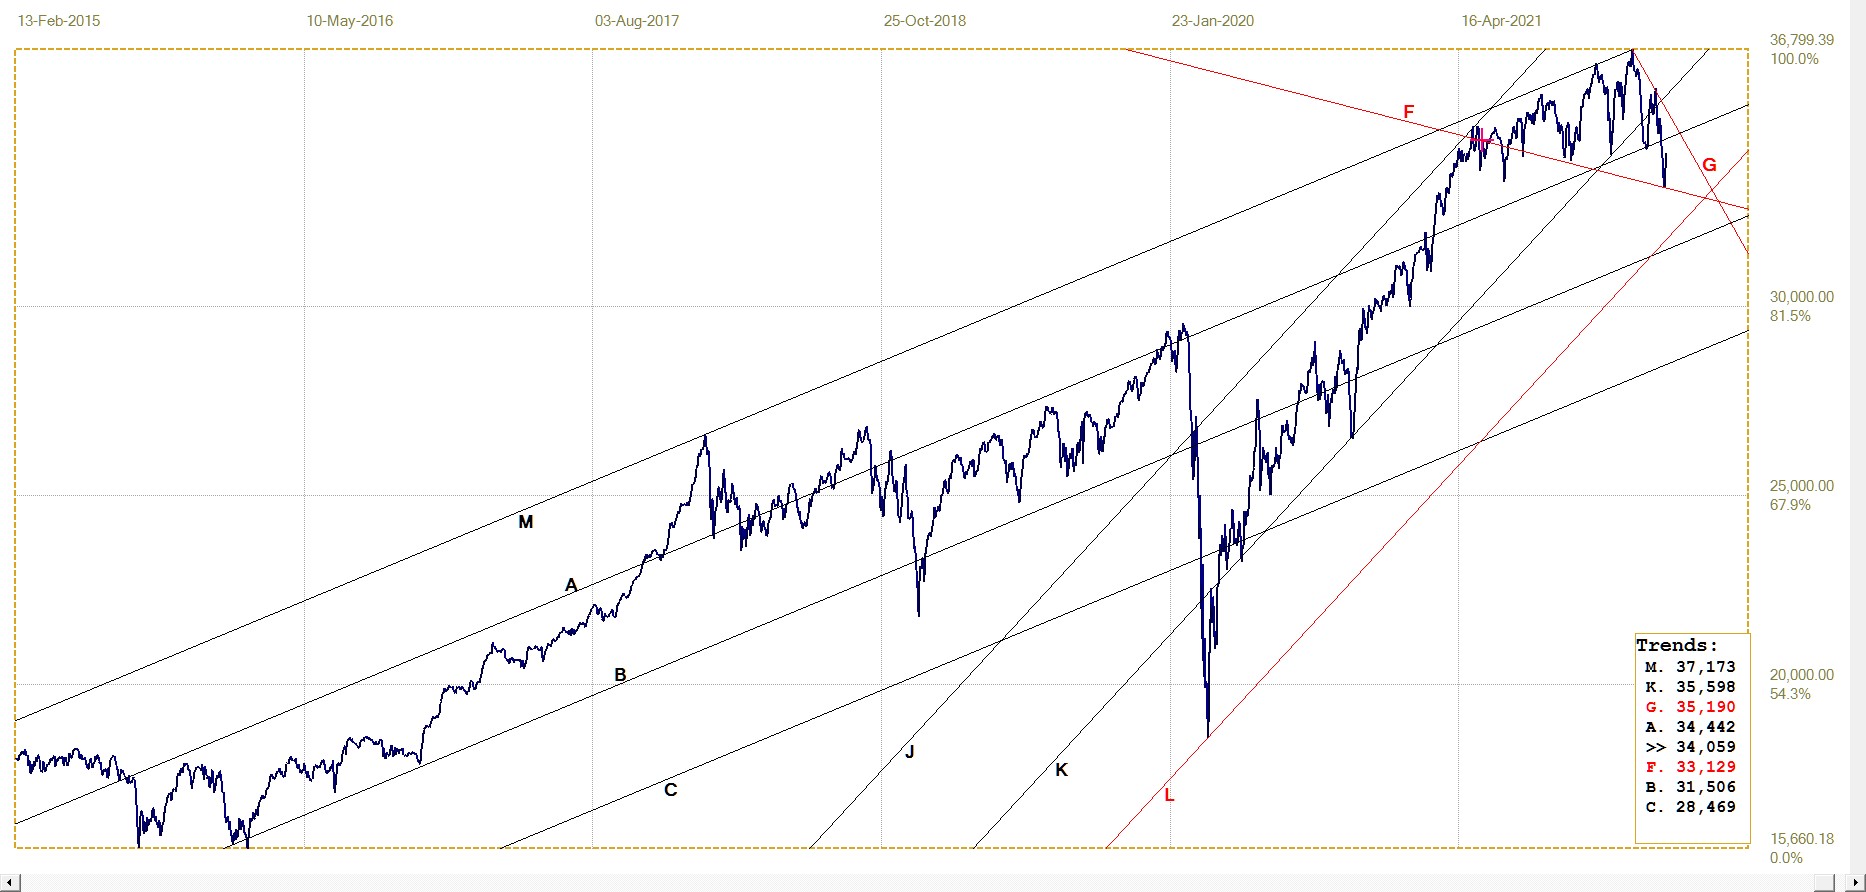
DJIA last = 34058.75 (money.cnn.com)
The chart of the S&P500 discussed earlier has developed a descending wedge-shaped pattern. The DJIA, on the other hand, has formed an expanding triangle or megaphone pattern. These patterns are unstable and develop when two opposing forces – more than the normal supply-demand balance in a market – are involved, each in turn reacting strongly when the opposing force manages to take control of the market trend. The trend then reverses and gains speed to exceed the preceding high or low, as the case might be.
The swings cannot continue indefinitely and sooner or later the scenario favoured by one of the opposing market forces is proven to be correct and the price breaks, usually quite violently, in that preferred direction. One would think in this instance that the market will break bearish, given the fundamentals. However, the Bears have been betting on this for some time now and so far had to sneak back to their caves to lick their financial wounds. The tussle between sellers and support for Wall Street is still far from over.
Gold London PM fix – Dollars
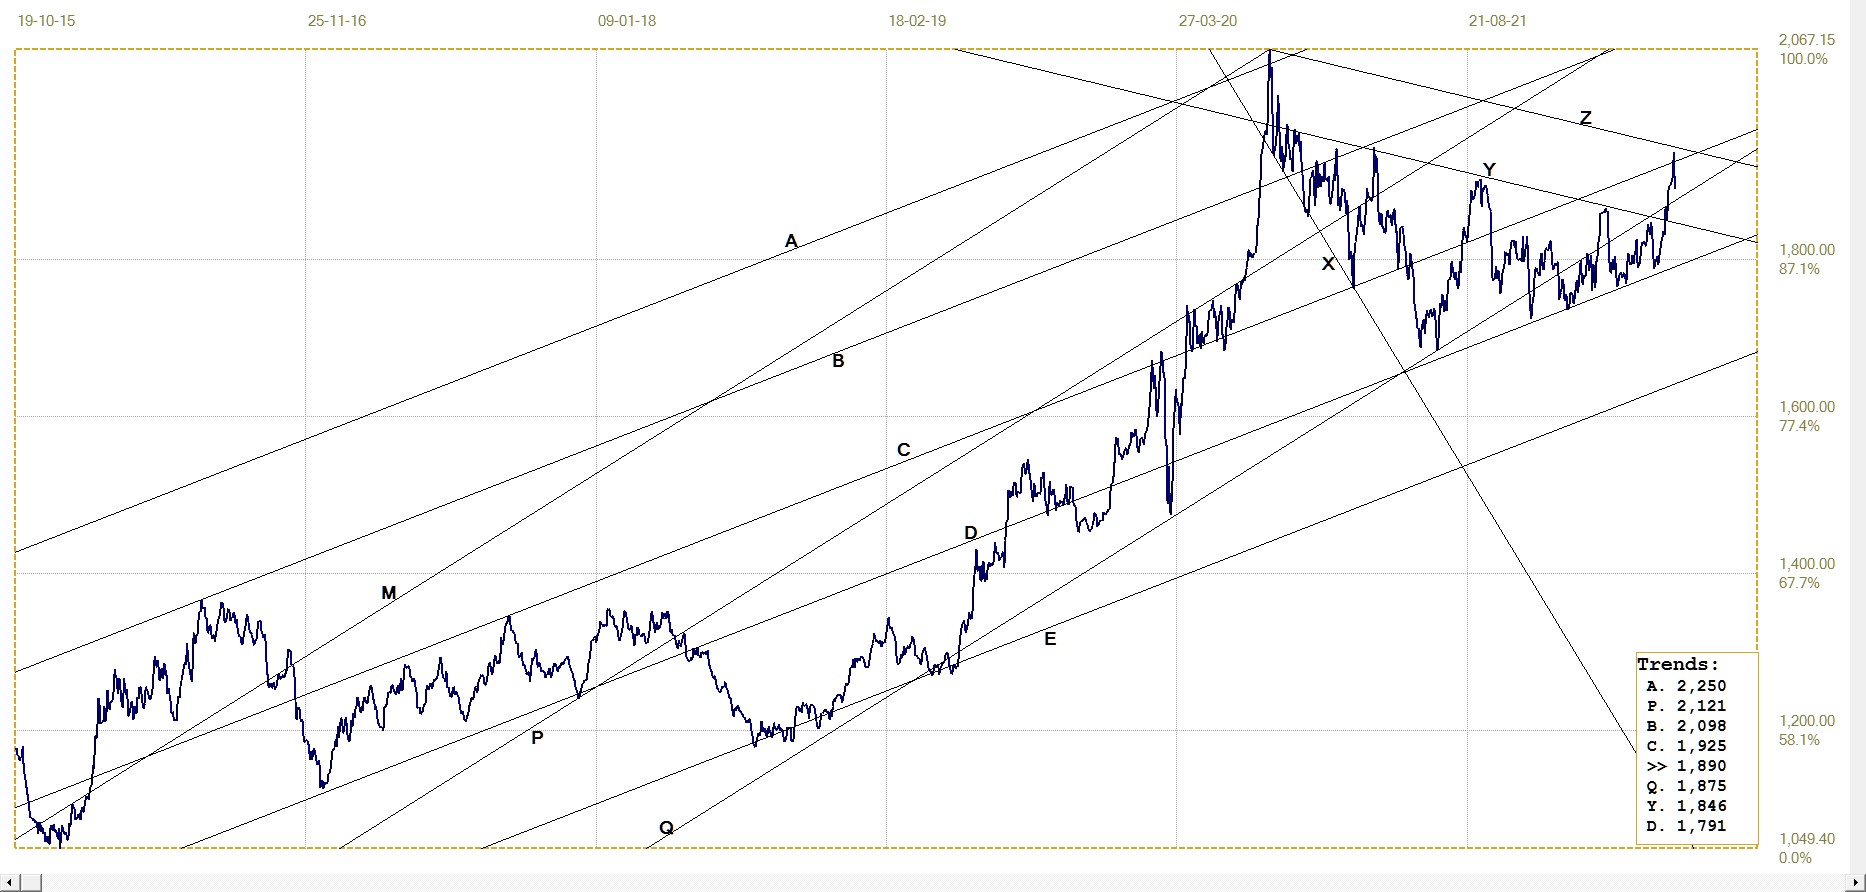
Gold price – London PM fix, last = $1889.80 (www.kitco.com)
The invasion spike to above $1900 last week was fleeting, with the price of gold under renewed attack and back into the $1800s. Yet even with the pull back, it is still quite clear above the erstwhile triangle YD that restricted the price late in 2020.
The gold price also broke back into steep bull channel MPQ and is so far still holding there, despite the regular month end suppression and the extra force being supplied to keep the price from reacting to events in the Ukraine. So far so good; one can hope that the break higher from the triangle will hold and resume the uptrend as the new month takes over.
Euro–gold PM fix
The spike in the euro price of gold last week – almost making a new all time high for gold priced in euro – pulled back more than dollar gold, back into channel YZ. Here, the price of gold in euro, after recovering from a steep drop in late January, is still holding well above its recent bullish trend in channel QR. Month end is also almost done and perhaps March will see the euro price of gold continue its recent trend into the remainder of 2022.
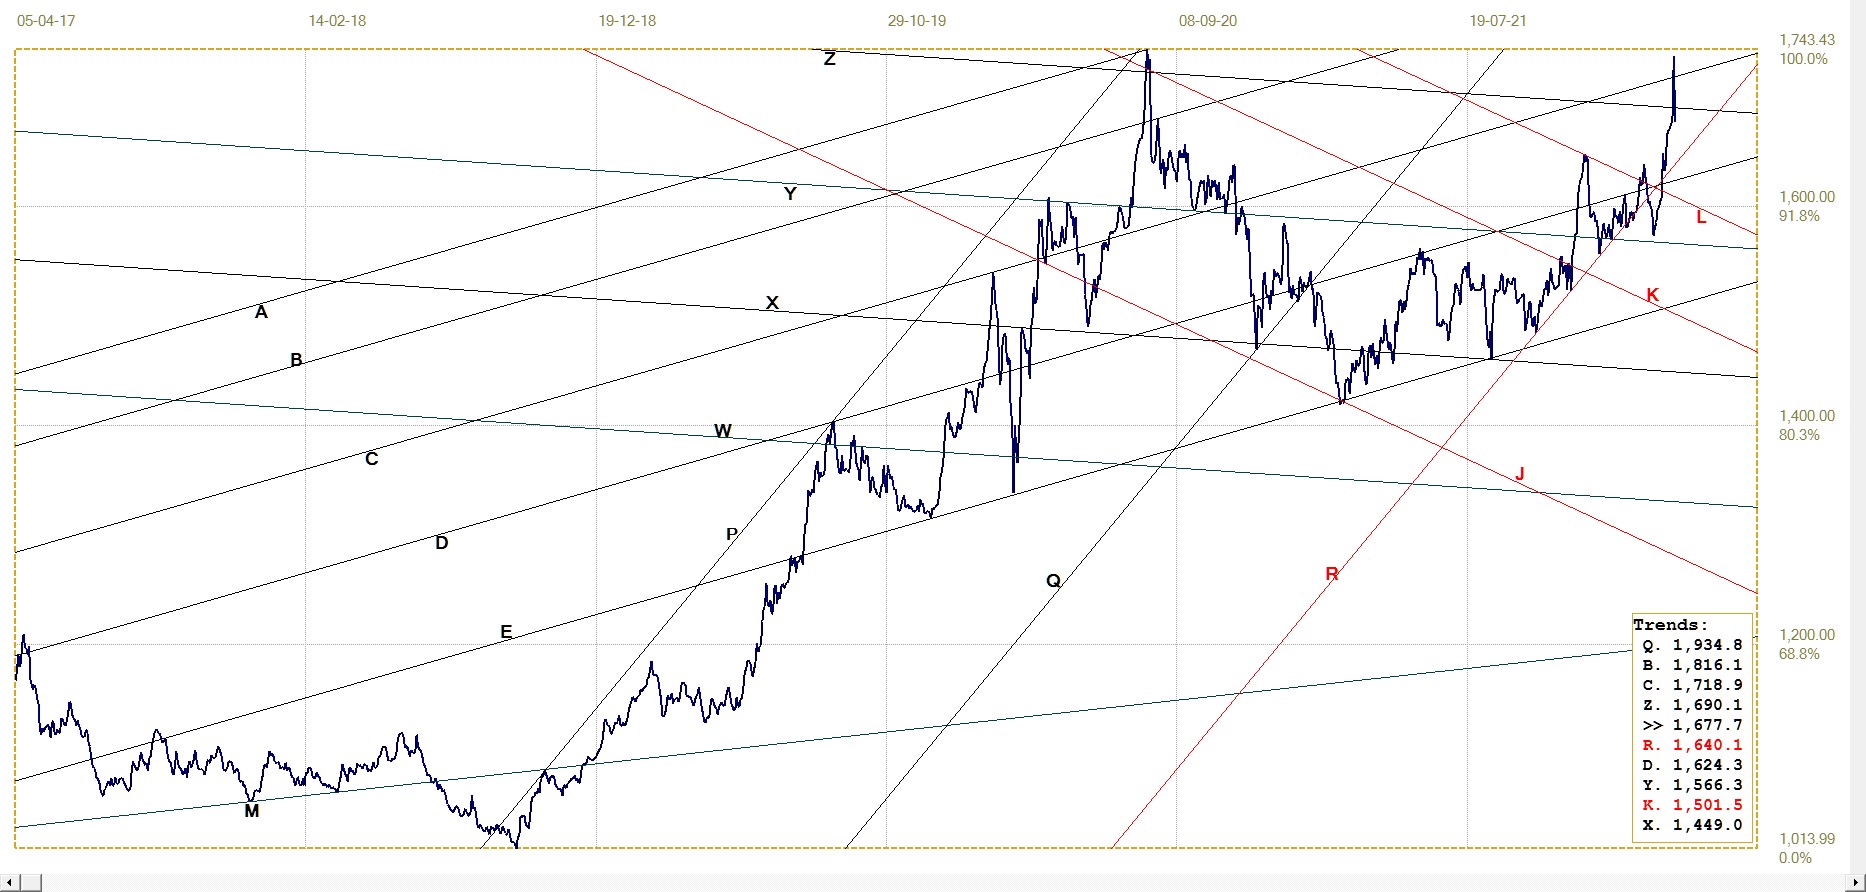
Euro gold price – PM fix in Euro. Last = €1677.66 (www.kitco.com)
Silver Daily London Fix
Silver has also recently shaken itself out of the mostly slow and steady rise in its price to react more strongly to the new international tensions in eastern Europe. The price has been holding in the steeper bull channel JKL for some time, with only one brief break below the support of line L.
On the other hand, one attempt to break higher was soon smothered and the price had to return to the steady trend near line L – except for the one brief break lower. The spike last week broke clear above line Y and into bear channel ST, but the latter break failed to hold through to the Friday London silver fix. It is evident silver remains the big bugbear for the banks and that they are very concerned about the possibility of a steep jump in the price.
Which is bad for the price since it will continue getting special treatment to keep the price under control, but it also is a covert positive, because it implies that there could arise a situation where control is no longer possible so that the price could break loose and skyrocket.
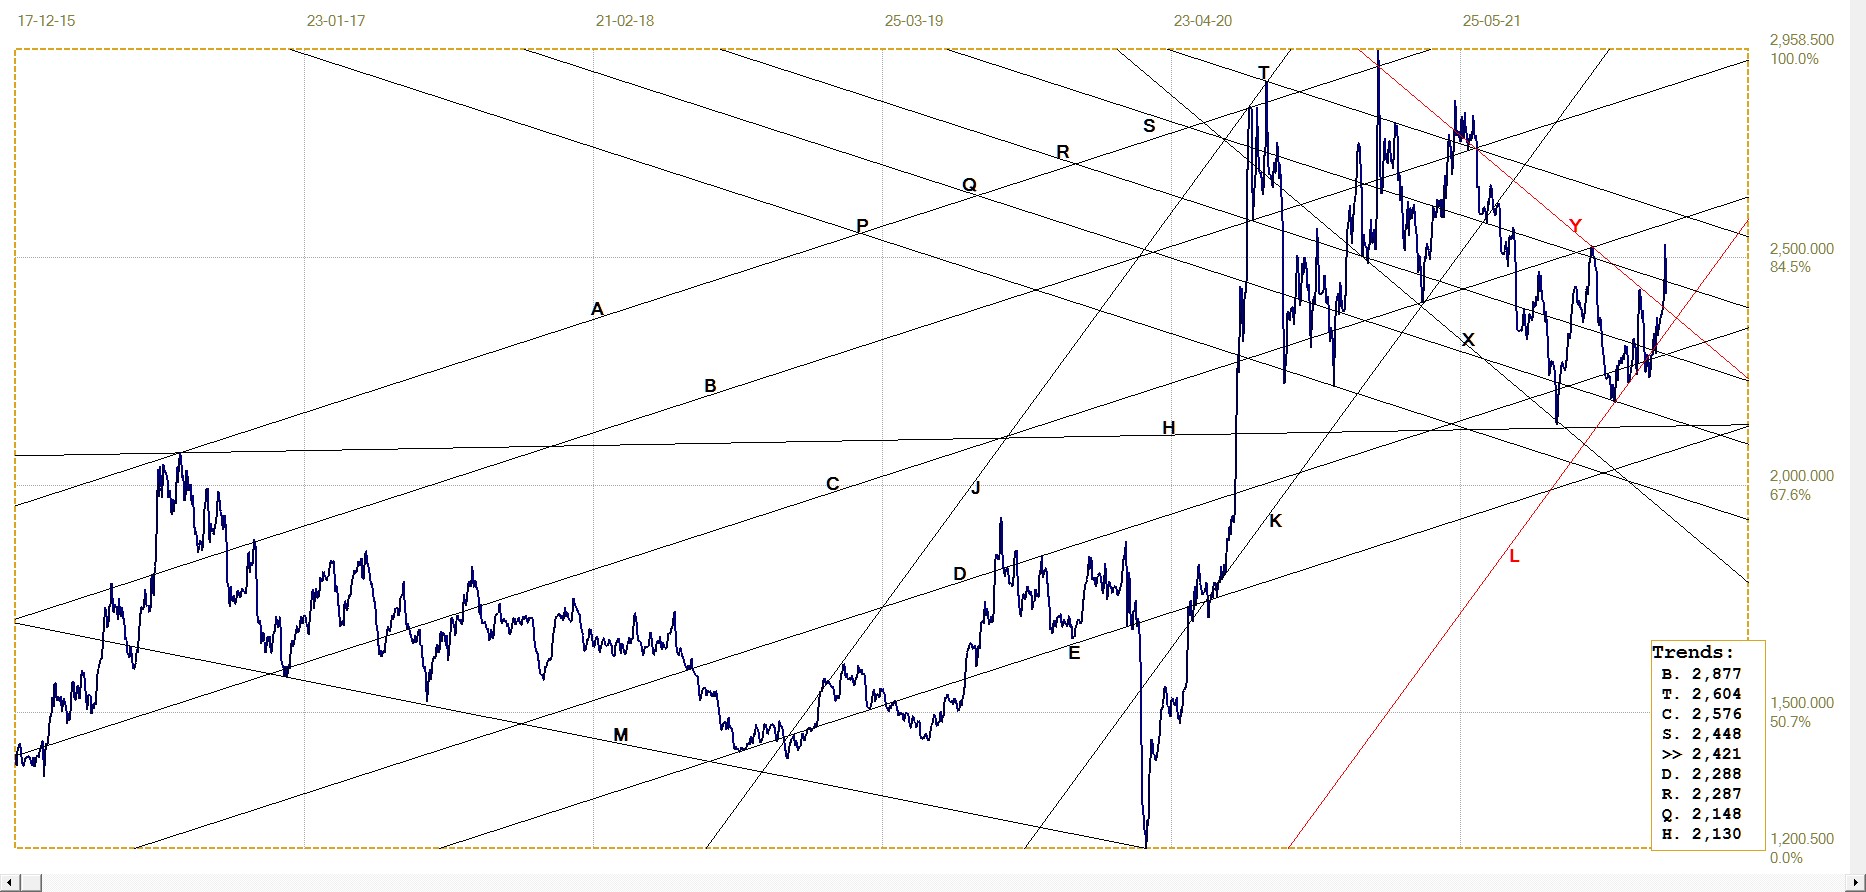
Silver daily London fix, last = $24.21 (www.kitco.com)
U.S. 10–year Treasury Note
10–year Treasury note, last = 1.970% (Investing.com )
The earlier chart of the CPI and the yield on the US 10-year Treasury note in effect says it all. The jump in the rate of inflation – by now accepted by all that it is not transitory over the near term – without a concomitant reaction from the bond market slyly suggests that all is not as right as it ought to be in the capital market.
Can one hazard a guess that the housing market is such an important part of the US economy, as well as normal low interest rates for most households, that the bond market has to submit to equal treatment with gold and silver – price suppression? In fact, I think that many objective observers of the markets will think one is hopelessly naive to even ask such a question.
The real question is not which markets are being subjected to covert meddling, but which markets might stand a chance of not suffering from intervention?
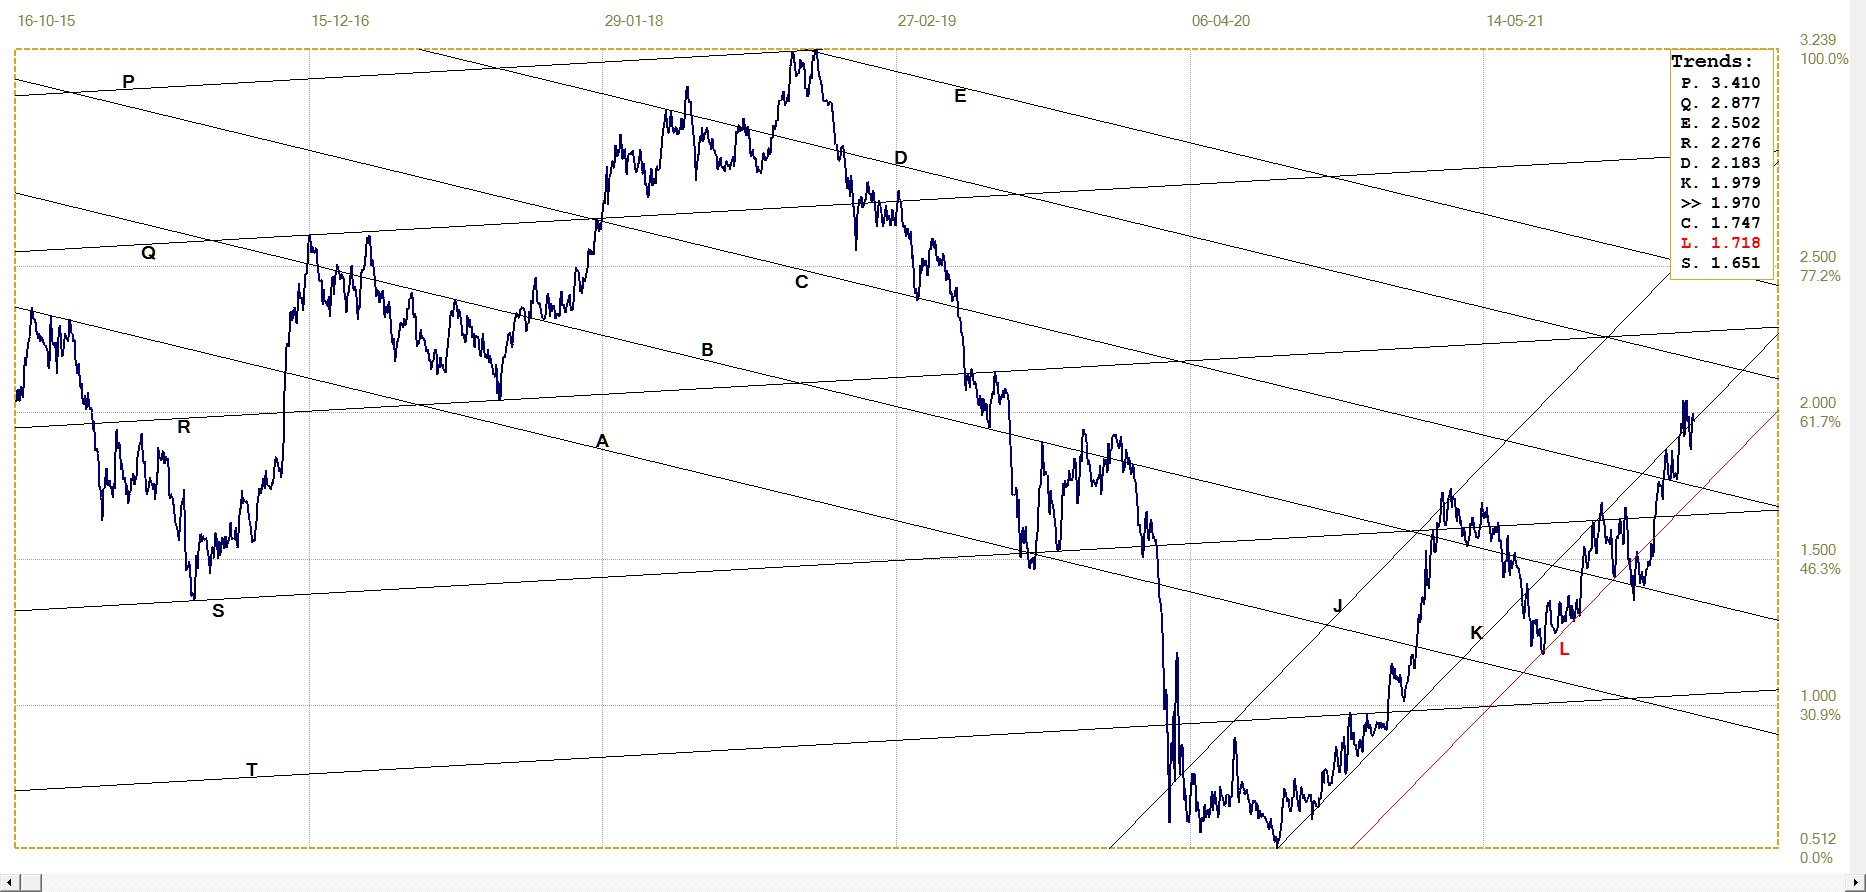
West Texas Intermediate crude. Daily close
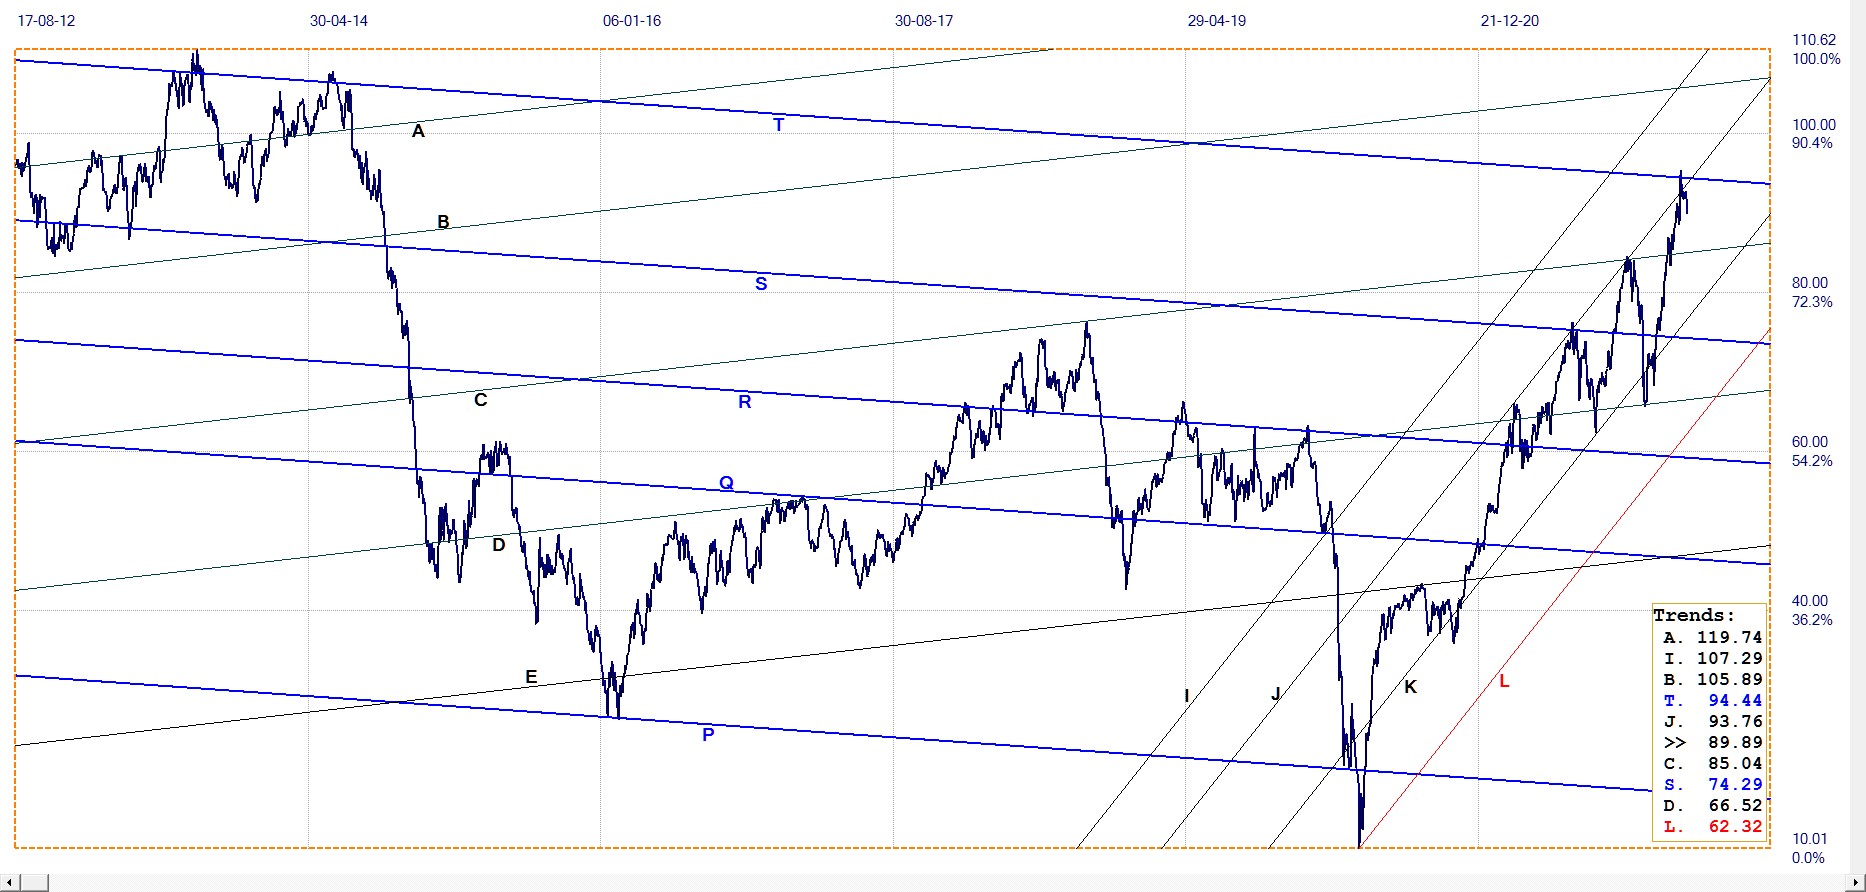
WTI crude – Daily close, last = $89.89 (www.investing.com)
Crude oil, of which the price forms the base of a large economic pyramid with major inflationary potential, has been stuck below line T for some days now – despite the threat that US sanctions on Russia might deprive the US of a source of oil that would incur additional costs to replace. The price of oil by rational logic should have jumped on news of the invasion and threat of more war. That it did not, suggests that crude oil has joined a club that consists of at least Wall Street, interest rates, gold and silver.
©2022 daan joubert
********


