What's Next For Gold And U.S. Stocks?
 share
share
 share
share
 share
share
 share
share
 share
share
 Recapping Last week
Last week's trading saw gold forming its low in Wednesday's session, here doing so with the tag of the 1916.20 figure. From there, a good rally was seen into later in the week, with the metal hitting a late-Friday high of 1952.20 - before backing slightly off the same into the daily/weekly close.
U.S. Stock Market, Short-Term
As mentioned in my last article, the downward phase of the 10 and 20-day cycles was deemed to be in force in the U.S. stock market. The last peak for these waves was made back on March 29th, which we had as a key turn date for this market. Here is the larger of these waves, the 20-day cycle component:
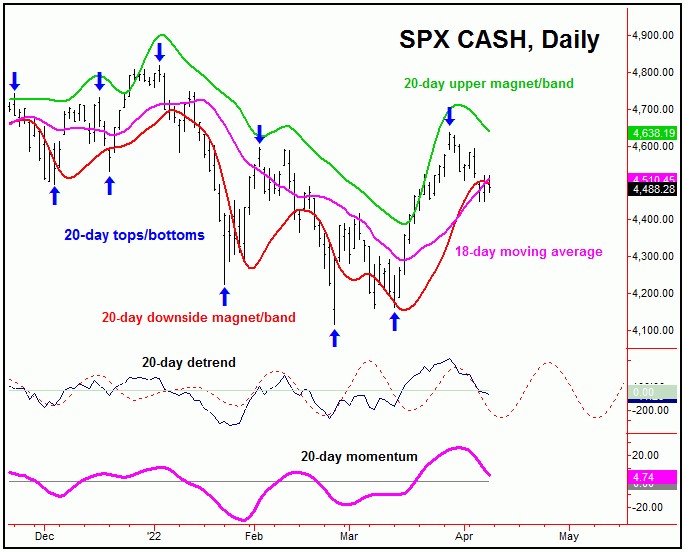
From last weekend: "in our daily Market Turns report (which covers the U.S. stock market), we noted the 9-day moving average as the expected price magnet to the recent decline, which has been satisfied with the action into late last week. Having said that, a drop on down for a tag of the lower 18-day moving average would be ideal, due to the position of the larger 20-day cycle."
As mentioned last weekend, our ideal path called for continued weakness in the U.S. stock market (as measured by the S&P 500, or 'SPX'), with the 18-day moving average acting as the favored downside magnet to price. Thus, with the decline seen into late last week, this assumption has now been met.
Going further with the above, from the March 29 peak, it was the March 31st reversal below the 4578.16 SPX CASH figure which actually confirmed the correction phase of the 10 and 20-day waves to be back in force. From the break below this downside reversal point, the index has fallen another 128 points into the most recent swing low.
With the above said and noted, we are on the lookout for the next short-term low for the SPX, with a key turn date just around the corner - which we anticipate will end up as the bottom for these 10 and 20-day waves. In terms of patterns, the current decline is favored to end up as a countertrend affair.
We have a current upside price reversal level for the next upward phase, which - when taken out to the upside - should signal the low for the current swing down to be set in place, with exact details always noted in our daily Market Turns report.
Gold Cycle Update
From the comments made in past articles, the last peak of significance came from the 72-day cycle for gold, which is shown again on the chart below:
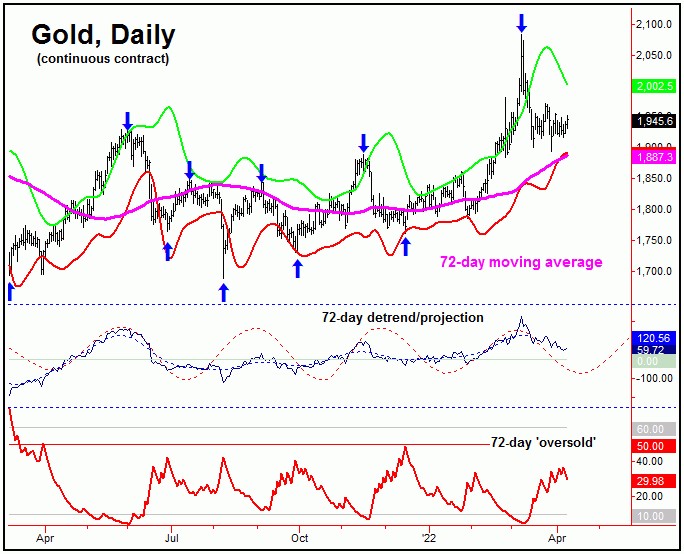
In terms of time, as mentioned in prior articles, this 72-day cycle had been seen as pushing lower into the mid-April region, plus or minus - where its next bottom should try and form.
Until proven otherwise, the overall assumption is that the downward phase of this cycle is still intact, with that path looking for an eventual drop back to the 72-day moving average and/or the lower 72-day cycle band in the days/weeks ahead.
In terms of technical action, for a good-looking 72-day trough, I would like to see a drop down to our lower 72-day cycle band, along with a spike above the upper reference line for our 72-day 'oversold' indicator. This is a pattern normally seen near low for this particular component, though it does not always occur.
Should the above technical pattern be seen going forward for gold, I would be looking to re-enter the long side, in the anticipation of a sharp rally playing out in the weeks/months to follow. That rally would ideally hold up into mid-Summer of this year - before topping a larger-degree 310-day cycle that we also track. More on the bigger picture assessment as we continue to move forward.
Jim Curry
The Gold Wave Trader
http://goldwavetrader.com
http://cyclewave.homestead.com
********
share
share
share
share
share


