When Gold Turns, The Move Up Will Be Dramatic


Last week's trading saw the gold market flipping recent patterns, here forming its low for the week with Monday's tag of the 1673.30 figure (April, 2021 contract). From there, a sharp rally was seen into later in the week, with the metal pushing all the way up to a Thursday high of 1738.00 - before backing off the same to end the week.
Gold Trader Apathy
As I mentioned in a prior article, I have rarely seen such apathy from gold traders as has been seen in recent weeks. This action is setting the stage for a larger-degree low for the metal, one that is in the process of forming - with at least some potential that it could come even earlier than expected.
If and when the next mid-term low for gold is seen, a multi-month rally is expected to unfold - one which should be dramatic - easily giving way to the largest percentage rally of this year. That action will set the stage for what we believe will be a major top that forms sometime between late-2021 and the Spring of 2022.
The next major rally should from one of the largest cycles that we track, the 310-day wave, which is shown again on the chart below:
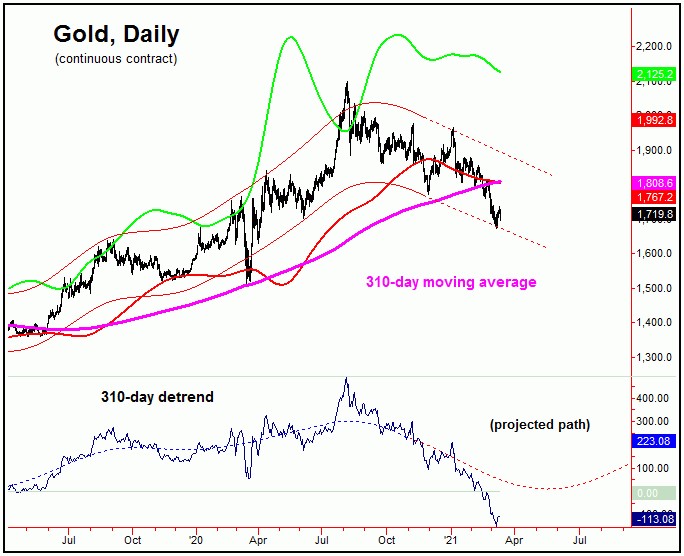
On our 310-day chart, we can see our detrend's projection for a low - which is due around the late-April to mid-May timeframe. The wide plus or minus variance is simply due to the size of this component (i.e., approximately 15-16 months, from trough-to-trough). Cycles rarely bottom right on schedule, and this timeframe is simply a best estimate of when the next 310-day bottom is due.
With the above said and noted, we have to resort to other methods to confirm when a low forms with our 310-day wave. For that, we use upside price 'reversal points', which are exact levels, which - when taken out to the upside - will give 90%-or-better odds that the cycle itself has turned.
With that, gold (April, 2021 contract) would currently require a reversal back above the 1970.30 figure to confirm the next trough for our 310-day wave to be set in place. Having said that, this number will always come down as price action unfolds, and with that we expect it to drop sharply going forward, depending on the action, with the most current numbers always noted in our Gold Wave Trader market report.
Going further with the above, there are some additional observations to be made in regards to our 310-day cycle. Take a look again at our 310-day chart:
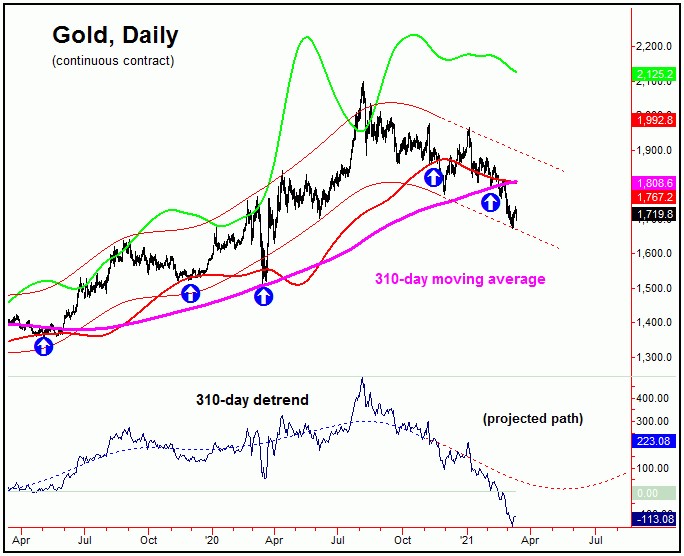
On this chart, of particular note is that our 310-day moving average is still rising - which tells us that the sum of the cycles larger than the 310-day wave (i.e., four-year, 8-year, etc.) are still seen as heading higher. This is a bullish indication for the longer-term, and supports the idea of a major rally, following the completion of our next 310-day trough.
Going further with the above, the blue (circled) arrows on this chart show points where a drop below our (red) 310-day cycle band has been seen. These are normally excellent points to add to the long side, though, in doing so, you will nearly always be buying early. Depending on what type of trader you are, you will always be either buying early - or buying late - as buying the actual bottom is a near impossibility.
Going even further, if we bring our 310-day chart closer, we can see that we are sitting right on our lower 310-day extrapolated channel line. Take a look:
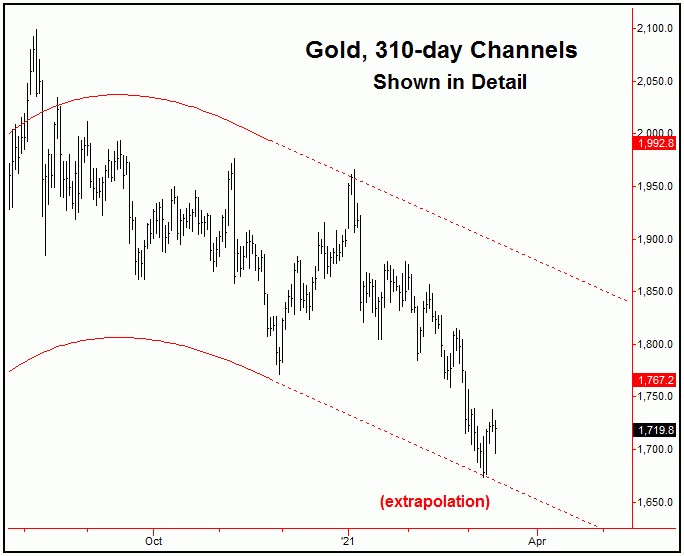
The bottom of the 310-day channel is often a spot where violent short-term rallies will be seen, with the last one coming off the late-November, 2020 trough. Conversely, rallies will tend to stall out near the top of the extrapolated upper channel line.
For the very short-term, as mentioned in my article last weekend, we are expecting a sharp rally to play out in the days/weeks ahead, coming from the smaller-degree cycles that we track. Possibly, this rally is already in force - which we are close to confirming.
U.S. Stock Market
As mentioned in past weeks, U.S. stocks were expected to see a correction back to the 70-day moving average or lower on the SPX, which did materialize into the March 4th bottom. Take a look at our next chart:
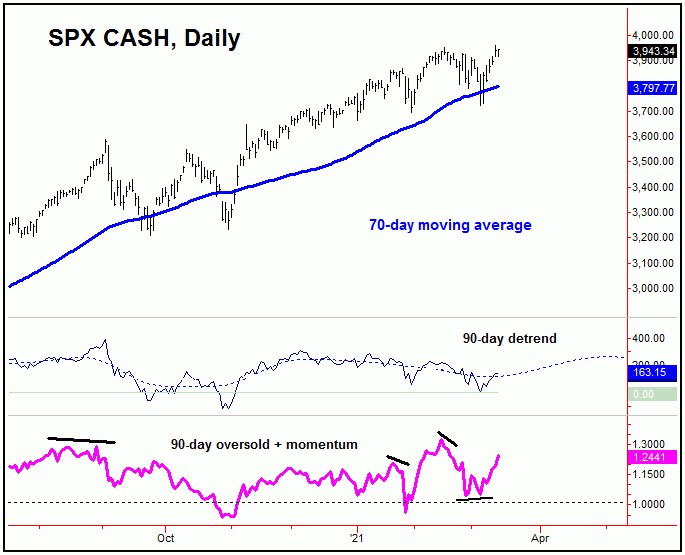
In terms of patterns, our expectation called for a drop back to the 70-day moving average on the recent correction - with that move favored to remain above the late- January trough of 3694.12 on the SPX, which was seen. Following a countertrend decline, the expectation was for a push back to new all-time highs for the bigger swing in the coming months - before setting up the next larger-degree peak.
As mentioned last weekend, there was a rare signal generated for U.S. stocks, which is our SPX/VIX bottoming pattern - and which is shown again on the chart below:
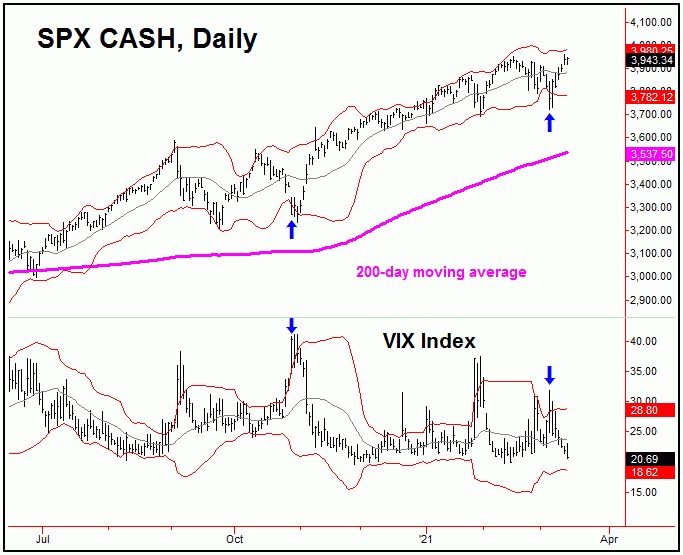
The SPX/VIX bottoming pattern is a rare one, one which will often appear at or near market bottoms, within a larger uptrend. This particular setup occurs when the SPX closes below it’s daily Bollinger band, and - on the very same day - the VIX index closes above it’s own daily Bollinger band. The blue arrows highlight the most recent instances of this pattern, which, as can be seen, occurred at or near key market bottoms.
With the above, the SPX has already rallied back to make new all-time highs for the bigger swing, though technicals are diverging again against this new high - and thus another sharp, short-term pullback would not be out of the question. Having said that, overall, we are expecting the larger uptrend to remain intact in the coming months, before setting up the next mid-term peak - which we think will be followed by the largest percentage correction of this year. Stay tuned.
Jim Curry
The Gold Wave Trader
http://goldwavetrader.com/
http://cyclewave.homestead.com/
More from Gold-Eagle


