When will the Real Estate Bubble Pop? Morgan Stanley REIT index Speaks


Everyone wants to know, "When will the real estate bubble finally burst?" The answer to that question is at once simple and complex: "It breaks when it breaks!" Calling the exact peak of a market bubble-whether stock, commodity, or real estate-is an extremely dangerous game and nine times out of 10 will make the person who attempts to predict it into a fool. Remember, bubbles are created by "irrational exuberance" as Alan Greenspan put it so well back in the '90s. As such, they are not governed by any measurable laws, nor are they reasonable. Therefore, any attempt at predicting their end cannot be done using reason or logic; it's pure guesswork.
That being said, the closest thing to a crystal ball we have is the equities market, which typically discounts the future of the major economic sectors it represents several weeks or months in advance. The absolute best way of gaining insight into when approximately real estate prices will finally peak is found in its stock market equivalent-the real estate investment trusts (REITs). If you pull up a chart of the Morgan Stanley REIT (RMS) index (probably the best chart to use for plotting the overall real estate equity sector), you'll see what we mean as a most interesting pattern emerges. We believe it holds the key to exactly how much time is left for real estate prices to run their course. Study the daily chart of RMS below.
Now what makes this particular chart easy to analyze is that the trendline parameters are so clear. There are really only two major trendlines in the daily chart over the past half year period: an uptrend line and a downtrend line. As RMS is right at the "decision point" of its trendlines, the next short-term trend in real estate equities is about to be signaled, and on a preliminary basis may already have been!
The downtrend line in RMS can be drawn off the early July peak down to the late September lows beneath 435. This 3-month trendline has remained intact the entire time. Corresponding with this important downtrend line are the 30-day and 60-day moving averages, which are currently intersecting between the 430-435 area of the chart. The RMS most recently closed at 427. Also worth noting: the 20-day and 40-day moving averages currently intersect at 435. This makes 435 a major overhead resistance and if the RMS closes above this level it will strongly suggest a new short-term uptrend has begun. On the other hand, a 10-week uptrend line currently intersect RMS at basis 428.50 and was broken on Monday. RMS closed near the top of its intraday trading range on Monday but still beneath the trendline. Another couple of downside closes will be enough to signal that a new downtrend has begun. A case could easily be made that a bearish head-and-shoulders pattern has etched out over the past two months between 420-440. Since the "neckline" of this potential pattern is at 420, if RMS plunges beneath this level the minimum downside measurement projects to 390-400; in other words, a test of the late July lows. Right now we'd say the odds favor the downside scenario.
One other very important consideration worth noting: the long-term weekly chart of RMS shows a steady and unbroken uptrend line over the past three years. As of this week, RMS is precisely testing this extremely important trendline. This trendline also corresponds exactly with the equally important 60-week moving average (60-week, not 60-day), both currently at 425. The 60-week moving average is the half cycle of the dominant trading cycle, making it perhaps the single most important moving average for traders. If RMS closes at least 3% below 425 it will signal a break of the 3-year uptrend and will give us the best sign possible that another irrational bubble is about to burst.
A major factor fueling the current real estate bubble is extremely low interest rates. The unusually low rates-a product of K-wave runaway deflation-have stimulated the debt finance binge that we are just now witnessing the final stage of. Despite the debt binge and consequent crash in equities over the past 2-3 years, and notwithstanding countless business and personal bankruptcies, America has still not learned her lesson about the evils of debt. The word debt is a derivative of the word "death" in the Latin tongue, and before America's 30-year experiment with debt is over it will surely mean the death of America. No country has ever outlived its economy and once the final air pocket holding up the U.S. economy (real estate) collapses it will signal the end of America as we have known it. From its ashes a new government and a new economy will arise. (Exactly what character this "new" government/economy will take we leave for the reader to surmise.)
When interest rates, which are best measured by government treasury bonds, bottom there will be even greater pressure on the home lending boom and real estate bubble. The falling interest rate trend (and concomitant bond price crescendo) holds the key.
As Harry Schultz aptly puts it, "The bond market may be the world's Achilles' Heel. If it falls, as I feel sure it will in due course, meaning interest rates rise, it will not only pop the property bubble, but more importantly, trigger the far-bigger derivative bubble in interest rates." Millions are being spent by insiders and the government to prevent a bond collapse and further stock market crash, but as Mr. Schultz asserts, "the inevitable can't be stopped. Debt and leverage are too massive."
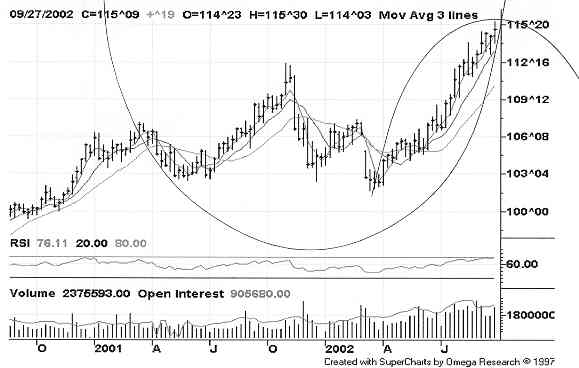
How far along the interest rate curve? Check out the weekly 10-year T-Note chart abve. Prices have gone parabolic and look to be nearing the end of the ride, as the intersection between the dome and bowl strongly suggests. We're about to get a lesson in what happens when artificial price support (e.g., government/central bank manipulation) meets up with the unstoppable counter waves of market forces. The result won't be pretty.


