While The Bulls Fiddle With The 'Fundamentals,' Rome Burns
 share
share
 share
share
 share
share
 share
share
 share
share
In the past, I have outlined why fundamentals look best at market highs, and worst at market lows. And, just like we normally experience, as we were soaring over 2900, I am sure many of you were convinced that this was one of the best economies we have seen in quite some time. But, we seem to have topped on those great expectations.
As the market continued to chop around near the lows this past week, I saw an article entitled “The Steep Stock Market Sell-off Does Not Make Sense.” Within that article, the author highlights the fact that earnings growth remains healthy, the economy continues to grow, and that equity valuation are at the lower end of their historical range.
So, when the market fundamentals look best to those who follow this type of data, it would not make sense to them that the market would sell off when the economy looks so good. In other words, when the fundamentals were looking so good at the market highs, this analyst was unable to understand why the market would drop 10% as it did.
This is no different than the comment I saw in an article recently that “[t]he current fundamental trend doesn't support this (bearish) scenario." Or, how about this comment I also recently saw: “I own many stocks with great fundamentals, but it is being ignored at present.”
Another recent example is seen in a MarketWatch article which was entitled “The stock market is overreacting because fears about the economy are overblown.”
Consider how many times have you heard pundits on television comment that the "market is just not trading based upon fundamentals at this time." The conclusion these authors and the commenters come to is that the market must be wrong rather than considering that the fundamentals may be lagging.
So, rather than question the underlying premise to their expectations, they simply assume the market is wrong. And, what is really funny is that I remember how some were giving me the exact same arguments when we were down in the 1800 region in 2016 and I was calling for a rally over 2600. The difference was, at that time, I was told that the fundamentals did not support a rally to 2600 or higher.
In the past, I have outlined why the market works in this way, and why fundamentals will always lag market sentiment, as well as the stock market trend changes. If you are interested, feel free to read this article here.
I think Bernard Baruch summed this perspective up quite well:
“All economic movements, by their very nature, are motivated by crowd psychology. Without due recognition of crowd-thinking ... our theories of economics leave much to be desired. ... It has always seemed to me that the periodic madness which afflicts mankind must reflect some deeply rooted trait in human nature — a trait akin to the force that motivates the migration of birds or the rush of lemmings to the sea ... It is a force wholly impalpable ... yet, knowledge of it is necessary to right judgments on passing events.”
When viewing most analysis that does not take sentiment into account, I would suggest it falls within three categories. The first category consists of perma-bulls. These are analysts who are always bullish of whatever market they track. The second category consists of perma-bears. These are analysts that are always bearish of whatever market they track. My opinion is that anyone who is a perma-anything should be summarily ignored since they are unable to see the true risks to their perspective. They are effectively no better than broken clocks.
The rest basically fall into the category of trend followers. These are analysts that will stay with the trend, and will assume the trend will continue unabated . . . until it does not. This is effectively the general view of a market fundamentalist. Market fundamentals are the existing conditions of a market based upon historical data. In order to utilize this information for predictive purposes, economists and analysts will usually employ a form of trend extrapolation. This effectively presumes that the current market conditions will continue indefinitely into the future, until they do not.
Based upon the point in time you read one of these analysts, you will recognize their absolute brilliance (or absolute failure). You see, if the market is heading up strongly, the trend followers will seem quite prescient, along with the perma-bulls. Should the market be dropping in a strong trend, then the perma-bears and trend followers will seem quite brilliant.
Yet, at the turns, only those who have been perma-bulls or perma-bears will be “respected” for their brilliance because the trend followers will have been caught off guard when the market reverses the trend they expected to continue unabated. Yet, I think it is clear to all that a bullish trend which then reverses really does not suggest a perma-bear is brilliant, but, more likely akin to a broken clock. So, at trend changes, there really are very few who are truly prescient.
But, is there something that can assist you in knowing which camp to join and when? That is where market sentiment comes in. When market sentiment is not at an extreme point, and there is a trend to follow, then you have it rather easy. However, when market sentiment reaches an extreme, that is time to move out of the trend followers camp, as you will likely see a trend change. When you understand the market from this rather simple perspective, it makes investing or trading much easier and more profitable. This is exactly what Bernard Baruch was suggesting in his quote above. And, this is what we did when we stopped out of our long positions when the market broke 2880SPX.
At the end of the day, my point in this article is that you must take into account market sentiment to know when to be prepared for the market trend to change.
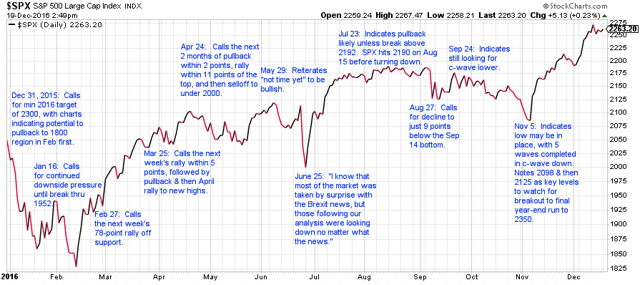
For example, as you can see from the attached chart summarizing our analysis in 2015 and 2016, when the market was up in the 2100 region in 2015, we were looking for a trend change back down to the 1750-1800 region. At the time, we assumed it would only be a corrective pullback to set us up for higher levels. We then expected that the market would rally from the 1800 region to the 2600+ region. This is what our market sentiment analysis told us, and pretty much hit the nail on the head.
While tracking market sentiment does provide for accurate targeting the great majority of the time, and we often hit our targets, almost to the penny, in the minority of times the market will come up a bit short of our targets. This why we need to also know when to bail on the trend. And, as I noted before the market dropped 10%, if we broke 2880SPX, then the upside trend was clearly in jeopardy, and we had strong potential to drop in an initiation downside move to the 2600 region. As we also now know, before we “bounced,” the low we struck on the decline off the September high was 2603.
The reason we are able to identify targets rather accurately is because market sentiment is basically driven by human beings. And, like all other creations, the progression and regression of human actions and thought follow the natural law (as alluded to by Mr. Baruch above), which is governed by Fibonacci mathematics. Therefore, we utilize Fibonacci mathematics to identify our targets in both the short term and the long term. It works well for both time frames, despite the common belief to the contrary.
As Mr. Baruch noted, “[without due recognition of crowd-thinking ... our theories of economics leave much to be desired.” Therefore, I would strongly suggest investors include some component of tracking market sentiment when making their investment or trading decisions.
To that end, our sentiment analysis suggests that we will likely be stuck in this corrective environment for some time going into 2019. While I still think that a larger degree rally can be seen once the initial leg of this correction completes in the coming weeks/months, and that rally may even strike the 3011 target we failed to strike in the primary trend, the ideal target for a correction of this degree resides in the 2100/2200 region in the SPX. So, that remains my target for the larger degree correction, which means I expect a lot of volatility in 2019.
In the meantime, I may be looking to buy long positions once the initial stage of this correction completes in the 2450/2480 region, from where we may see an intermediate term rally in 2019 before the bigger decline takes hold to 2100/2200. But, I would need a 5-wave structure to complete into that support to strongly consider entering those long positions.
share
share
share
share
share
 Avi Gilburt is a widely followed Elliott Wave technical analyst and author of ElliottWaveTrader.net, a live Trading Room featuring his intraday market analysis (including emini S&P500, metals, oil, USD & VXX), interactive member-analyst forum, and detailed library of Elliott Wave education. You can contact Avi at: [email protected].
More from Gold-Eagle


