Why is Gold Going Up?


Inflation, currency depreciation, wars and terrorism, credit bubble, deficits, India, China…….list goes on and on, for those who are looking for reasons, plenty of why this and why that can be found on the web these days.
As a technical fellow, I'm only interested in real numbers. Not numbers released by the government statisticians, but actual data from the markets.
I've been using COT data for a few years now, and many of you are familiar with the following charts. But lately, those who jumped on the COT bandwagon in 2005 have now all but disappeared, because, the gold market is now at levels most of us are not familiar with, and the patterns and behavior of gold in the past four years are no longer predictable as they were. Those who have been trying to pick a top in gold based on past patterns in the last few weeks are simply stunned, and confused. Don't get me wrong, I'm not screaming "to da moon" either, I honestly cannot tell you when gold will top or at what price. As a trader and investor, that is something I do not need to know ahead of time, if an endeavor as such is at all possible.
So, why does gold keep going up?
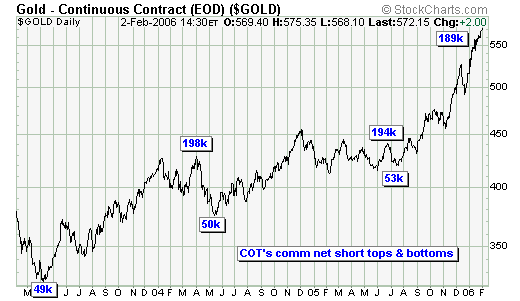
#1 - commercials net shorts on decline
Commercials are selling (shorting) less. Commercial hedgers as a group have been decreasing their total number of short positions as the price of gold continues higher.
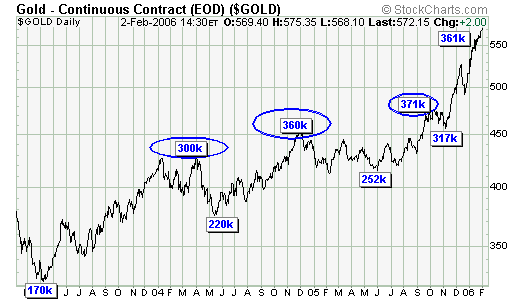
#2 - OI (open interests) has not increased despite higher gold prices.
Conventional wisdom suggests that higher prices are indications of higher levels of speculations taking place, which should be reflected and confirmed by higher OI, and that has been the case from 2001 up until Oct 2005. But gold has gained over $100 since Nov and OI has actually been falling after reaching only 361k, considering OI was at 371k when gold was at $475 in October. On the surface, this phenomenon may appear to be bearish, but from what I can see, it is bullish on two fronts:
First - there is clearly no panic buying in the futures market, speculation is actually down despite much higher gold prices.
Second - higher gold prices must come from increased physical buying, because it obviously is not showing up in the COT data. This leads us to the next chart…
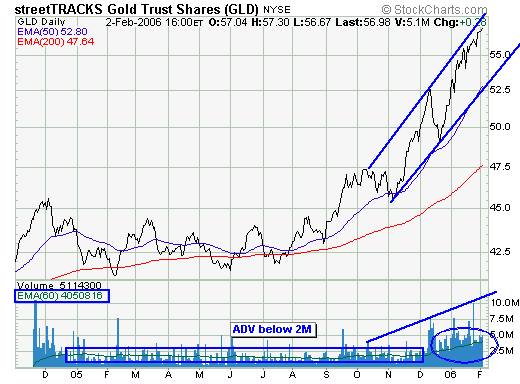
#3 - increased demand in physical gold
GLD - the relatively new gold ETF. It was introduced in late Nov 2004, and despite the initial high volume in the first few days of its launch, ADV (average daily volume) has been steady at just below two million, until Dec 2005 that is. Volume picked up dramatically since Dec, and the ADV has now doubled to over four million. Obviously the break above $500 caught the attention of those who have been ignoring gold. Sure, a rally accompanied with higher volume is very positive, but there is something very important about the doubling of volume.
GLD being a gold trust, must own actual gold bullions, and with volume having gained 100%, total gold in trust should also increase by 100%. Indeed, by checking in at the GLD website : www.streettracksgoldshares.com/us/value/gb_value_usa.php Gold held in trust has increased from 170 tonnes a year ago, to currently 340 tonnes. This effectively elevates GLD as one of the world's largest holder of bullion. China as a nation, only has a reported gold reserve of 600 tonnes.
Summary
Gold, like all markets, its price fluctuates based solely on supply and demand. The dramatic increase by investment demand has now placed us in a whole new arena. The gold market is no longer a ping pong match between commercials and speculators, it is now accepted and embraced as an investment vehicle. Question is: is this the end, or just the beginning? Why guess, I prefer to keep it simple by following price action and staying with the trend.
Jack Chan at www.traderscorporation.com
6 February 2006

Jack Chan is the editor of Simply Profits, established in 2006. Chan bought his first mining stock, Hoko Exploration, in 1979, and has been active in the markets for the past 37 years. Technical analysis has helped him filter out the noise and focus on the when, and leave the why to the fundamental analysts. His proprietary trading models have enabled him to identify the NASDAQ top in 2000, the new gold bull market in 2001, the stock market top in 2007, and the US dollar bottom in 2011.


