Will June Bring A Painful Correction For Gold


 Last week's trading saw the gold market made in Tuesday's session, here doing so with the tag of the 1875.70 figure (August, 2021 contract). From there, strength was seen into Wednesday, with the metal pushing up to a peak of 1915.60 - before spending the balance of the week in a sideways-to-down consolidation off the same.
Gold Market, Short-Term
Last weekend, I mentioned that the next short-term correction was again due to play out for the metal, with that decline phase coming from the smallest-tracked wave, the 10-day component:
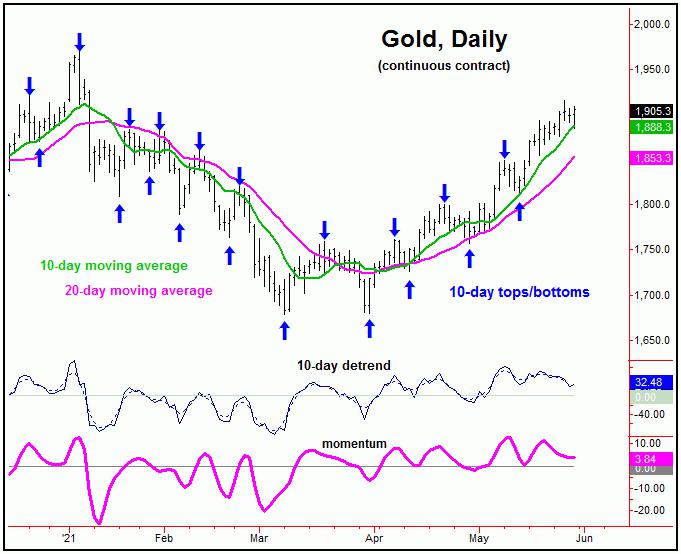
In terms of price, I noted the 10-day moving average as the normal downside magnet, simply due to the fact that a dominant cycle has a strong tendency (i.e., 85-90% odds) of reverting back to a moving average of the same length. This moving average was hit with the action seen into early last week, even though the move ended up as more of a sideways-to-down affair.
Having said the above, there are larger cycles at work for gold, which suggest the potential for a bigger correction just around the corner. Take a look at the next chart:
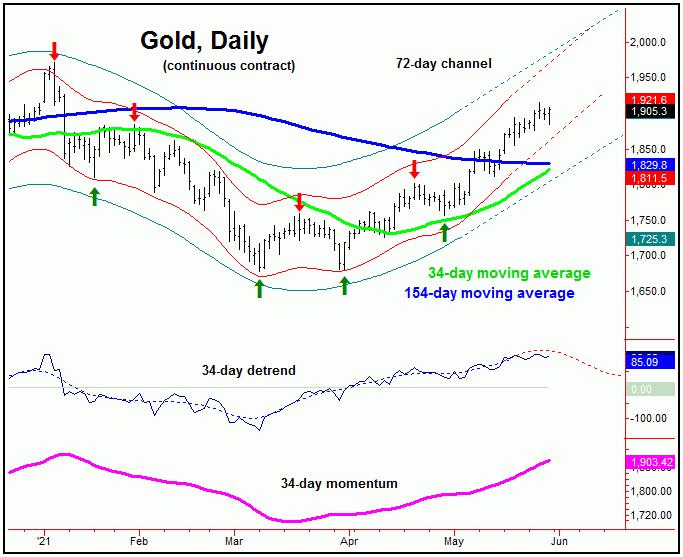
The chart above shows the 34-day wave, which is in the process of topping - and may well have peaked with the recent tag of the 1915.60 figure. Having said that, this is too soon to say with any degree of certainty, and has yet to be confirmed.
However, should the metal make it up to a higher high in the near-term, that move - due to technical considerations - would be the odds-on favorite to top this 34-day wave, for what is likely to be a decent correction in the month of June
In terms of price, as mentioned earlier, a cycle has an above-average tendency to revert back to a moving average of the same length. With that, the 34-day moving average will be a natural downside magnet, once this 34-day wave does turn. In terms of patterns, however, due to the larger-degree cycles, that move would be favored to end up as a countertrend retracement - inside a much larger bullish upward phase.
As mentioned in prior articles, the 154-day moving average (and shown on our 34-day cycle chart) was noted as the ideal upside magnet to price off the March bottom, which was easily met with the subsequent action. With the metal now well above this key moving average, both the aforementioned 34-day moving average - as well as this 154-day moving average - will now provide support to any move lower.
Gold's Mid-Term View
For the mid-term picture, the upward phasing of the larger 154 and 310-day cycles is deemed to be in force, ideally pushing higher into later this Summer. Here again is the larger of the two waves, the 310-day component:
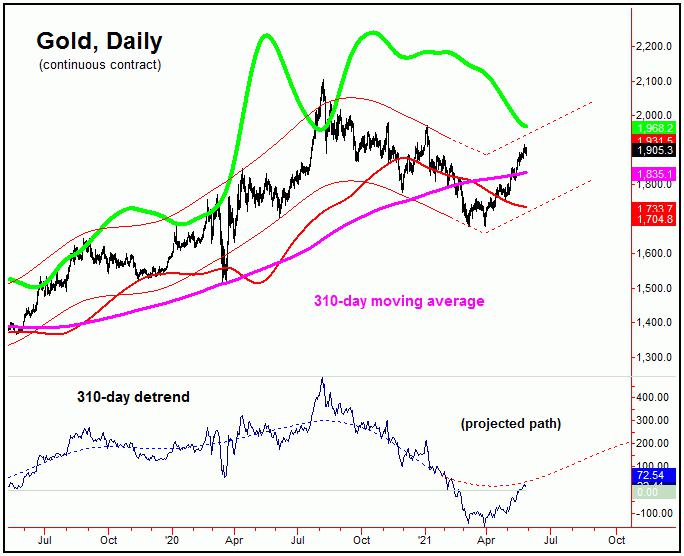
Going further with the above, the current upward phase of this 310-day wave is actually favored to remain intact into early next year, though with the strongest part of that rally phase expected to play out into this Summer - following what could be a painful short- term correction phase, coming from the aforementioned 34-day cycle.
All said then, a good short-term correction in the days/weeks ahead, if seen as expected, should set the stage for a sharp rally into later this Summer, one which has the potential to test or exceed the all-time highs for Gold. From there, another good decline is expected to play out into later in the year, with more precise details of how this decline will play out noted in our thrice-weekly Gold Wave Trader market report.
U.S. Stock Market 'Kill' Date
As mentioned in some of my recent articles, the U.S. stock market - as measured by the S&P 500 index (or 'SPX') - is working on a mid-term peak. In-between, we were looking for a hard correction, which was projected to play out into the mid-May timeframe - and coming from the 45-day time cycle:
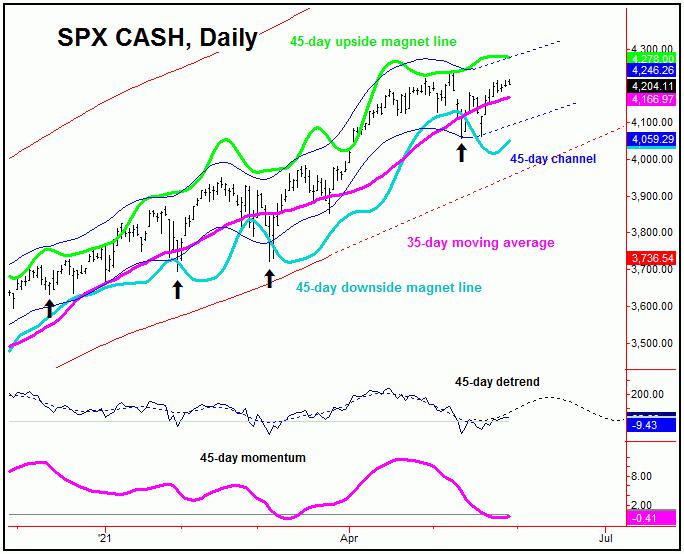
In terms of price, our analysis called for a drop back to the 35-day moving average - which is a normal downside magnet to the correction phase of this wave. What followed was a sharp decline of 4.2% from peak-to-trough, taking the SPX all the way down to a low of 4056.88 - made right into the expected mid-May bottoming window.
Going further with the above, we were able to BUY the market (via the SPY security) into the May 11-12 region - right as this low was being made. This is a position we are still holding - but are looking for technical reasons to exit in the days/weeks ahead, due to the fact that a larger-degree correction could be just around the corner.
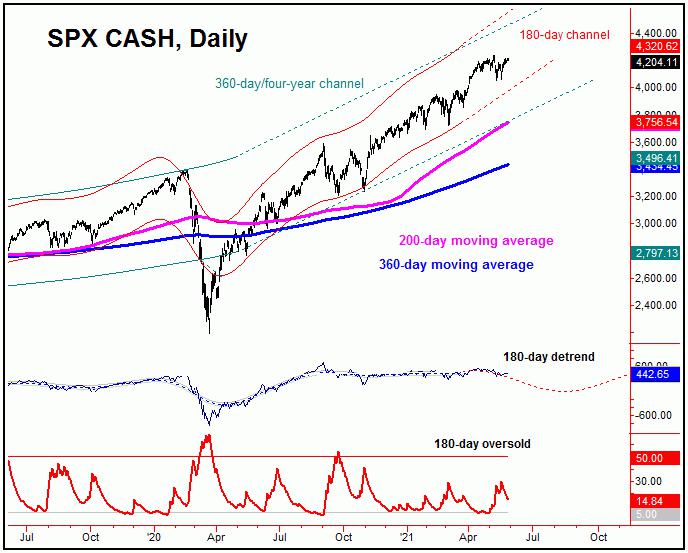
With the above said and noted, the next mid-term correction phase should come from the combination of 180 and 360-day cycles, with the smaller 180-day wave shown on the chart below:
As mentioned in prior articles, we are looking for a much bigger correction phase to play out in the coming months, a 'vacuum' period for U.S. stocks - and a decline which is expected to be the largest percentage of this year.
In terms of time, there is a key date (i.e., 'Kill' Date) that we are watching for the next mid-term peak to form, with the exact details noted in our daily Market Turns report, which tracks the U.S. stock market.
Our analysis has correctly called the turns in U.S. stocks this year, with each of the shorter-term decline phases having been expected to end up as countertrend - giving way to higher highs, upon completion. As mentioned, the next major move is expected to be a mid-term correction phase.
I should add again that the coming mid-term decline for the U.S. stock market - if it does its job - will have many thinking that the larger bull market is over. However, that will not be the case, as what follows should be a very sharp, multi-month rally, taking the market higher well into next year or beyond - before the next longer-term peak is expected to form. More on all as we continue to move forward.
Jim Curry
The Gold Wave Trader
http://goldwavetrader.com/
http://cyclewave.homestead.com/
Jim Curry is the editor and publisher of The Gold Wave Trader and Market Turns advisories - each of which specializes in the use of cyclic and statistical analysis to time the gold and U.S. stock markets. He is also the author of several trading-related e-books, and can be reached at the URL's above.
********


