Is Your Bank Safe? A Look At Wells Fargo


Here's the latest in our "Is Your Bank Safe?" series at SaferBankingResearch.com -- this one on Wells Fargo.
Over the last few months, we have written several articles outlining our views of banks in general. We explained the relationship that you, as a depositor, have with your bank is in line with a debtor/creditor relationship. This places you in a precarious position should the bank encounter financial or liquidity issues. Moreover, we also outlined why reliance on the FDIC may not be wholly advisable. And, finally, we explained that the next time there's a financial meltdown, your deposits may be turned into equity to assist the bank in reorganizing.
So, at the end of the day, it behooves you, as a depositor, to seek out the strongest banks you can find, and to avoid banks which have questionable stability.
While we outlined in our last articles the potential pitfalls we foresee with regard to various banks in the foreseeable future, we have not provided you with a deeper understanding as to why we see the larger banks as having questionable stability. Over the coming months, we intend to publish articles outlining our views on this matter.
First, we want to explain the process with which we review the stability of a bank.
We focus on four main categories which are crucial to any bank's operating performance. These are: 1) Balance Sheet Strength; 2) Margins & Cost Efficiency; 3) Asset Quality; 4) Capital & Profitability. Each of these four categories is divided into five subcategories, and then a score ranging from 1-5 is assigned for each of these 20 sub-categories:
If a bank looks much better than the peer group in the sub-category, it receives a score of 5.
If a bank looks better than the peer group in the sub-category, it receives a score of 4.
If a bank looks in line with the peer group in the sub-category, it receives a score of 3.
If a bank looks worse than the peer group in the sub-category, it receives a score of 2.
If a bank looks much worse than the peer group in the sub-category, it receives a score of 1.
Afterwards, we add up all the scores to get our total rating score. To make our analysis objective and straightforward, all the scores are equally weighted. As a result, an ideal bank gets 100 points, an average one 60 points, and a bad one of 20 points.
If you would like to read more detail on our process for evaluating a bank, feel free to read it here.
But, there are also certain "gate-keeping" issues which a bank must overcome before we even score that particular bank. And many banks present "red flags" which cause us to shy away from even considering them in our ranking system.
As mentioned before, it's difficult to overestimate the importance of a deeper analysis when it comes to choosing a really strong and safe bank. There are quite a lot of red flags to which many retail depositors may not pay attention, especially in a stable market environment. However, those red flags are likely to lead to major issues in a volatile environment. Below, we highlight some of the key issues that we're currently seeing when we take a closer look at Wells Fargo (WFC).
Commercial loan book is skewed toward financial companies
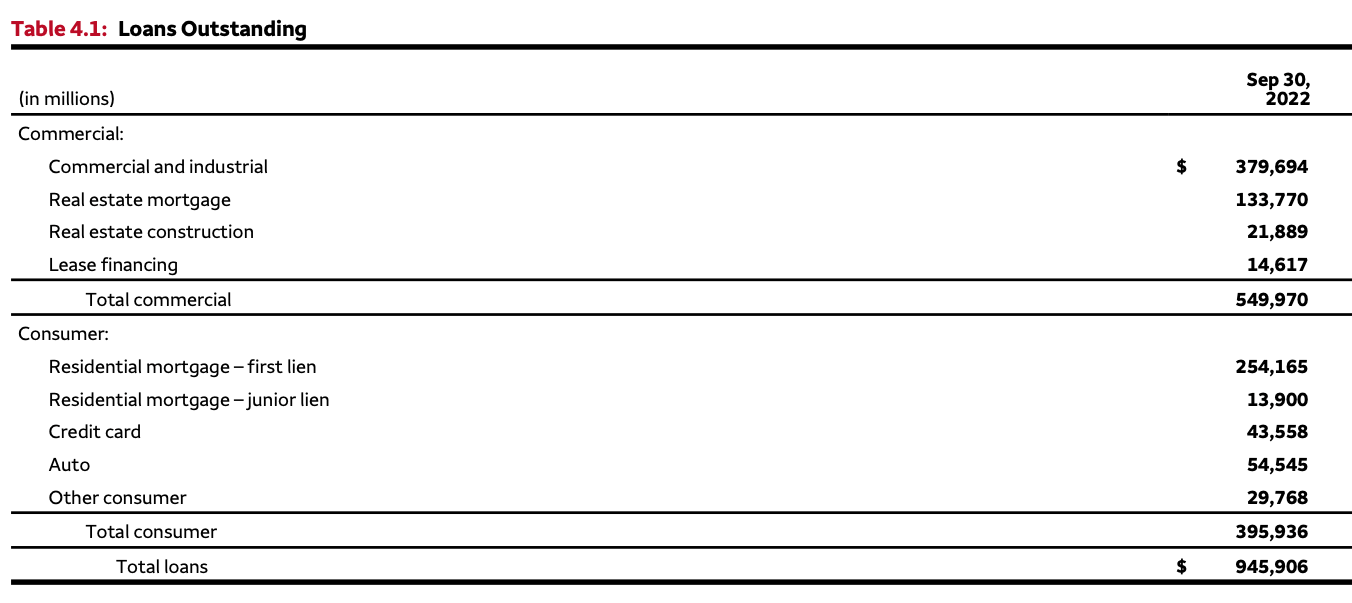
Wells Fargo has been historically viewed by many as a mortgage-focused lender. However, despite this common perception, commercial loans represented 58% of the bank's total outstanding loans as of the end of the third quarter.
Company Data
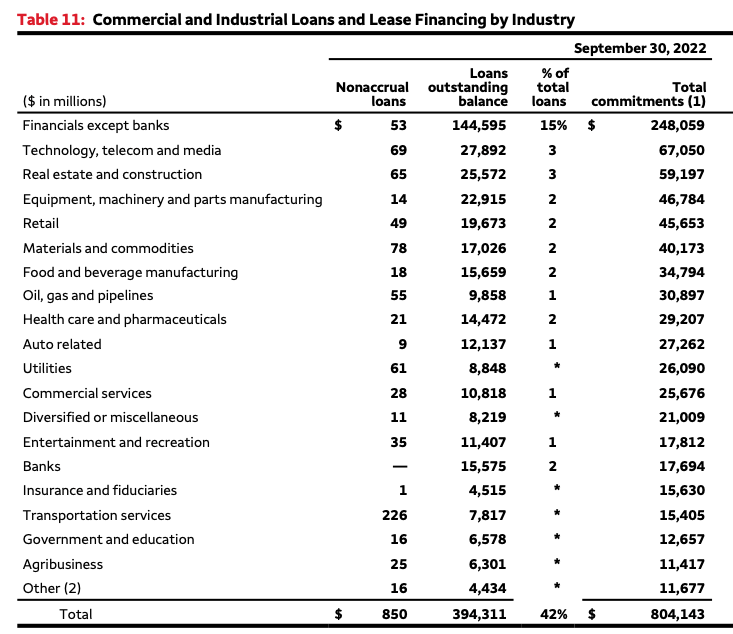
Moreover, 15% of all WFC's commercial loans were granted to financial companies. By comparison, the second-largest industry, technology, telecom and media, has a share of just 3%.
Company Data
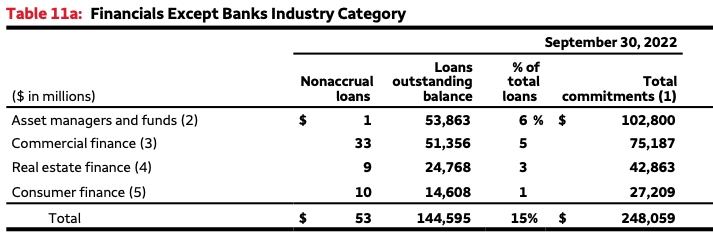
Below is a breakdown of the bank's loans to financial companies. As you can see, there are loans to such high-risk borrowers as asset managers and funds, commercial finance, real estate finance, and consumer finance. Obviously, as the history tells us, these industries would be under significant pressure in a crisis environment.
Company Data
Exposure to non-U.S. lending, including loans to offshore-based companies
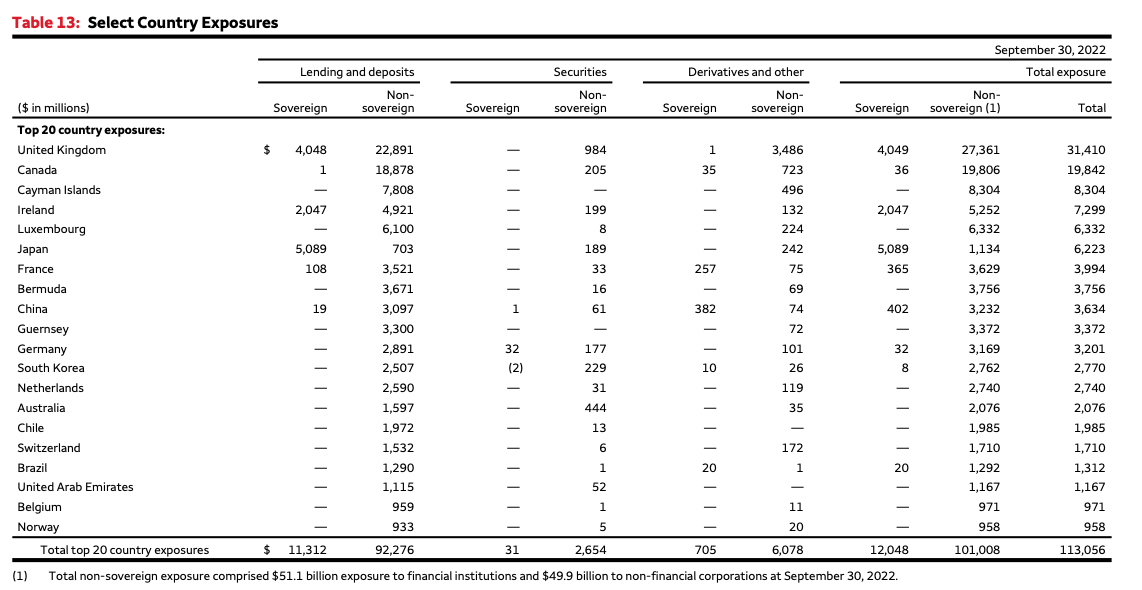
According to the bank's latest 10-Q, its commercial lending book includes $79.6B of non-U.S. loans, which is almost 15% of the bank's total commercial credit portfolio. These non-U.S. book includes the following loans:
- $44.6B to the financial companies expect banks industry;
- $15.9B to the banks industry;
- $1.7B to the oil, gas, and pipelines industry.
The table below provides a breakdown of the bank's non-U.S. exposure by country. It's important to note that, as the table shows, WFC granted loans to corporates based in such off-shore tax-heaven countries as Cayman Islands, Bermuda, and Guernsey, as well as such small countries as Luxembourg.
Company Data
In comparison, we also analyzed Bank of America's (BAC) non-U.S. exposure in our recent article. While BAC does have quite a few red flags as well, it's well worth noting that its non-U.S. lending book does not have exposure to offshore-based countries, which suggests that WFC is in even a much more risky posture.
Credit cards represent just 11% of consumer loans, however, this segment generates almost a half of earnings
Residential loans (first lien) are still the largest part of WFC's retail lending portfolio. The rest of the book is represented by higher-risk products, such as junior lien mortgages, credit cards, and auto loans. The share of credit cards looks quite low, at 11% of the bank's total consumer loans.
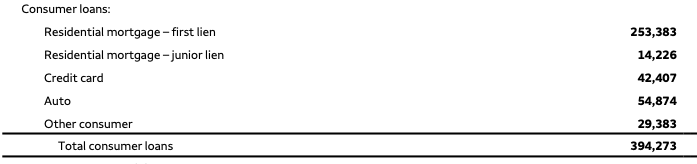
Company Data
With that being said, there's a significant difference between the bank's yields on mortgages and credit cards. The average yield on WFC's residential mortgages was 3.16%. By comparison, the average yield on the bank's credit card portfolio was 11.51%.
While the share of credit cards business is just 11% based on outstanding loans, its earnings share was is as high as 44%. Given that credit cards are probably the riskiest product for a banking industry, WFC would likely face quite large losses from credit cards business in a crisis scenario, and its whole retail lending segment would be loss-making, despite that lower-risk mortgages have the largest share of the bank's retail book.
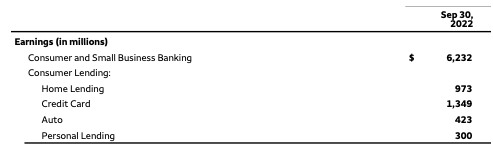
Company Data
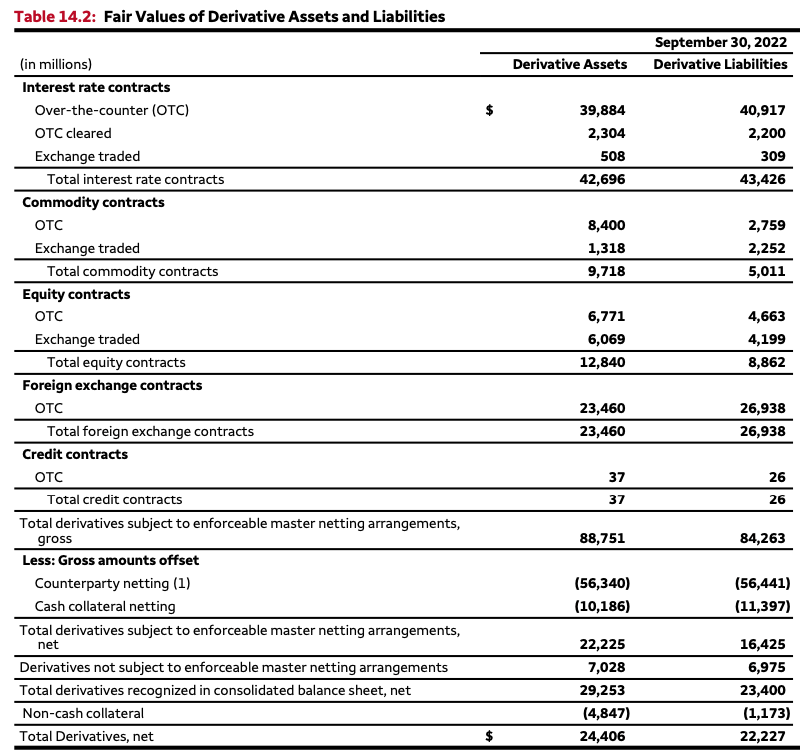
Significant amounts of OTC derivatives and equities
The table below shows fair value of WFC's derivative assets and liabilities. As you see, there are significant amounts of OTC derivatives. As we said in our earlier articles, OTC contracts are the riskiest type of derivatives, especially in a recessionary environment when there is a high chance of a counter-party default risk.
Company Data
Additionally, if one is really bearish on the market and expects a wave of defaults among large banks, then it's well worth taking a look at WFC's total derivative notional amount, which were about $12T as of the end of the third quarter.
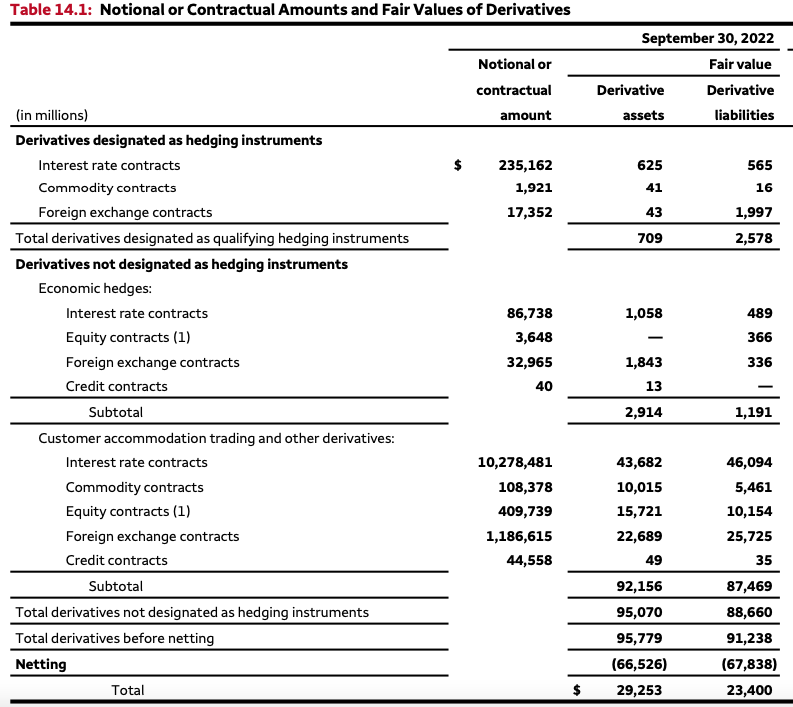
Company Data
Lastly, it's worth noting that Wells had $60B of equity securities as of the end of the third quarter.
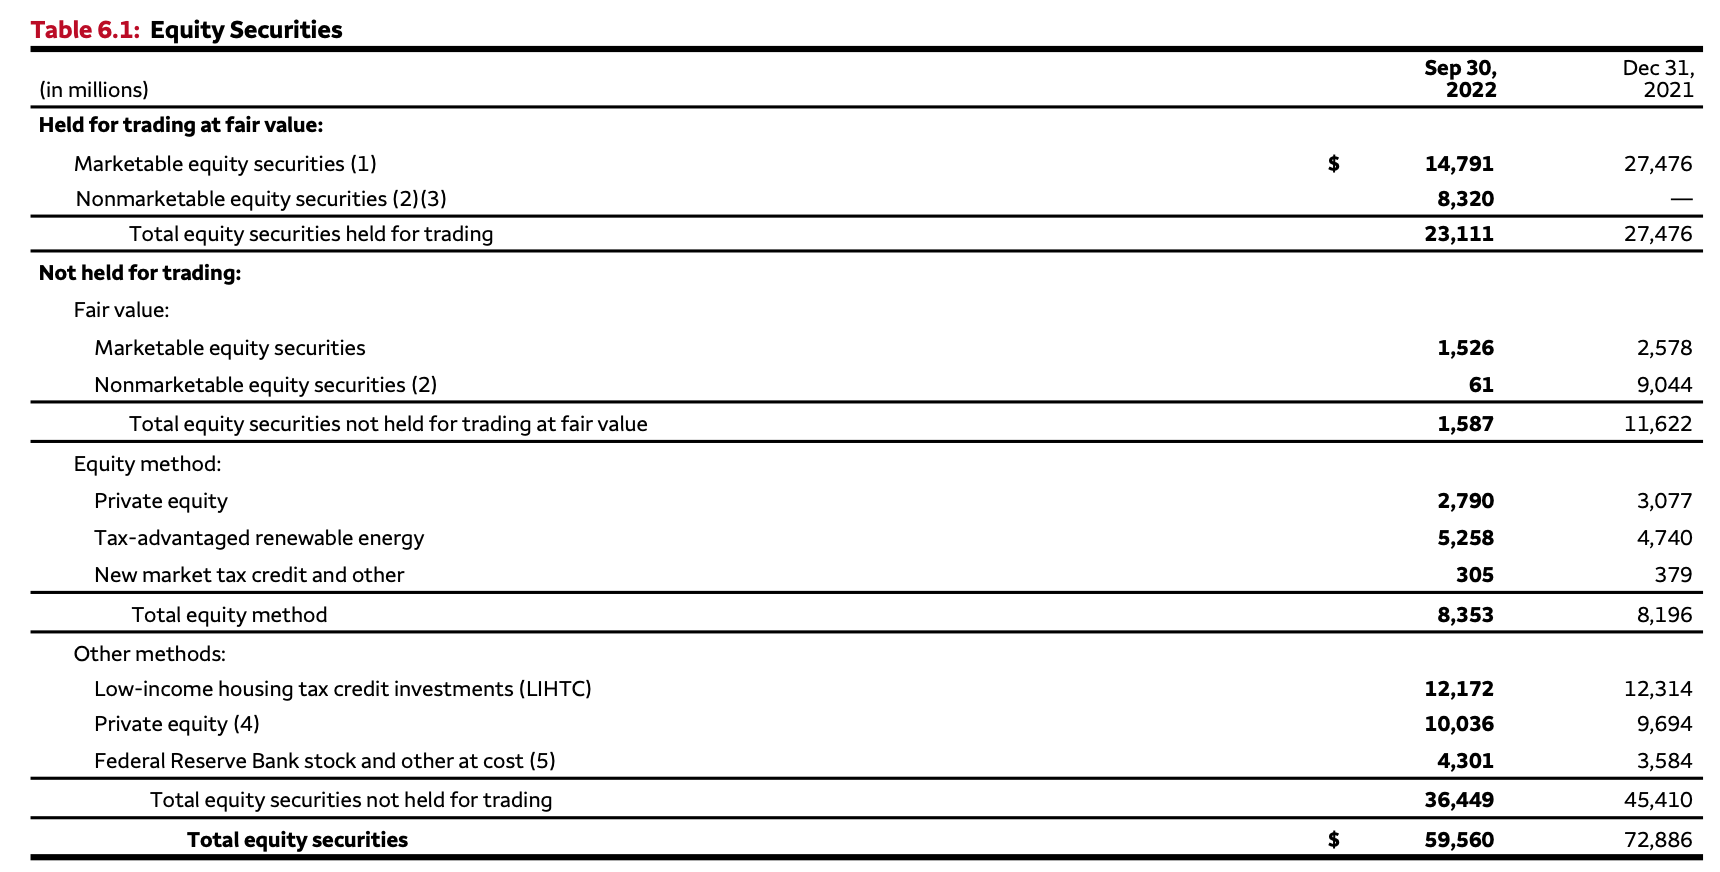
Company Data
Subpar cost efficiency
Weak operational efficiency has been one of the key issues of WFC's business model for several years now. The bank introduced quite a few cost-cutting measures. However, its efficiency metrics remain very weak, even for a large U.S. bank. For the first nine months of the year, its cost-to-income ratio was 76%, and it even deteriorated from 70% for the nine months of 2021. This means that WFC needs 76% of its total revenues just to cover its non-interest operating expenses. Loan loss provisions, which are not a part of non-interest operating expenses, generally rise significantly in a crisis environment. That implies with such a weak cost-to-income ratio, even a mild increase in loan loss provisions would make WFC a loss-making entity.
By comparison, the majority of the banks that we have identified at SaferBankingResearch.com have cost-to-income ratios in the range of high 30%s to low 50%s.
The 2022 Fed stress tests suggest a 24% capital lost
In June, the Fed published stress-test results for 33 U.S. banks. As shown below, under the severely adverse scenario WFC posted a net loss of $30.7B (a net loss plus AOCI included in capital) or 24% of the bank's CET1 capital as of the end of 9M22. As we noted before in our articles, the Fed's assumptions for its severely adverse scenario are quite mild, in our view. In particular, the Fed assumed a relatively short-lived market correction and a V-type recovery of both the markets and the global economy. However, even under these assumptions, WFC loses almost a quarter of its CET1 capital.
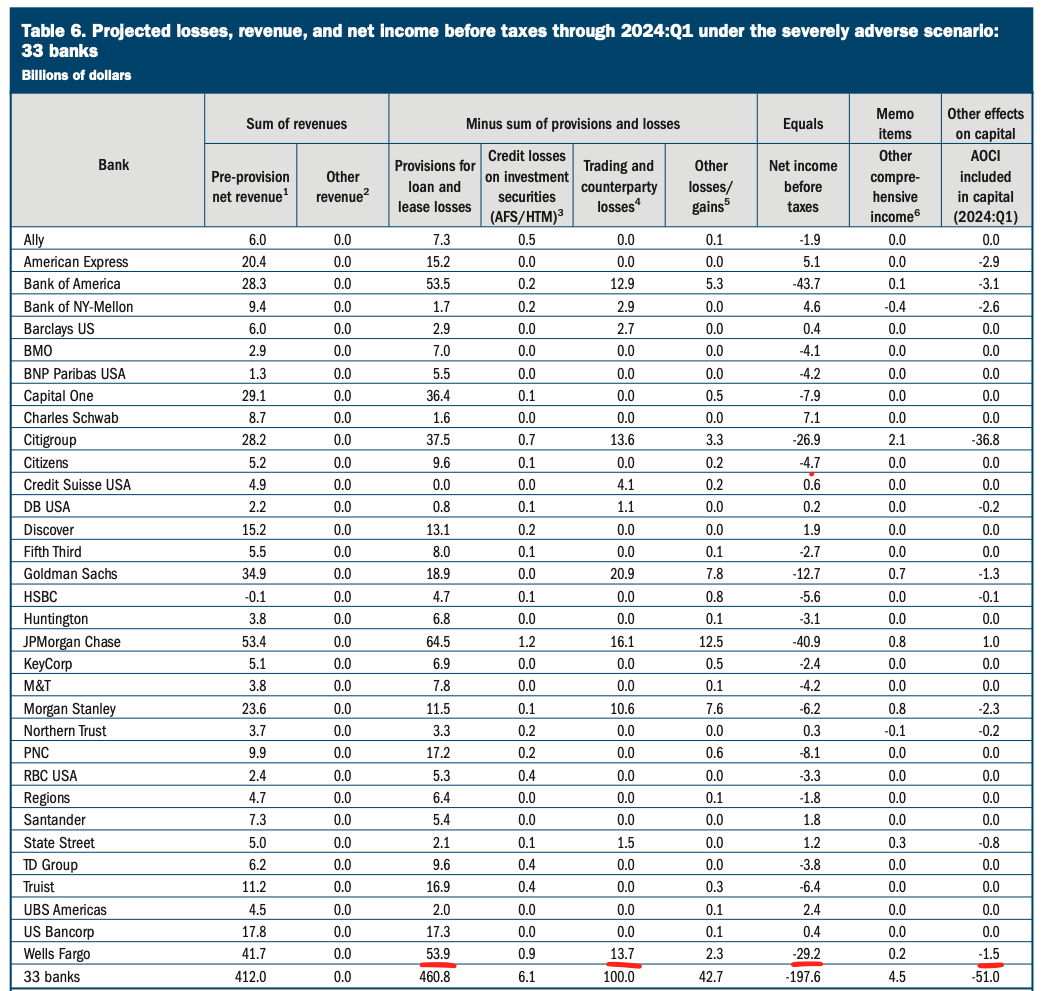
The Fed
The bottom line
In contrast to WFC, our 15 top U.S. banks at SaferBankingResearch.com do not have credit exposure to risky financial lenders and grant loans only to U.S.-based companies, have very low shares of unsecured retail loans, do not have any equities or derivatives on both their balance and their off-balance sheets, and also have very efficient business models with excellent cost-income ratios.
Moreover, WFC has more red flags, which we did not discuss in detail due to the limitations of the article, such as its various litigation issues, the bank's off-balance sheet items, and a potential increase in RWA (risk-weighted assets) in a volatile environment. However, all our Top-15 banks have been tested for these red flags to ensure their long-term stability.
********
 Avi Gilburt is a widely followed Elliott Wave technical analyst and author of ElliottWaveTrader.net, a live Trading Room featuring his intraday market analysis (including emini S&P500, metals, oil, USD & VXX), interactive member-analyst forum, and detailed library of Elliott Wave education. You can contact Avi at: [email protected].


