Dollar and Gold Elliott Wave Projection


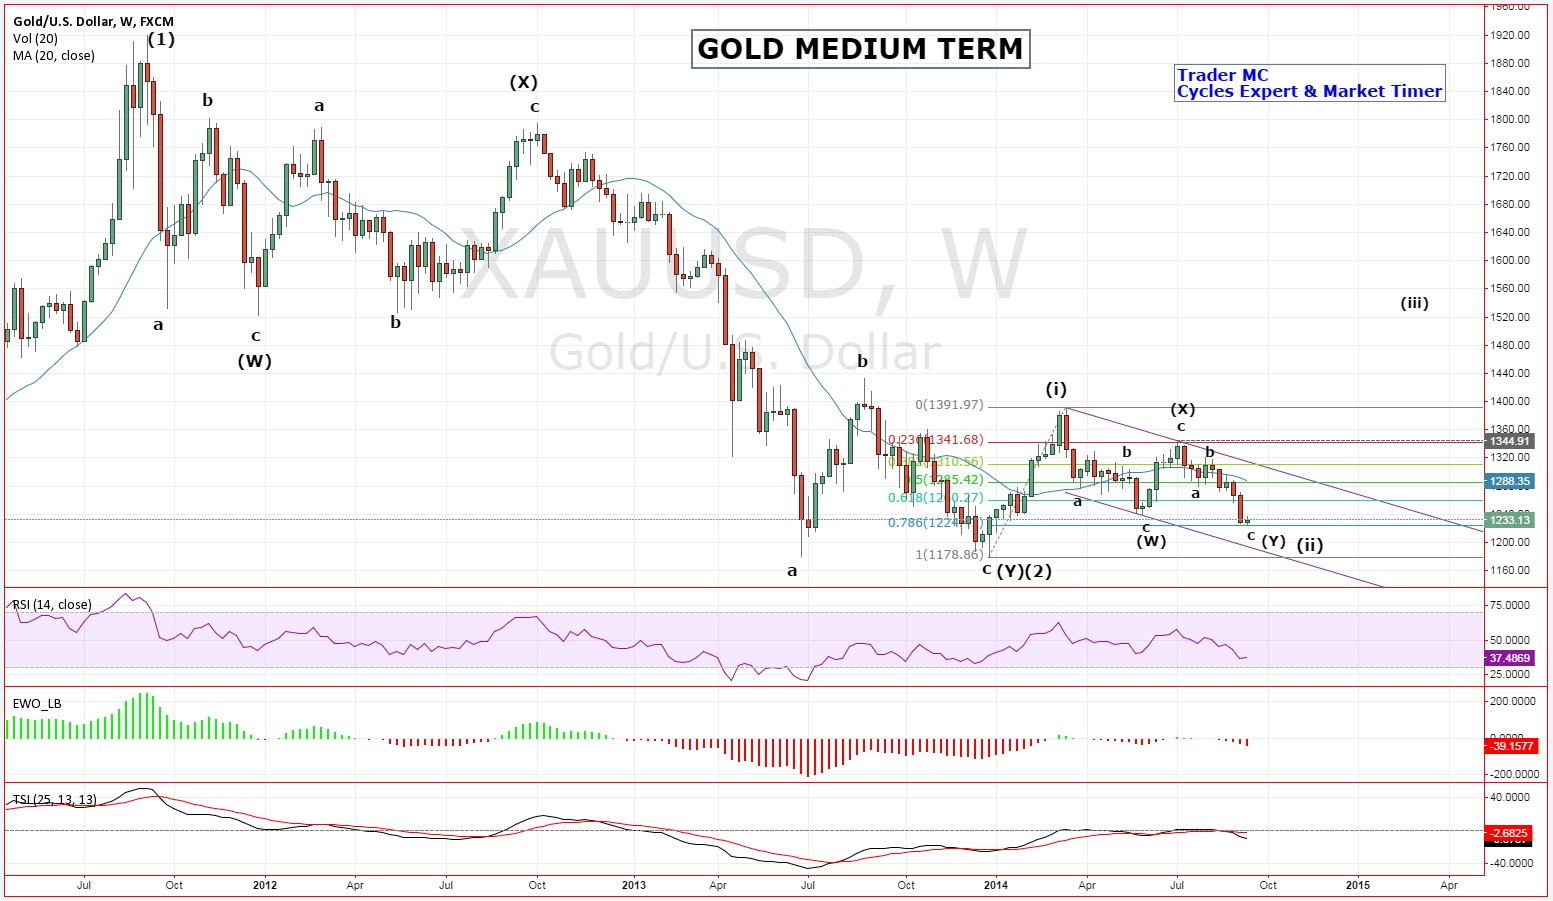
Gold is now at a key juncture and it should reveal its price action structure in the coming weeks. The first chart is my main Elliott Wave count and shows a Double Three Corrective Pattern (W)-(X)-(Y) in process from the top in 2011. You can see that Gold is currently in a corrective channel and should end soon a Wave (ii) which is also composed of a Double Three Corrective Pattern. If that scenario plays out Gold should enter a Wave (iii) that should send it to around $1550 which would be the minimum target.
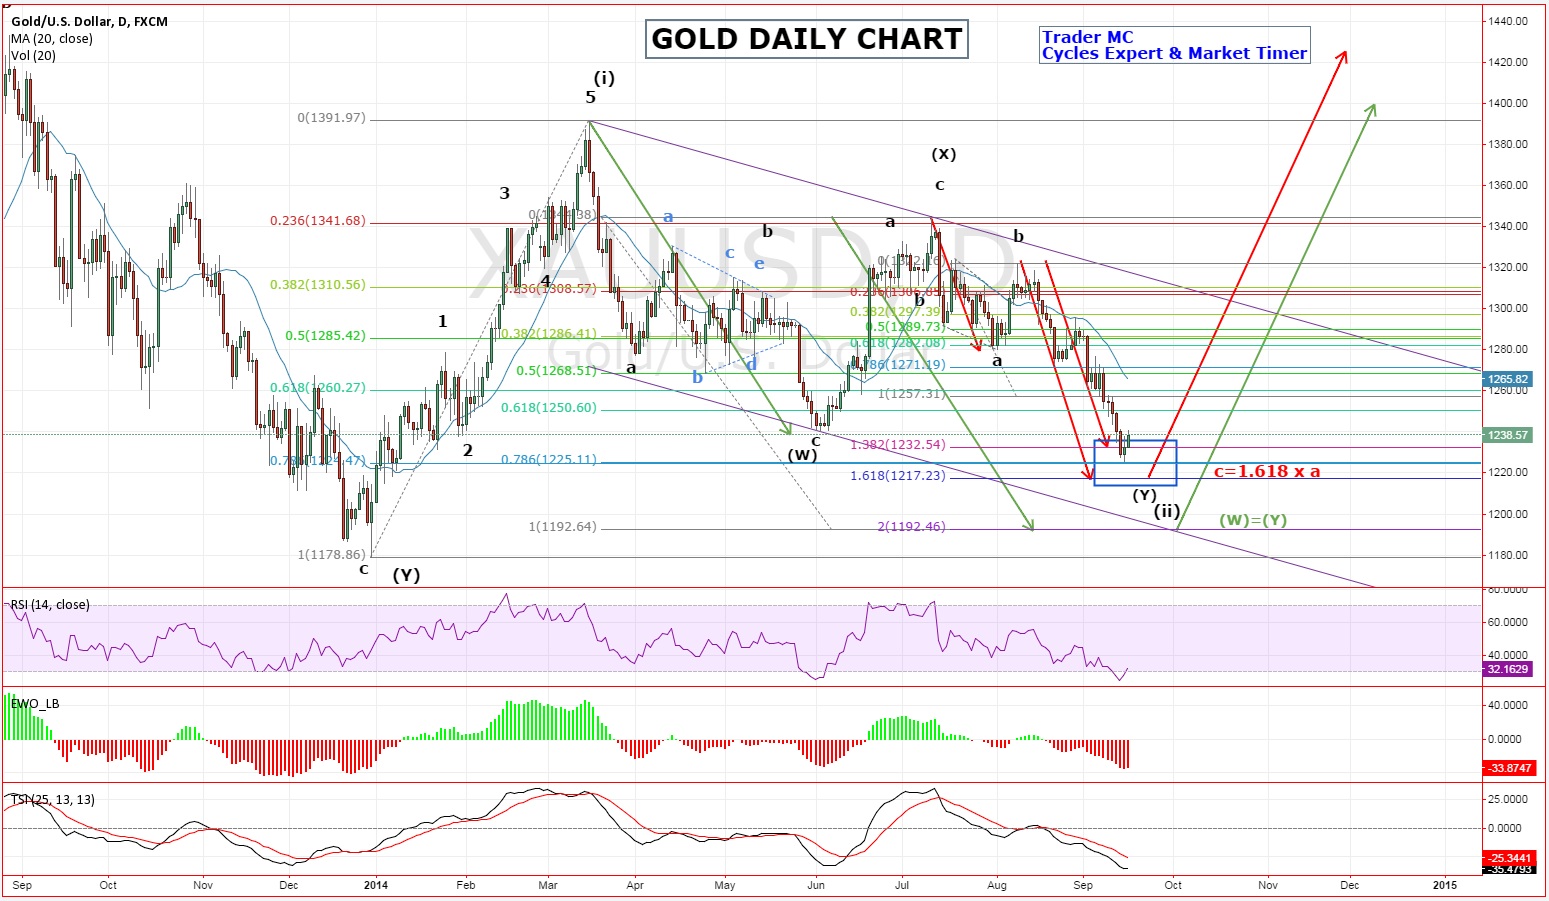
The next chart is a closer view of Gold that shows the projection of the corrective Wave (Y) within the Wave (ii). In case Wave (X) equals Wave (Y) Gold could reach $1192. Wave (Y) is also composed of three corrective subwaves a-b-c and if wave c has a Fibonacci connection with wave a (c = 1.618 x a) then Gold could reach $1217 which would be the extreme of Wave (ii).
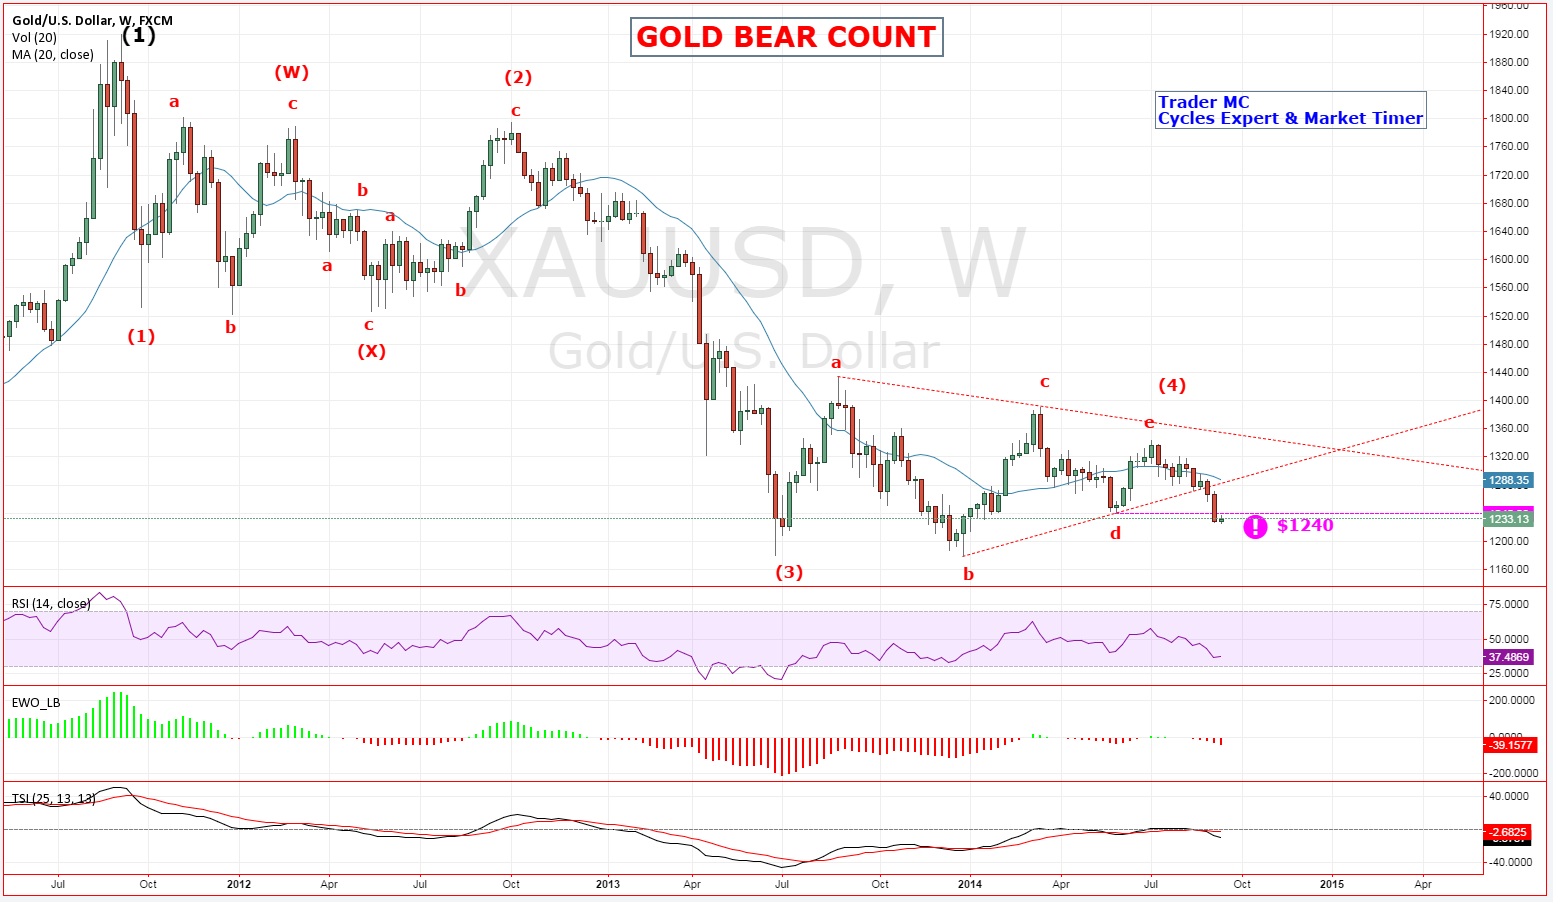
The Elliott Wave Principle prepares us psychologically for the highest probable outcome but also alerts quickly when something is wrong in case we need to change our strategy. $1178 is a key level for my main count to play out but if this level is broken I will switch to the following bear count which shows an impulsive downmove in progress since 2011 top. An impulsive downmove is composed of 5 waves and Gold could currently be in the final Wave 5 as it broke down of a corrective Triangle Pattern which is characteristic of a Wave (4) (price action just broke down below point d at $1240).
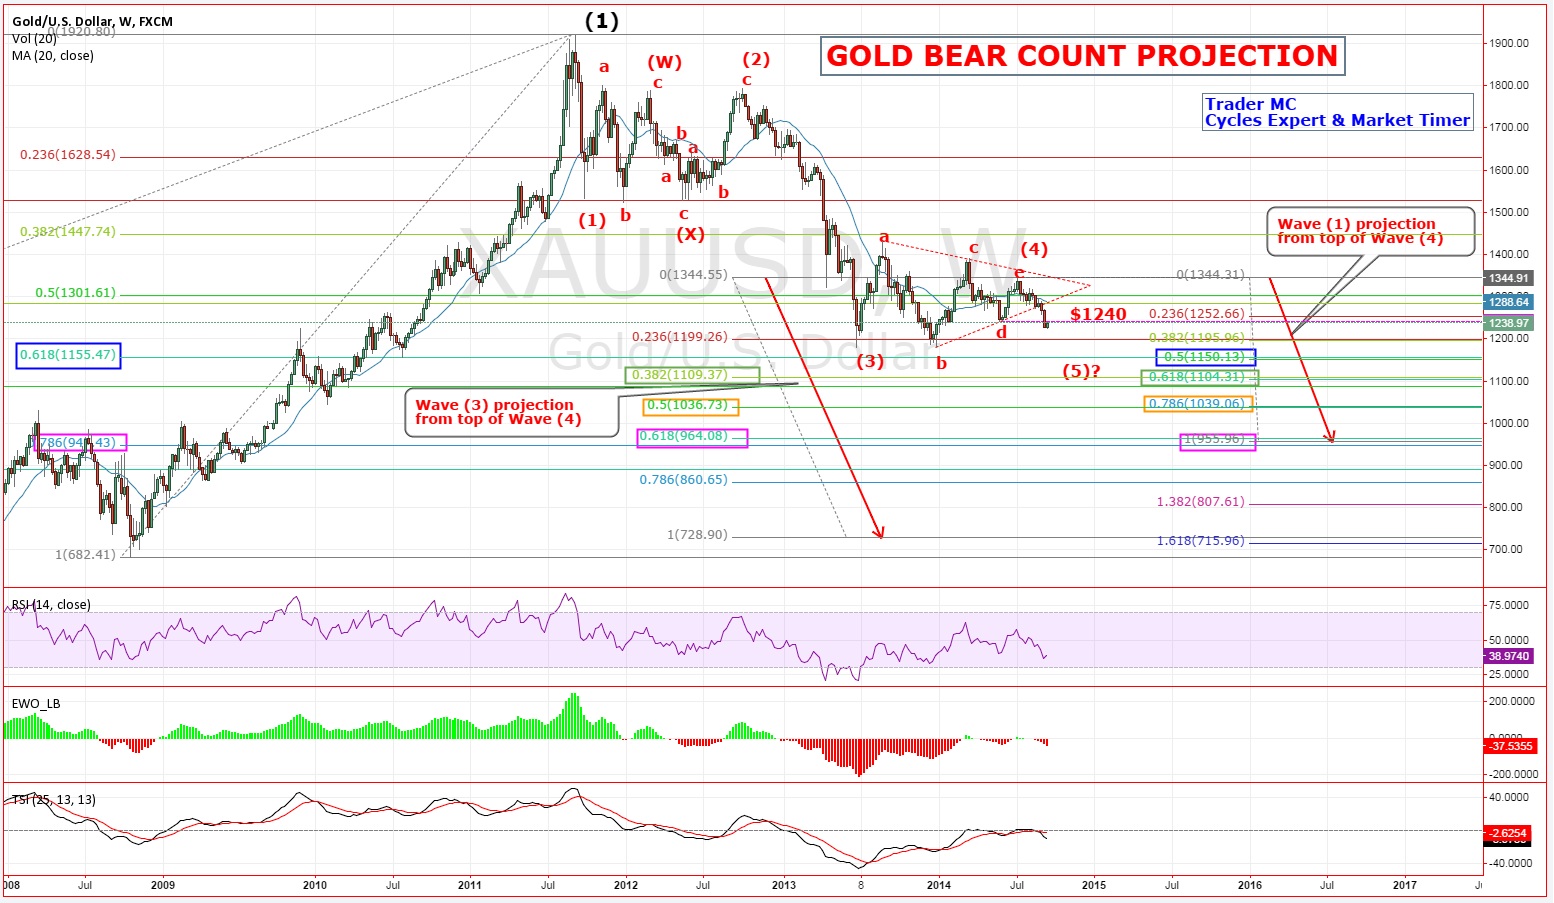
If $1178 is broken we should see an acceleration move to the downside for Wave 5. On the following chart you can see different targets for Wave (5) using a Fibonacci projection of Wave (1) and Wave (3) from the top of Wave (4) as Wave (5) has usually a Fibonacci relationship with these waves. If this scenario plays out, the first possible target would be $1150-$1155 as it corresponds to 0.618 Fibonacci level from the low in 2008 to the top in 2011 and it also matches with 0.50 Fibonacci level of Wave (1). The second possible target would be around $1104-$1109 as it matches with the Fibonacci numbers 0.382 of Wave (3) and 0.618 of Wave (1). Lastly you can see that the next Fibonacci convergence zone targets are $1036-$1039 (0.50 of Wave (3) and 0.786 of Wave (1)) and $947-$964 (0.618 of Wave (3) and Wave (5) equals Wave (1)).
It is also important to keep an eye on the Dollar structure as the Dollar Index has usually an inverse relationship with Gold (except in the 80′s when central planners did not create trillions of free dollars). The following chart is the US Dollar big picture. You can see that the Dollar is in a 30 years Wedge Pattern and has been forming a Triangle Pattern these last 5 years. This Triangle Pattern should be completed soon and a breakout either to the upside or to the downside should be very telling for the Gold Market structure.
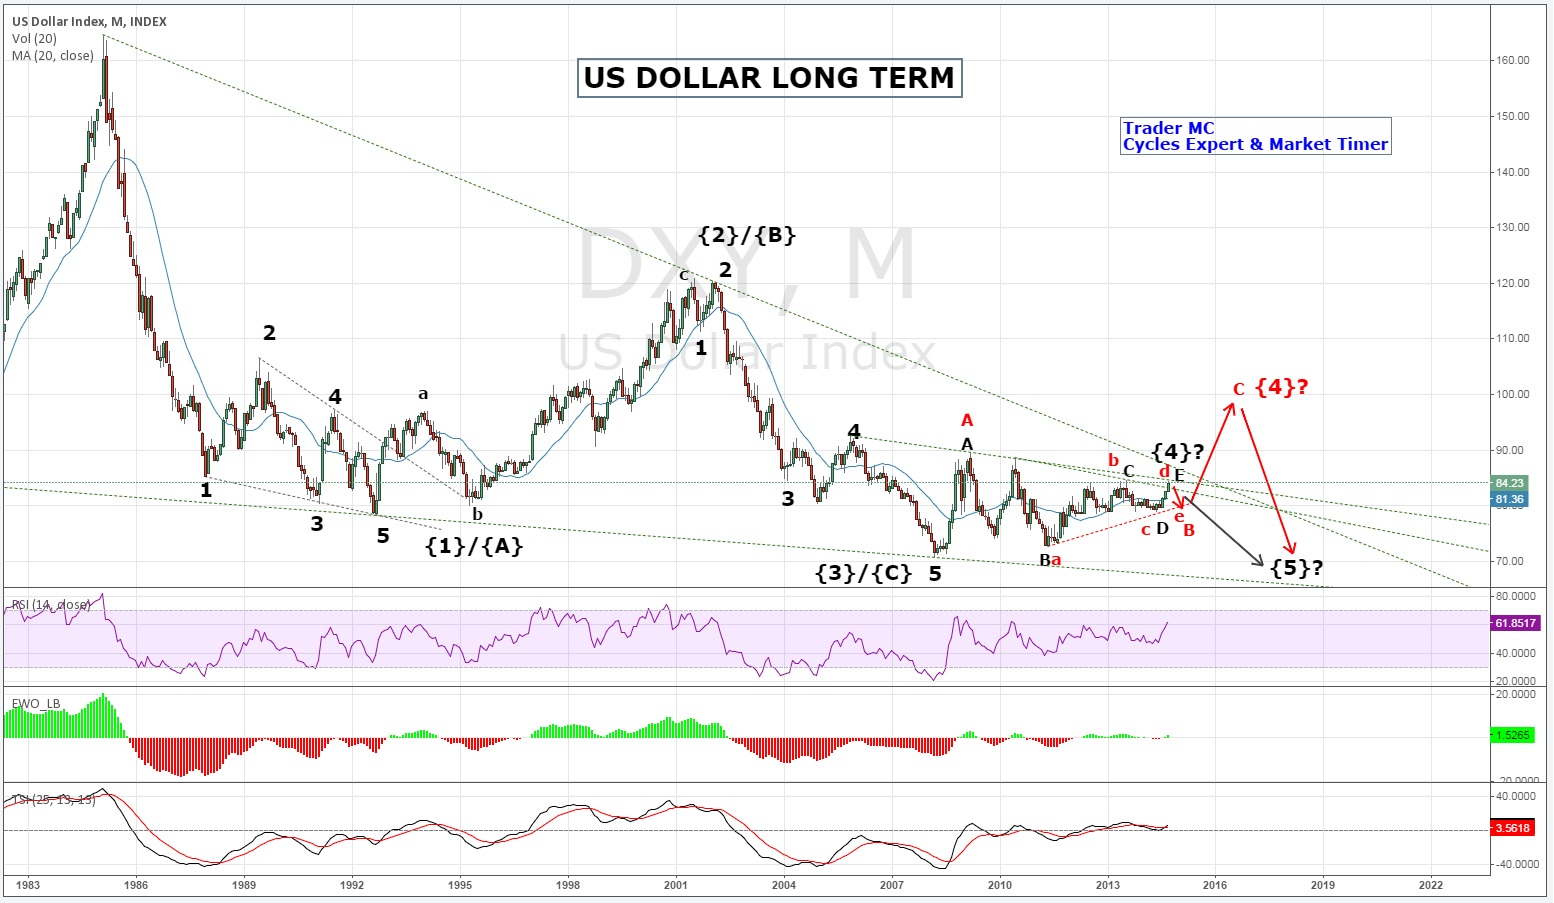
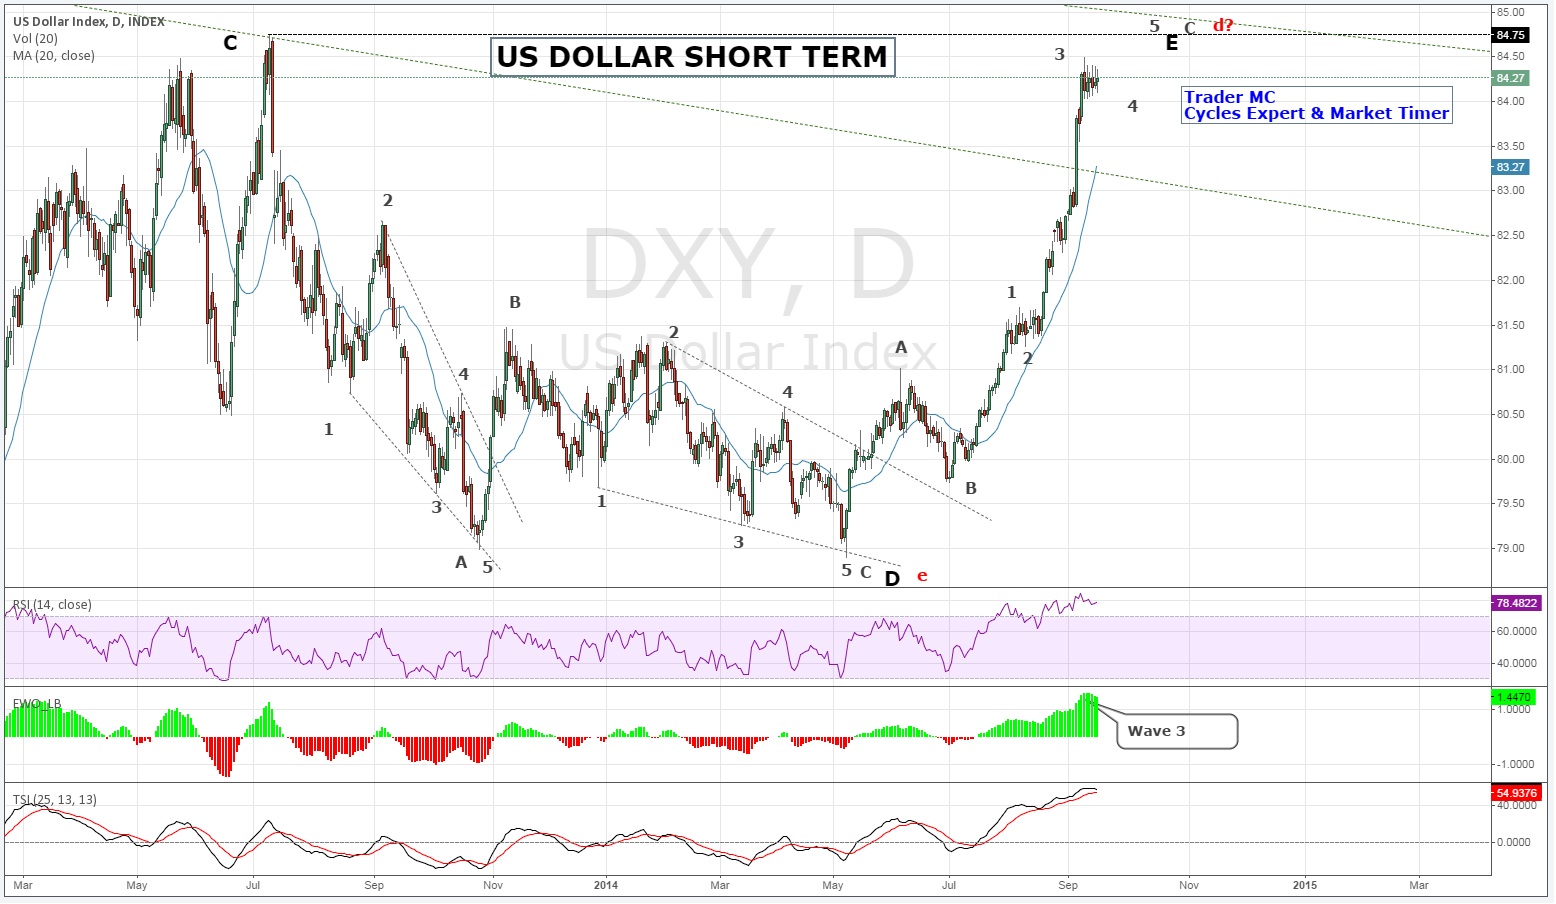
The current Wave (E) or d of the Triangle Pattern is composed of 3 corrective waves A-B-C and the Dollar Index should make soon a final Wave 5 up before reversing to the downside. The Dollar is also approaching key levels for its market structure.
Gold price is currently between $1192 and $1240 which are key levels. Patterns change with the psychology of the market and it is important to adjust in real time. The Gold market structure should reveal itself very soon, we just have to be patient and let the market come to us.
Courtesy of tradermc


