GDX And GDXJ Targets


I’m going to use the GDX and GDXJ as a proxy for the rest of the PM stock indexes which are very similar to these two. Last Wednesday we looked at the short term daily charts to the longer term weekly charts to see how things were setting in the PM complex.
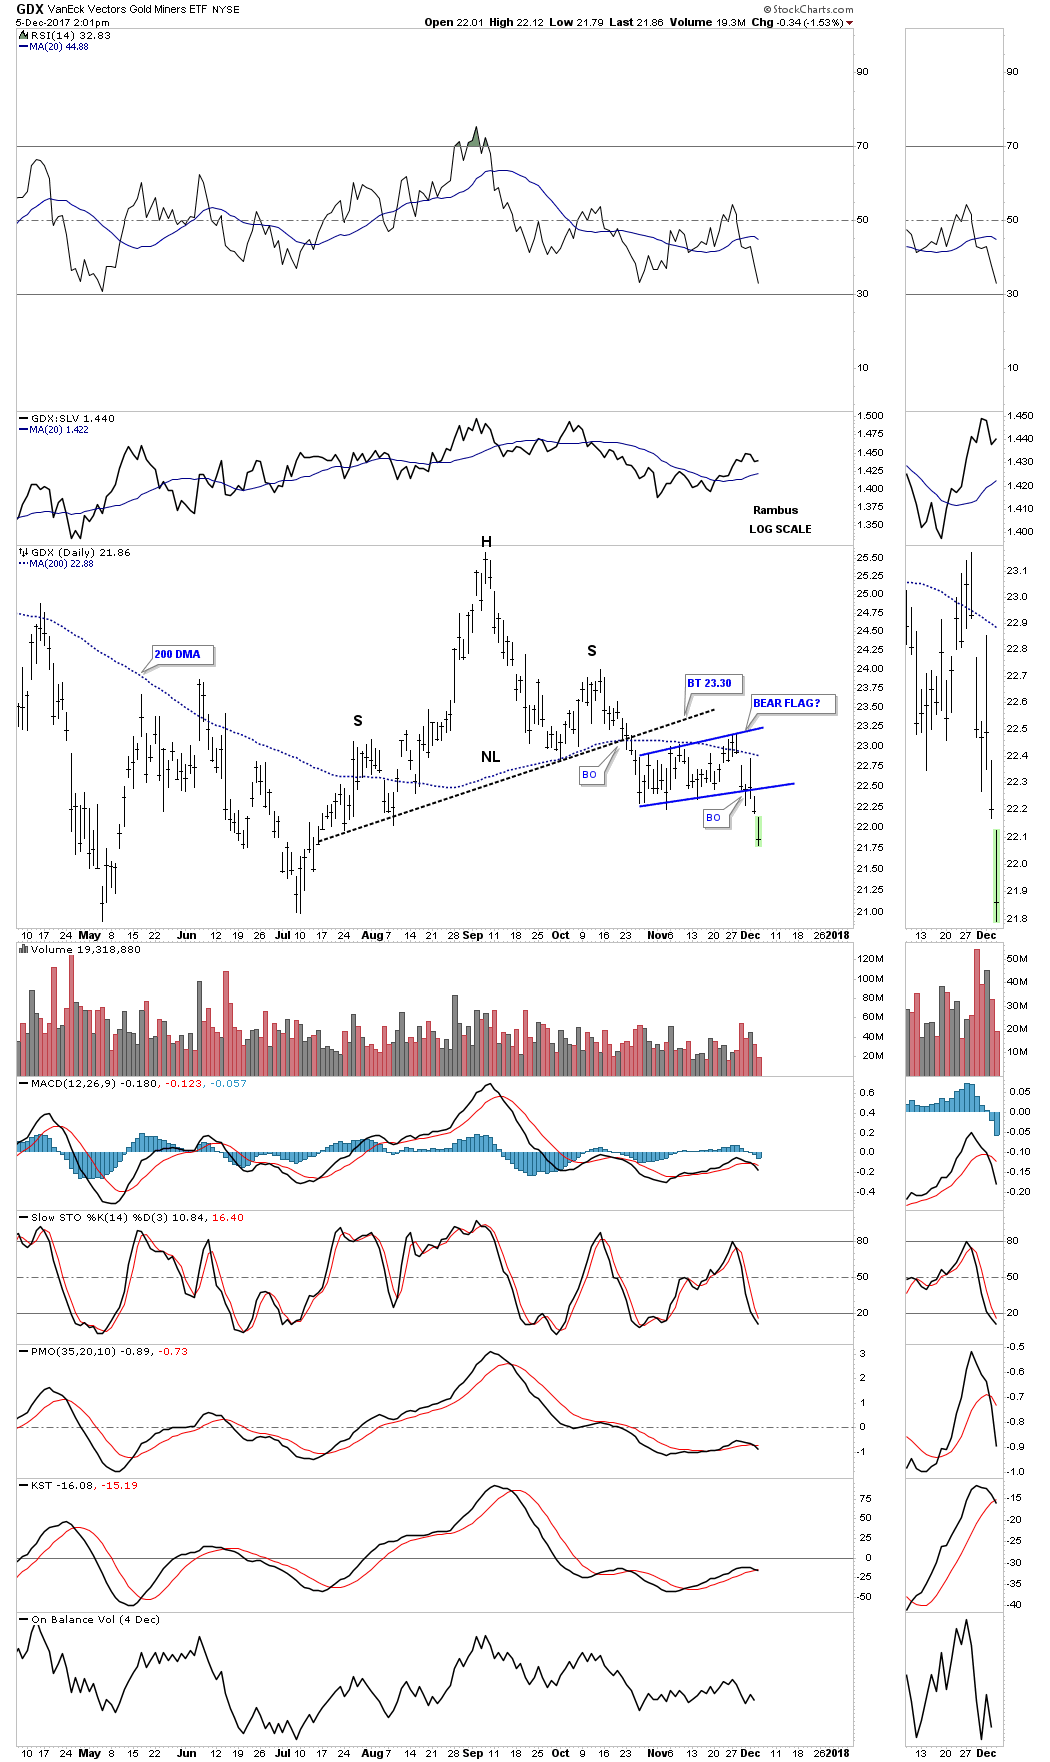
We first looked at the short term daily chart which was showing the H&S top and the smaller blue consolidation pattern that was building out below the neckline. The smaller blue patterns were kind of morphing, but were giving us a hint of what they would eventually look like when they competed.
Below is the short term daily chart for the GDX which shows the H&S top with the completed bearish rising flag. The breakout was a little sloppy, but today we are getting some follow through to the downside.
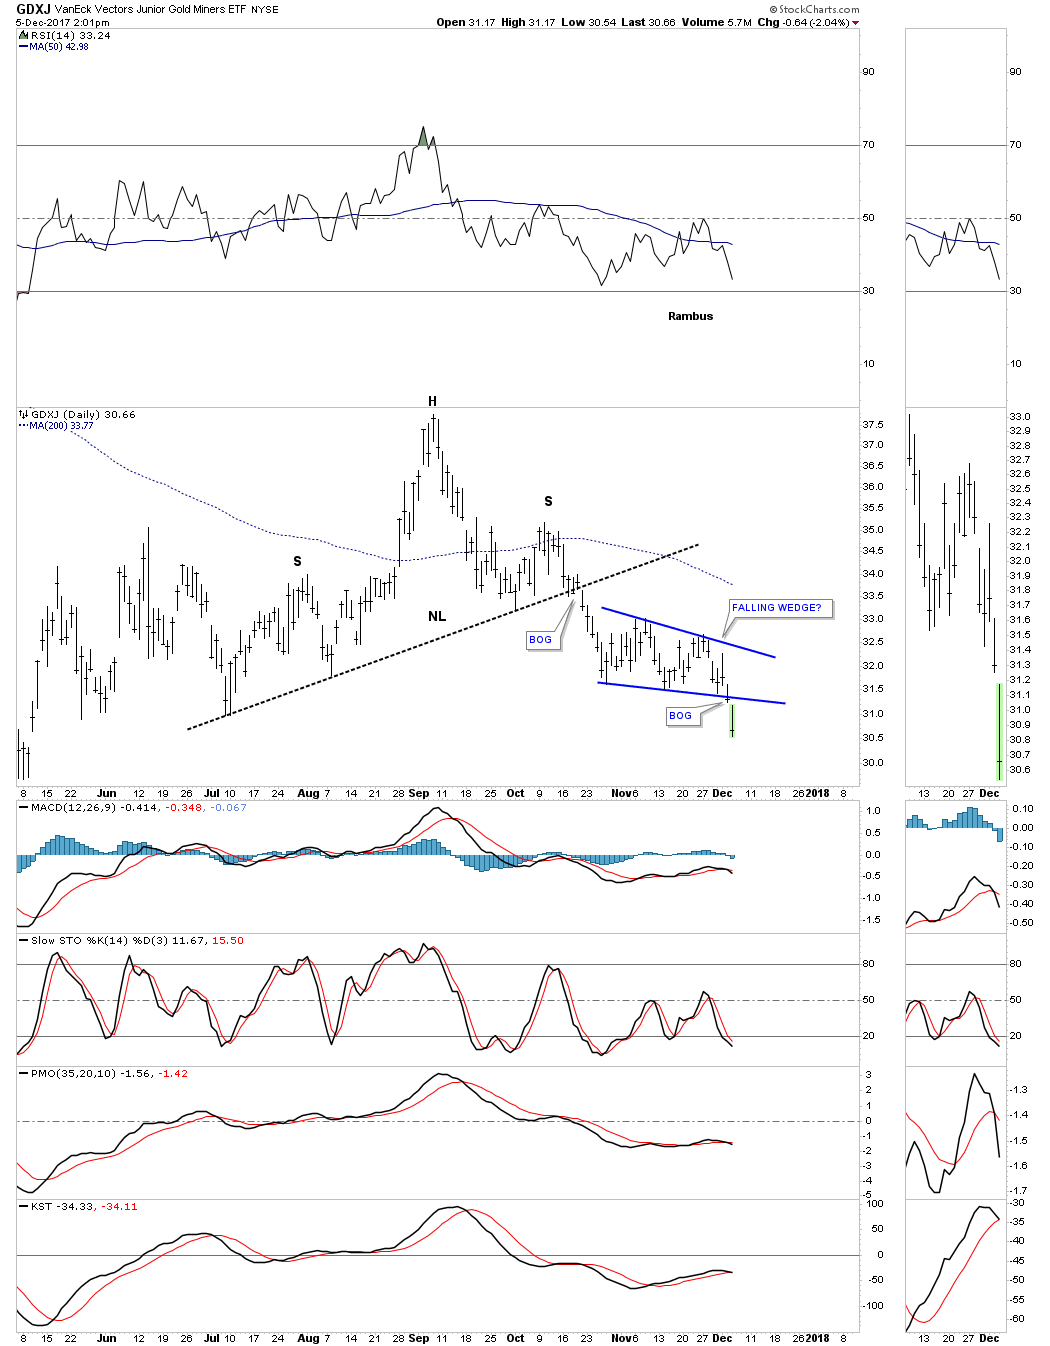
This short term daily chart for the GDXJ shows it broke out below the bottom rail of its bearish falling wedge this morning with a breakout gap.
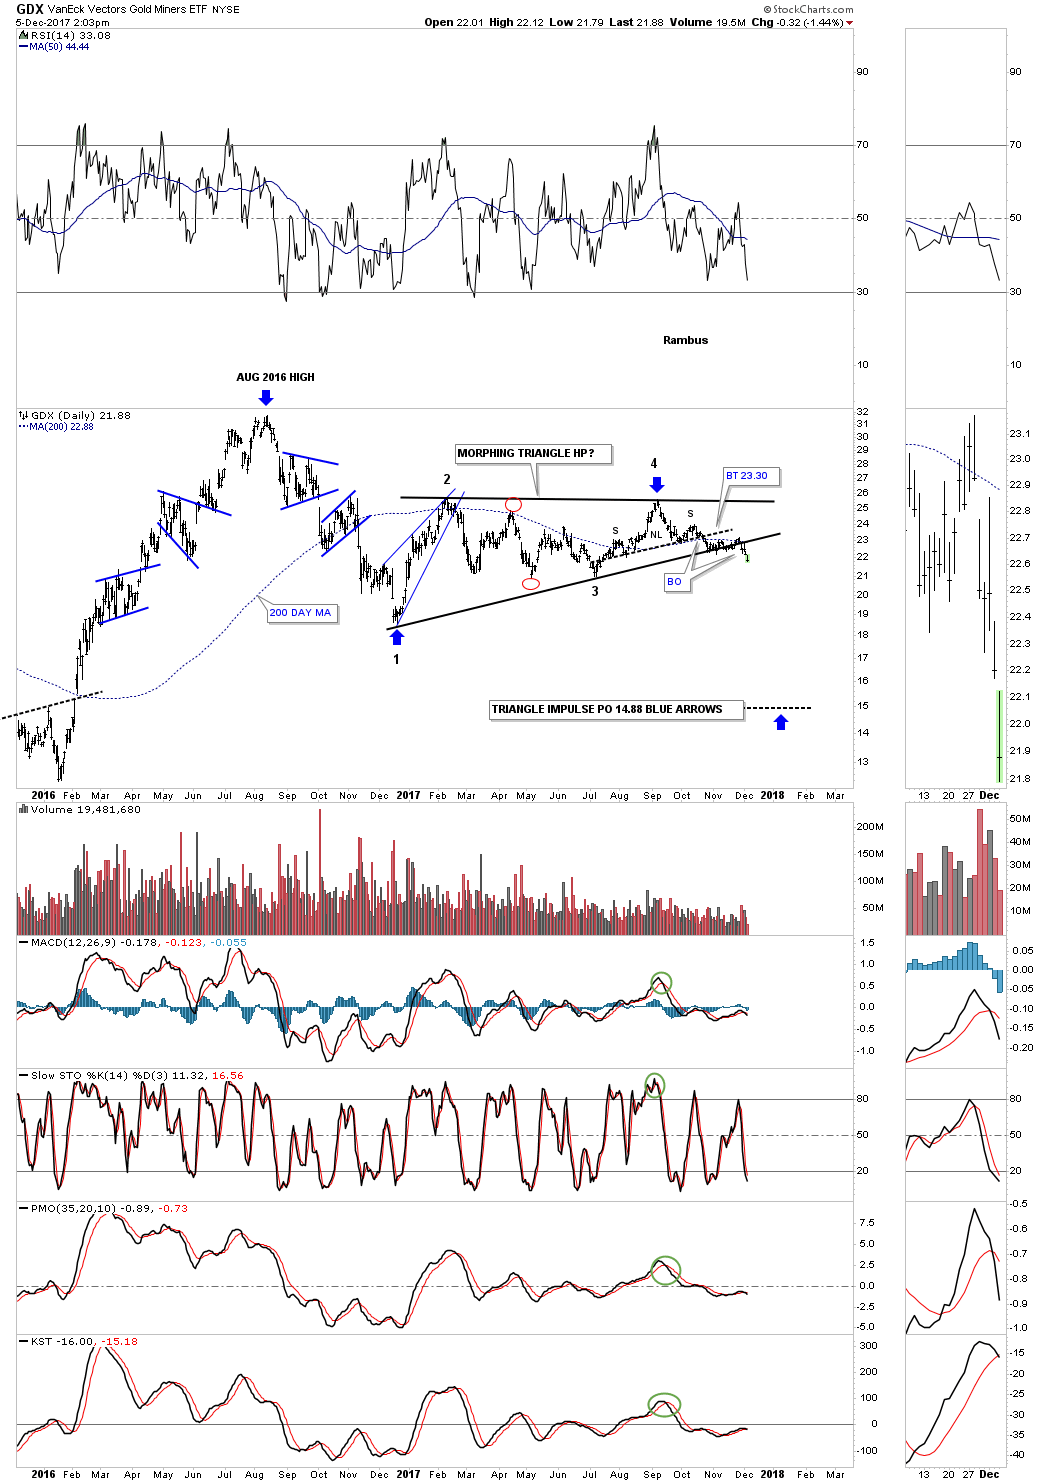
Now let’s look at the longer term daily chart for the GDX which shows the one year triangle consolidation pattern with the breakout now visible. The chances are high that the triangle consolidation pattern will be a halfway pattern to the downside with a price objective to the 14.88 area as shown by the blue arrows.
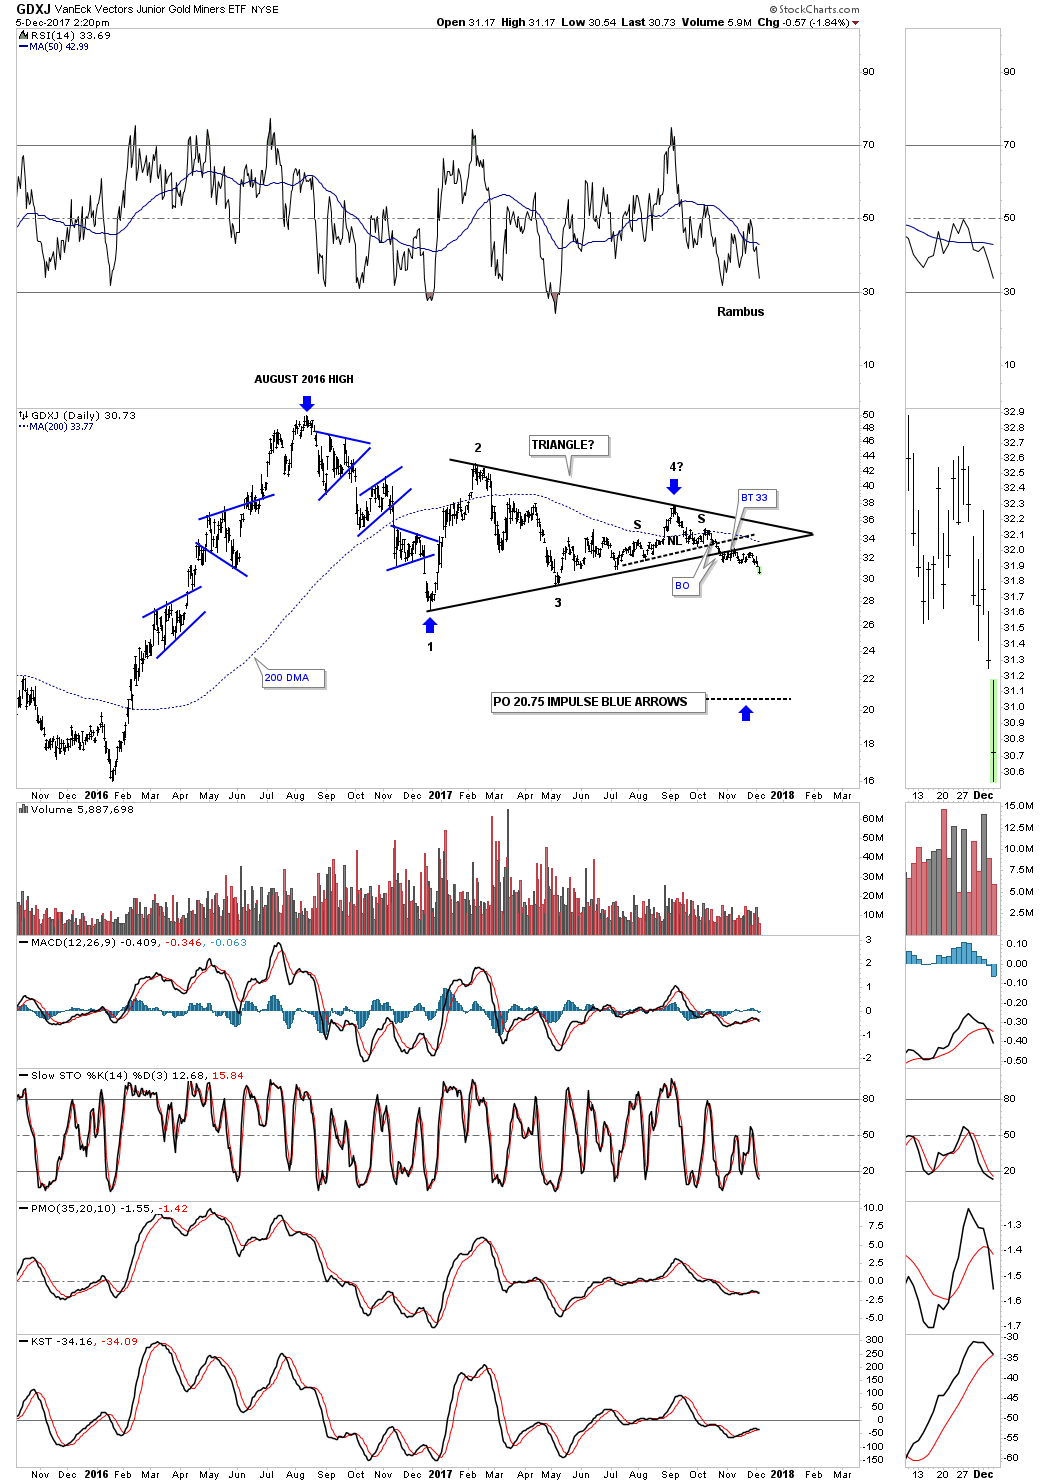
Below is the long term daily chart for the GDXJ which shows the H&S top on the short term daily chart as the 4th reversal point in its one year triangle consolidation pattern. The impulse measured move would be down to the 20.75 area as shown by the blue arrows.
This four year weekly chart for the GDX puts the triangle in perspective as a possible halfway pattern to the downside. It’s still possible we could see a backtest to the underside of the bottom rail of the triangle which would come into play around the 22.75 area.
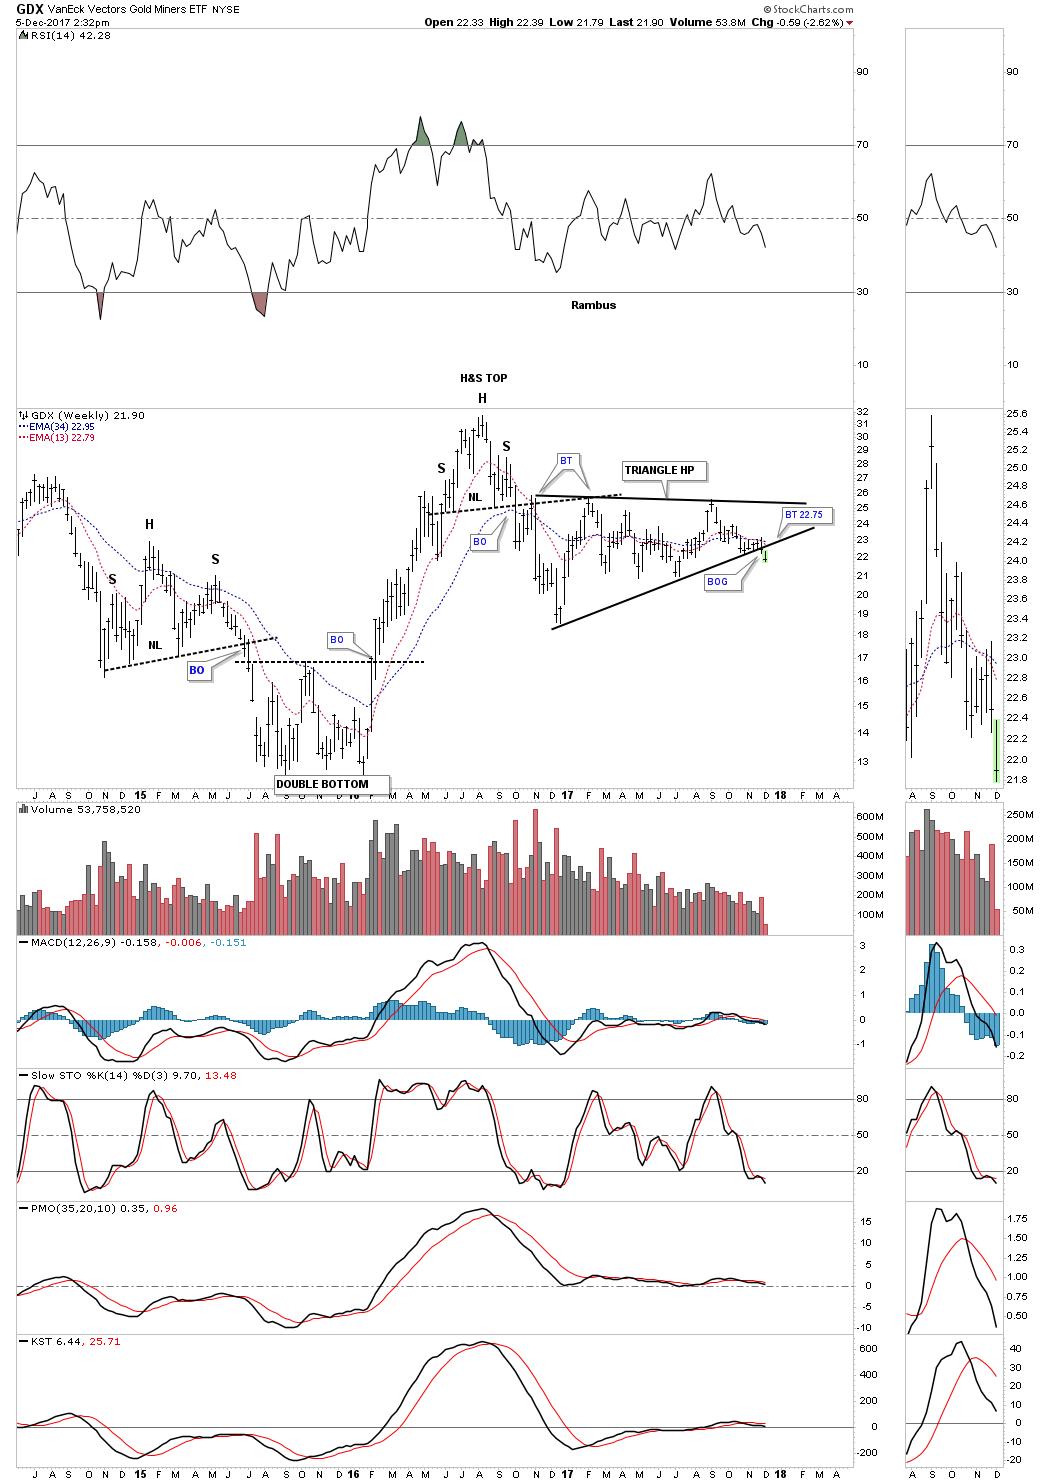
Until the bulls can take out the top rail of the downtrend channel the bears are still in charge.
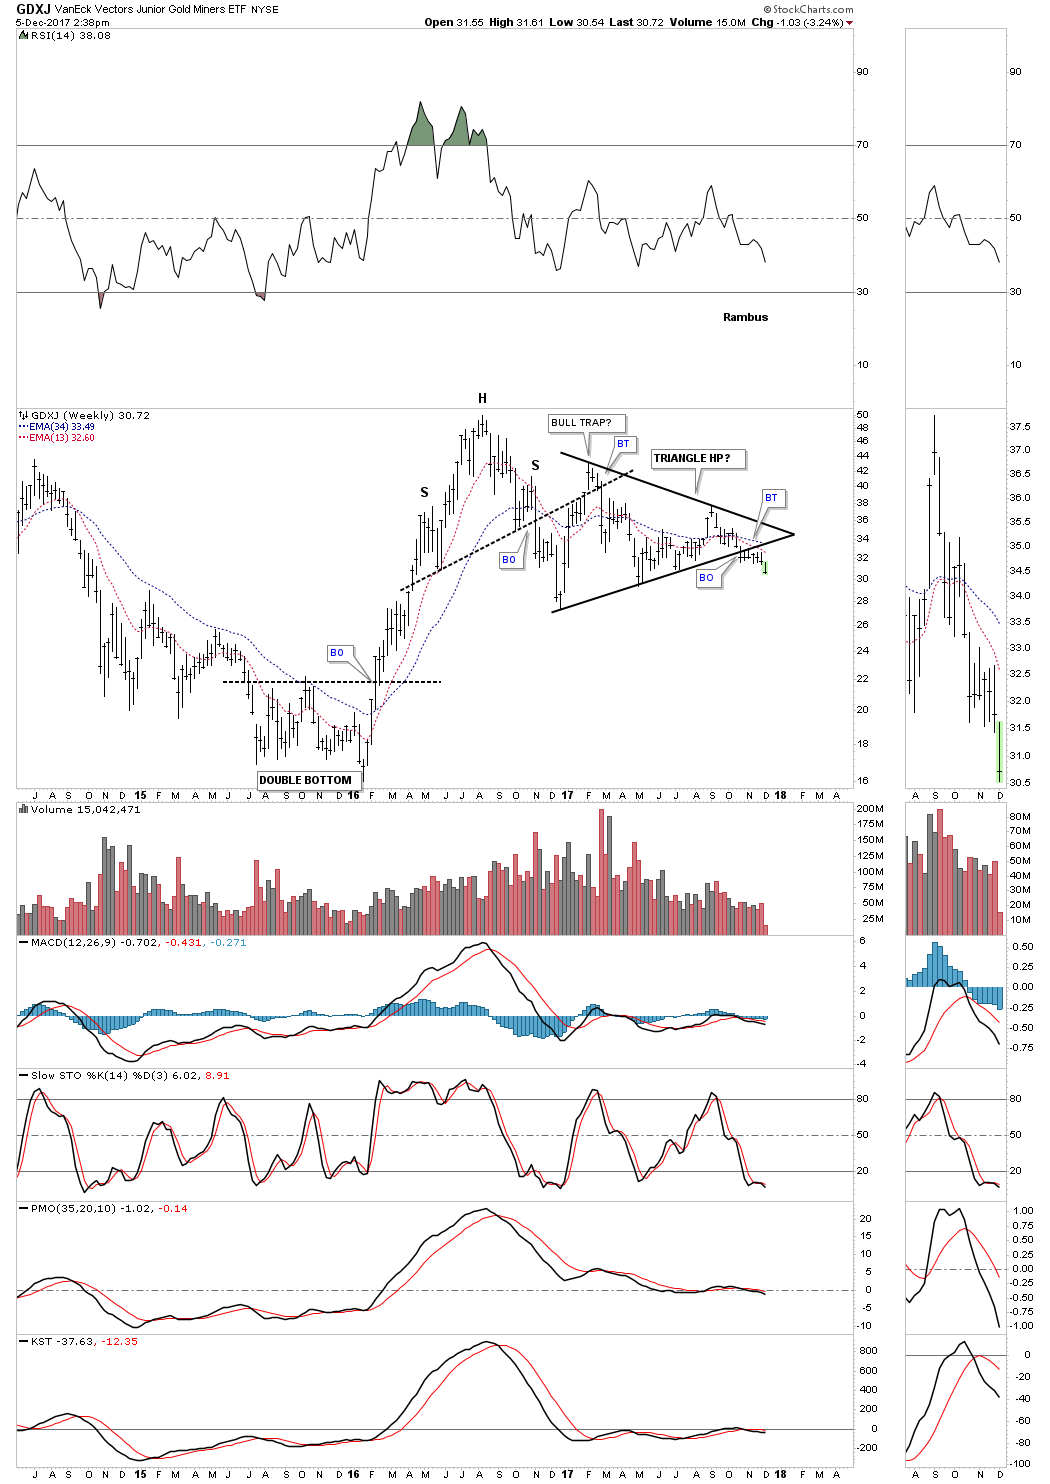
This short-term weekly chart for the GDXJ puts its one year triangle in perspective as a possible halfway pattern to the downside.
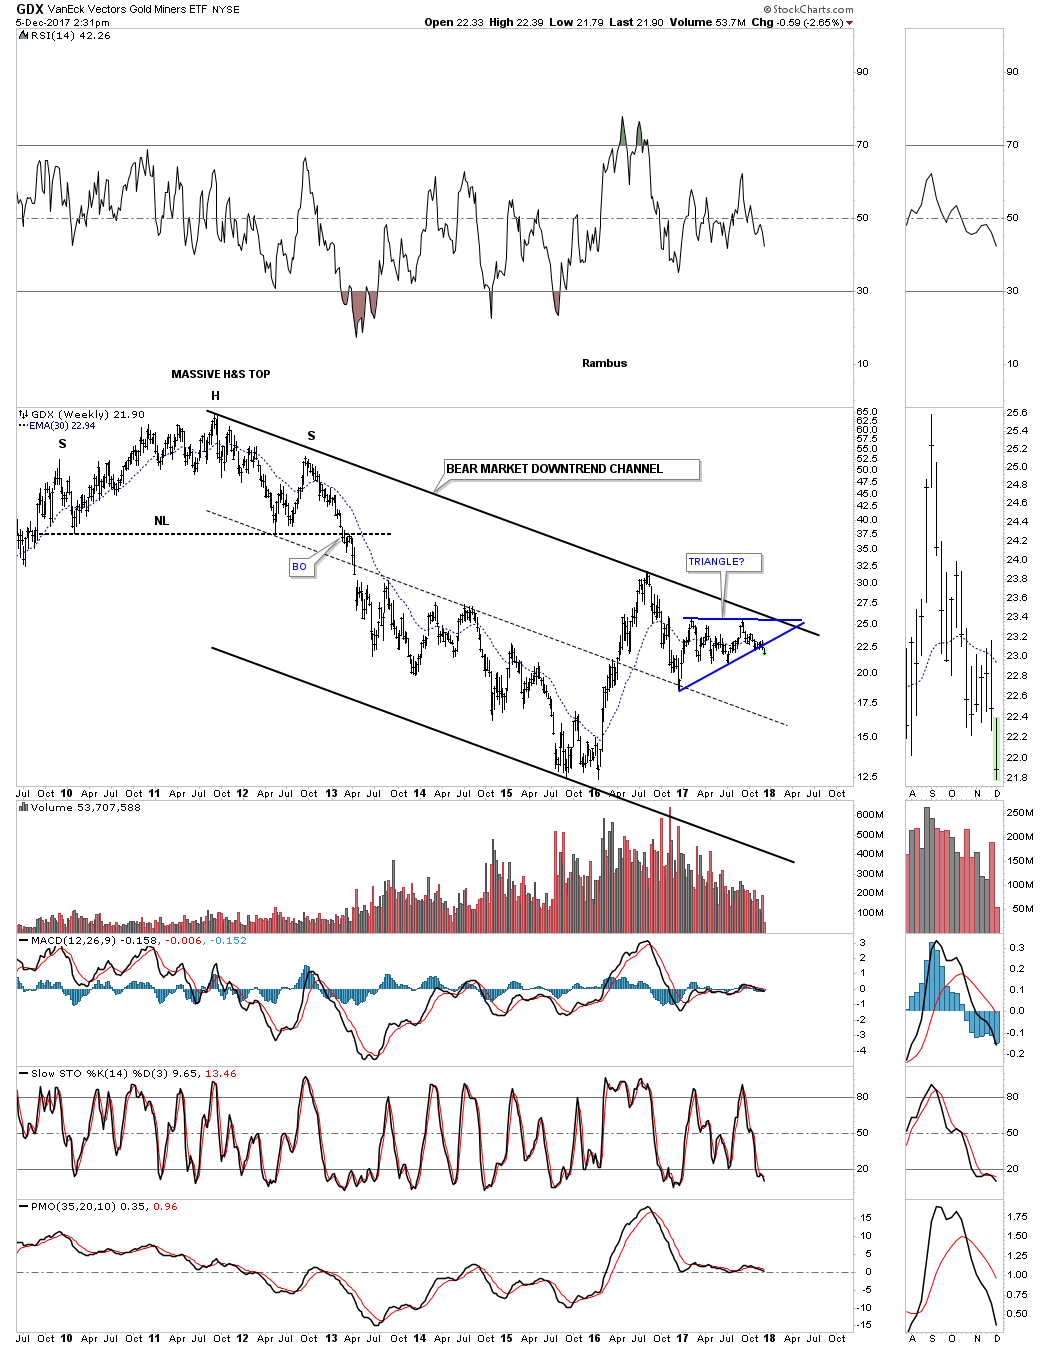
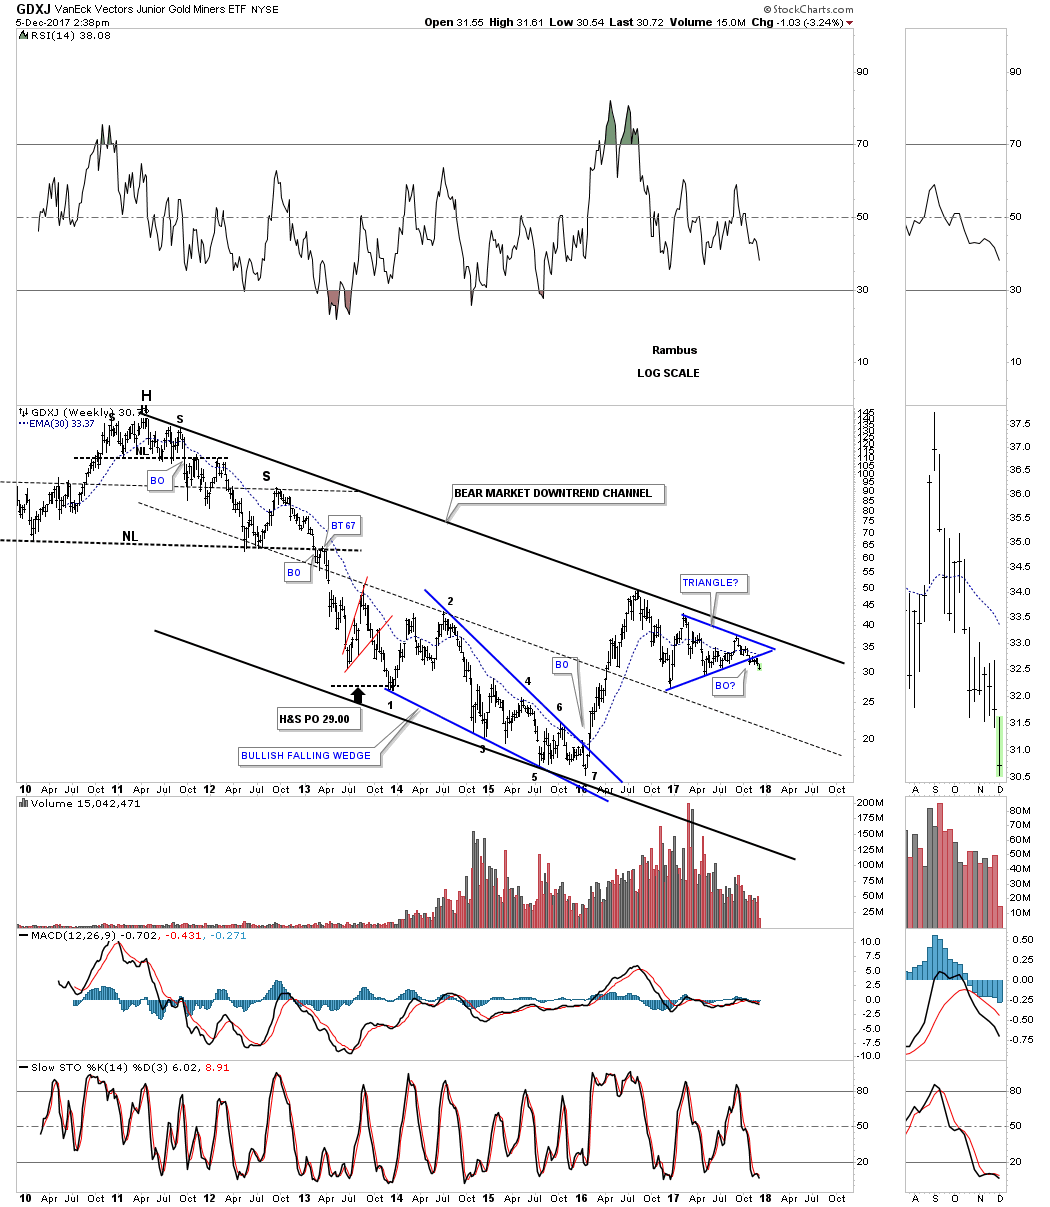
This long-term weekly chart shows how the triangle fits into the very big picture. Again all the bulls need to do is take out the top rail of the bear market downtrend channel and all will be right with the world again. As you can see they have tried three times in the last year and a half, but so far haven’t been able to do it.
*********
 Meet Rambus, a seasoned trader and technical analyst renowned for his unbiased and insightful chart work. Through his website, Rambus Chartology, and Substack newsletter, Rambus shares his expertise with a global community of subscribers, providing daily updates, commentaries, and hands-on training in the art and science of chartology. With his calm, humble, and down-to-earth approach, Rambus demystifies complex market trends, helping his followers navigate the challenges of today's volatile markets. Join the Rambus Chartology community today and discover a unique blend of technical analysis, trading expertise, and time-tested protocols. Subscribe now at www.rambus1.com or https://rambuschartology.substack.com/
More from Gold-Eagle


