Gold And Silver 7-Year Bearmarket Phase Is Over
 share
share
 share
share
 share
share
 share
share
 share
share
Thursday last week was a momentous day for the Precious Metals sector with gold, GDX and other índices, and giant gold ETF, GLD all breaking out on impressive volume, and this development was all the more extraordinary because it happened when the broad stockmarket was crashing. This is viewed as a strong sign that instead of being dragged lower still by a crashing stockmarket, the PM sector will soar. Silver hasn’t broken out yet, but it should soon follow suit.
In recent weeks we have been wary that, despite highly favorable COTs and Hedgers charts and rotten sentiment indicators etc, a general asset liquidation might drag the PM sector even further down, but Thursday’s extraordinarily positive action by the sector serves to allay those fears. Of course, it’s not hard to see why the PM sector might do the opposite to what it did back in 2008 when the market crashed, and it nosedived too. There are two very big differences this time. One is that, before the 2008 crash, the PM sector was actually quite elevated. That is in marked contrast to now where it is beaten into the ground with sentiment in the basement – basically it is so unloved and neglected that the only way is up. The other big difference between now and 2008 is that while a major asset liquidation cycle will result in a flight to cash that could drive the dollar significantly higher, beyond that the longer-term outlook for the dollar is grim, with much of the rest of the world, tired of US bullying in the form of sanctions, military threats, and now trade wars, and its unquestioning support of rogue states like Saudi Arabia and Israel, committed to freeing themselves from dollar hegemony – and plans in this direction are now well advanced, with countries like China and Russia having built up big gold reserves that can at some point be used to back their currencies, and workable substitutes for the SWIFT payments system at the trial run phase. Subjected to continuous provocation, China may at some point decide to go for the “nuclear option” and dump its huge Treasury hoard, sending the Treasury market reeling and interest rates skyrocketing, which will cause the US economy to buckle and implode – the US appears to be overlooking that China has this power.
Let’s now review the charts to assess the significance of Thursday’s breakout. We start with gold where we see on its 6-month chart that it staged an impressive high-volume breakout from a rectangular trading range that formed following the low in mid-August. Right up until the breakout the pattern was ambiguous with the price being pressured by the falling 50-day moving average, so that it could easily have broken down again. Thus this big up day, with the price breaking clear above not just this average but also the resistance at the top of the pattern, was certainly an event of significance. The minor reaction on Friday is normal and provided us with an opportunity to pounce on the sector, having grasped the magnitude of Thursday’s action.

We don’t need to dwell much on the latest COT chart for gold, beyond pointing out that it is the most bullish COT we have seen since 2001, with the dumb Large Specs actually shorting gold to a significant degree as of last Tuesday night. A chart like this means that gold has the potential for huge gains from here.
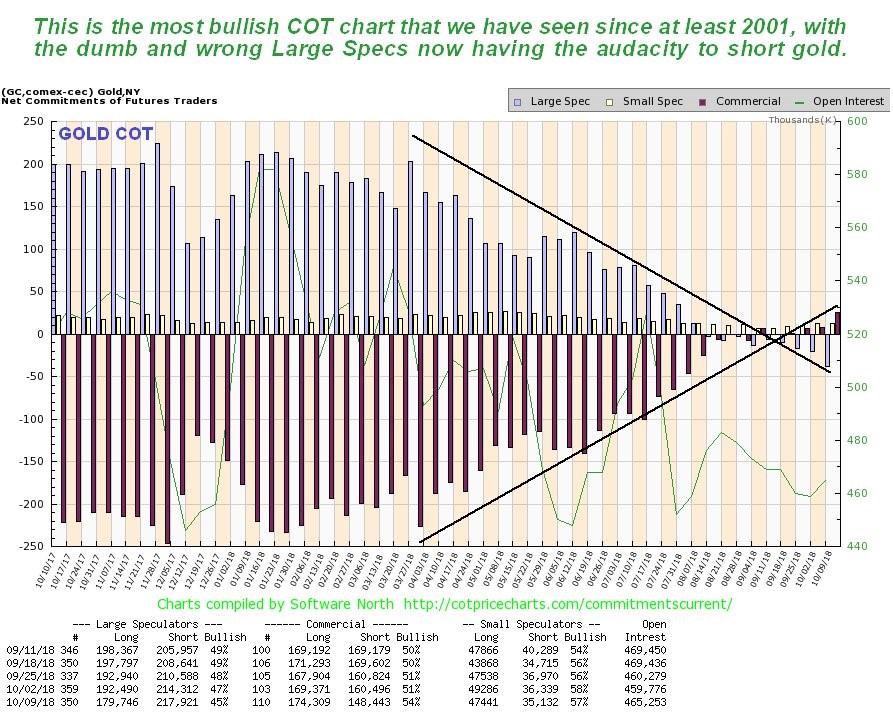
Click on chart to popup a larger, clearer version.
And how about this latest gold Hedgers’ chart – folks, it just doesn’t get much better than this (above the dotted green line is very bullish)…
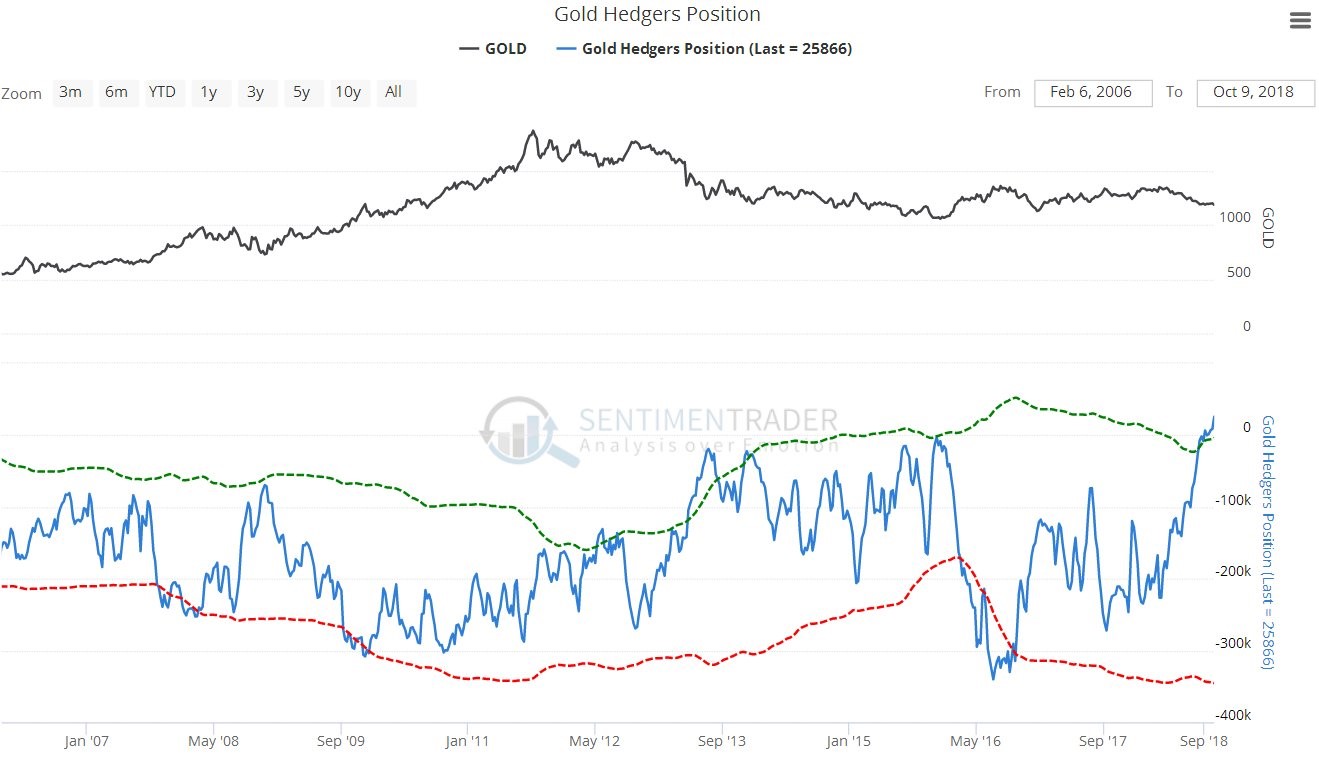
Click on chart to popup a larger, clearer version.
Chart courtesy of sentimentrader.com
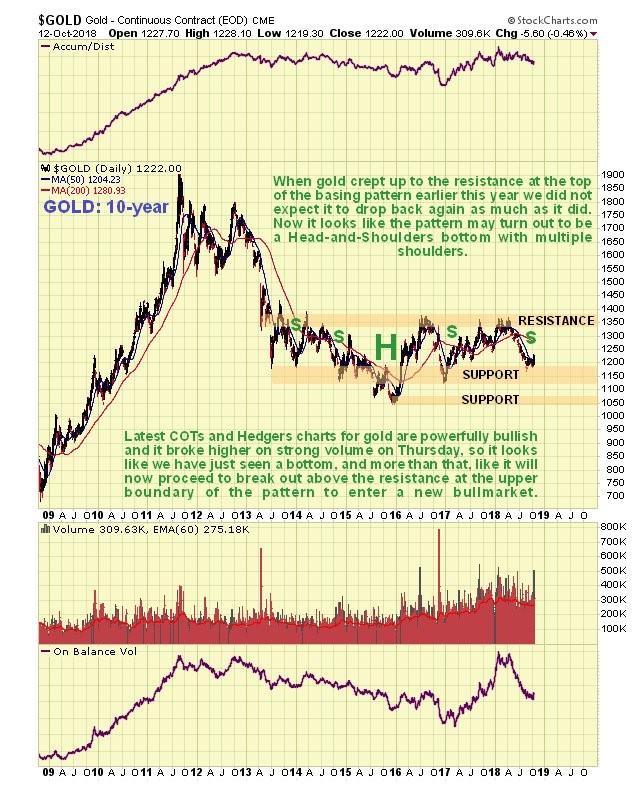
How does what is going on in gold’s chart fit into the larger picture? To get a handle on that we will now take an updated look at gold’s 10-year chart. You may recall that when gold crept up to the resistance at the top of the presumed giant base pattern earlier this year, we did not expect it to drop back again, or at least, not by as much as it did, but having dropped back more than we expected – and lambasted PM stocks in the process – it has arrived back in the broad zone of quite strong support shown. Now what appears to be going on is that it has just marked out another “shoulder” low of a complex Head-and-Shoulders bottom with multiple shoulders. Certainly, the now powerfully bullish COTs and Hedgers charts strongly suggest that it isn’t going any lower, and it was heartening to see that it was not perturbed at all by the broad market cratering last week – on the contrary, it loved it! – this is the strongest indication we could hope to see that this time, gold and the PM sector are going to go contra-cyclical and rally when the broad stockmarket drops, or during a general asset liquidation.
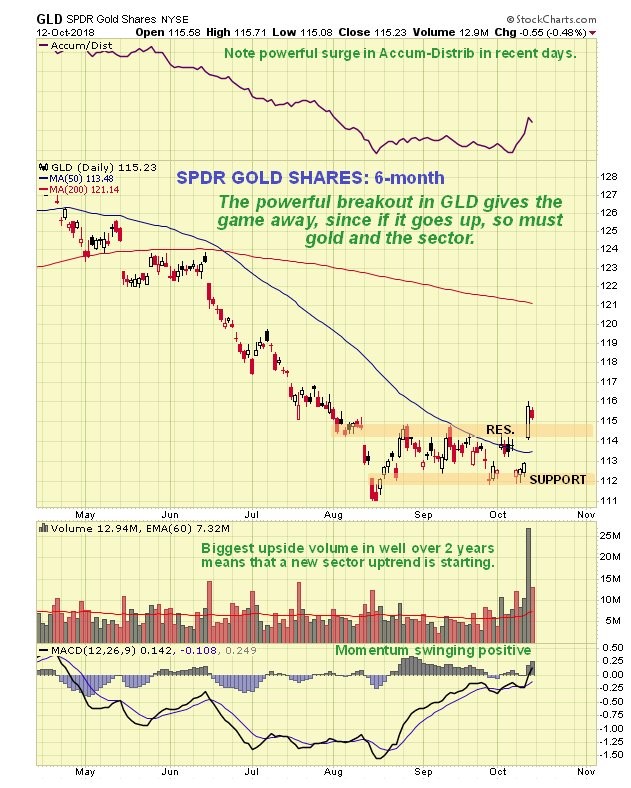
Emphasizing the importance of the breakout in gold on Thursday was what happened in the giant gold ETF, GLD, which acts as a massive conduit for investors in gold bullion. GLD gapped above its 50-day moving average on huge volume, the biggest in well over 2-years, and closed clear above the resistance level at the top of its recent rectangular trading range, like gold itself. This is viewed as very bullish action indeed and as a sure sign of a major trend change. Notice also how, as with gold, this breakout was preceded by a progressive easing of downside momentum as shown by the MACD indicator.
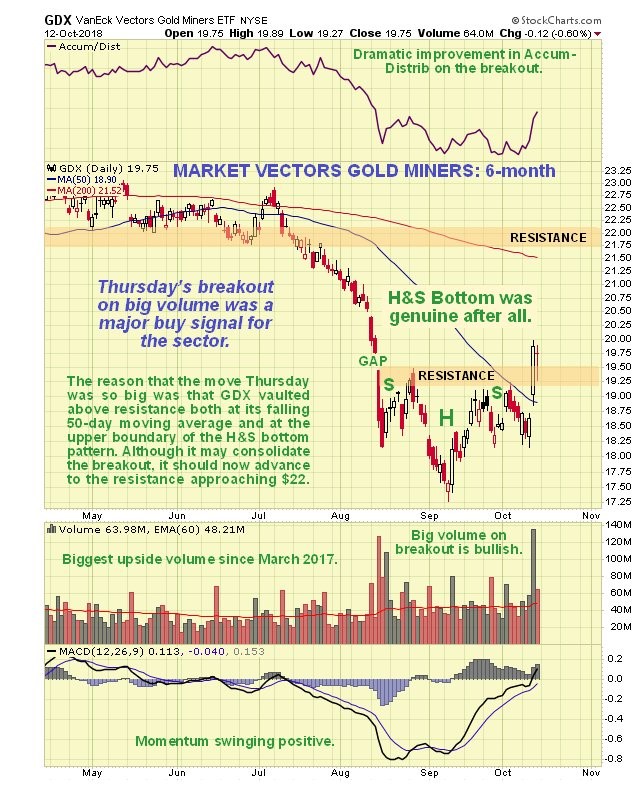
Now we come to the PM stocks’ big breakout on Thursday, which we will examine on the chart for GDX. Whilst we certainly recognized that the pattern forming in GDX was a potential Head-and-Shoulders bottom, we remained suspicious of it right up until the breakout for two reasons. One was the unfavorable volume pattern whilst it formed resulting in a weak accumulation line (which was also the case with gold and silver), and the other was the fear that PM stocks might be taken down by a crashing stockmarket – but happily the opposite seemed to be the case, with PM stocks seemingly thriving on the general mayhem – and why not? – as the most unloved sector around for years it’s time for a change of fortune. In any event, as you can see, what must have been an internal improvement ahead of the breakout was heavily camouflaged, which was why we didn’t buy ahead of it, but the big volume on this breakout, especially in GLD, means that it should be “the real deal” and not a deceptive pop, especially as it happened when the broad market tanked.
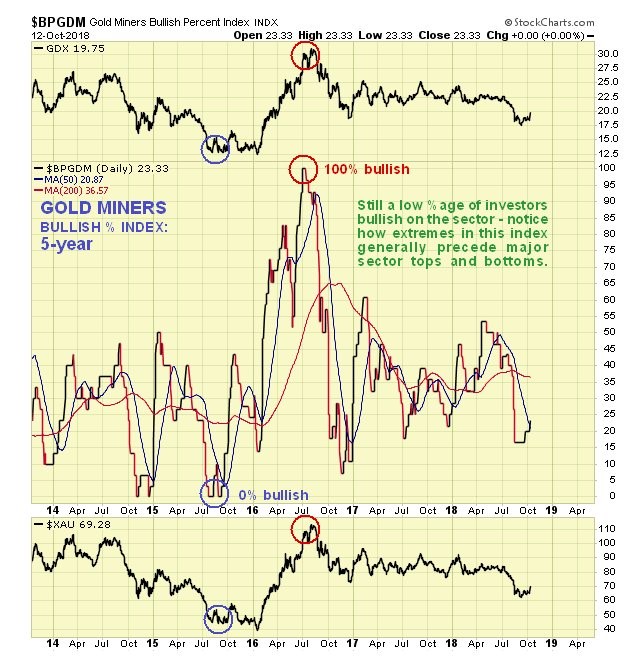
The latest chart for the Gold Miners Bullish % Index shows that there is still a low percentage of investors bullish on the sector, which is of course positive…
A very important point for would be investors in the sector to grasp is that you shouldn’t be put off by missing Thursday’s breakout and having to pay higher prices for most bigger gold stocks. They may in some cases be about 5% higher in price than they were last Tuesday or Wednesday, but that is NOTHING compared to the massive gains that these stocks are capable of making from here – don’t forget that this sector has been ground into the dirt by a 7-year bearmarket and has huge ground to make up, and the great news is that more the broad stockmarket gets clobbered, the higher the PM sector will go. Buyers now have the assurance of knowing not just that the sector has broken out, but also that it has the capacity to rally strongly when the rest of the market is cratering, as it has just demonstrated.
*********
share
share
share
share
share

Clive P. Maund’s interest in markets started when, as an aimless youth searching for direction in his mid-20’s, he inherited some money. Unfortunately it was not enough to live a utopian lifestyle as a playboy or retire very young. Therefore on the advice of his brother, he bought a load of British Petroleum stock, which promptly went up 20% in the space of a few weeks. Clive sold them at the top…which really fired his imagination. The prospect of being able to buy securities and sell them later at a higher price, and make money for doing little or no work was most attractive – and so the quest began, especially as he had been further stoked up by watching from the sidelines with a mixture of fascination and envy as fortunes were made in the roaring gold and silver bull market of the late 70’s.
Clive furthered his education in Technical Analysis or charting by ordering various good books from the US and by applying what he learned at work on an everyday basis. He also obtained the UK Society of Technical Analysts’ Diploma.
The years following 2005 saw the boom phase of the Gold and Silver bull market, until they peaked in late 2011. While there is ongoing debate about whether that was the final high, it is not believed to be because of the continuing global debasement of fiat currency. The bear market since 2011 is viewed as being very similar to the 2-year reaction in the mid-70’s, which was preceded by a powerful advance and was followed by a gigantic parabolic price ramp. Moreover, Precious Metals should come back into their own when the various asset bubbles elsewhere burst, which looks set to happen anytime soon.
Visit Clive at his website: CliveMaund.com