Technical Analysis Of The Markets


Current Position of the Market
SPX Long-term trend: There is some good evidence that we are still in the bull market which started in 2009 and which could continue into the first quarter of 2021 before coming to an end.
SPX Intermediate trend: New intermediate uptrend ending?
Analysis of the short-term trend is done daily with the help of hourly charts. They are important adjuncts to the analysis of daily and weekly charts which determine longer market trends.
Approaching an Important Target
Cycles: Looking ahead! 90-yr cycle – last low: 1932. Next low: 2022
7-yr cycle – last low: 2016. Next low: 2023
Short-term low: 1/18
Market Analysis (Charts courtesy of QCharts
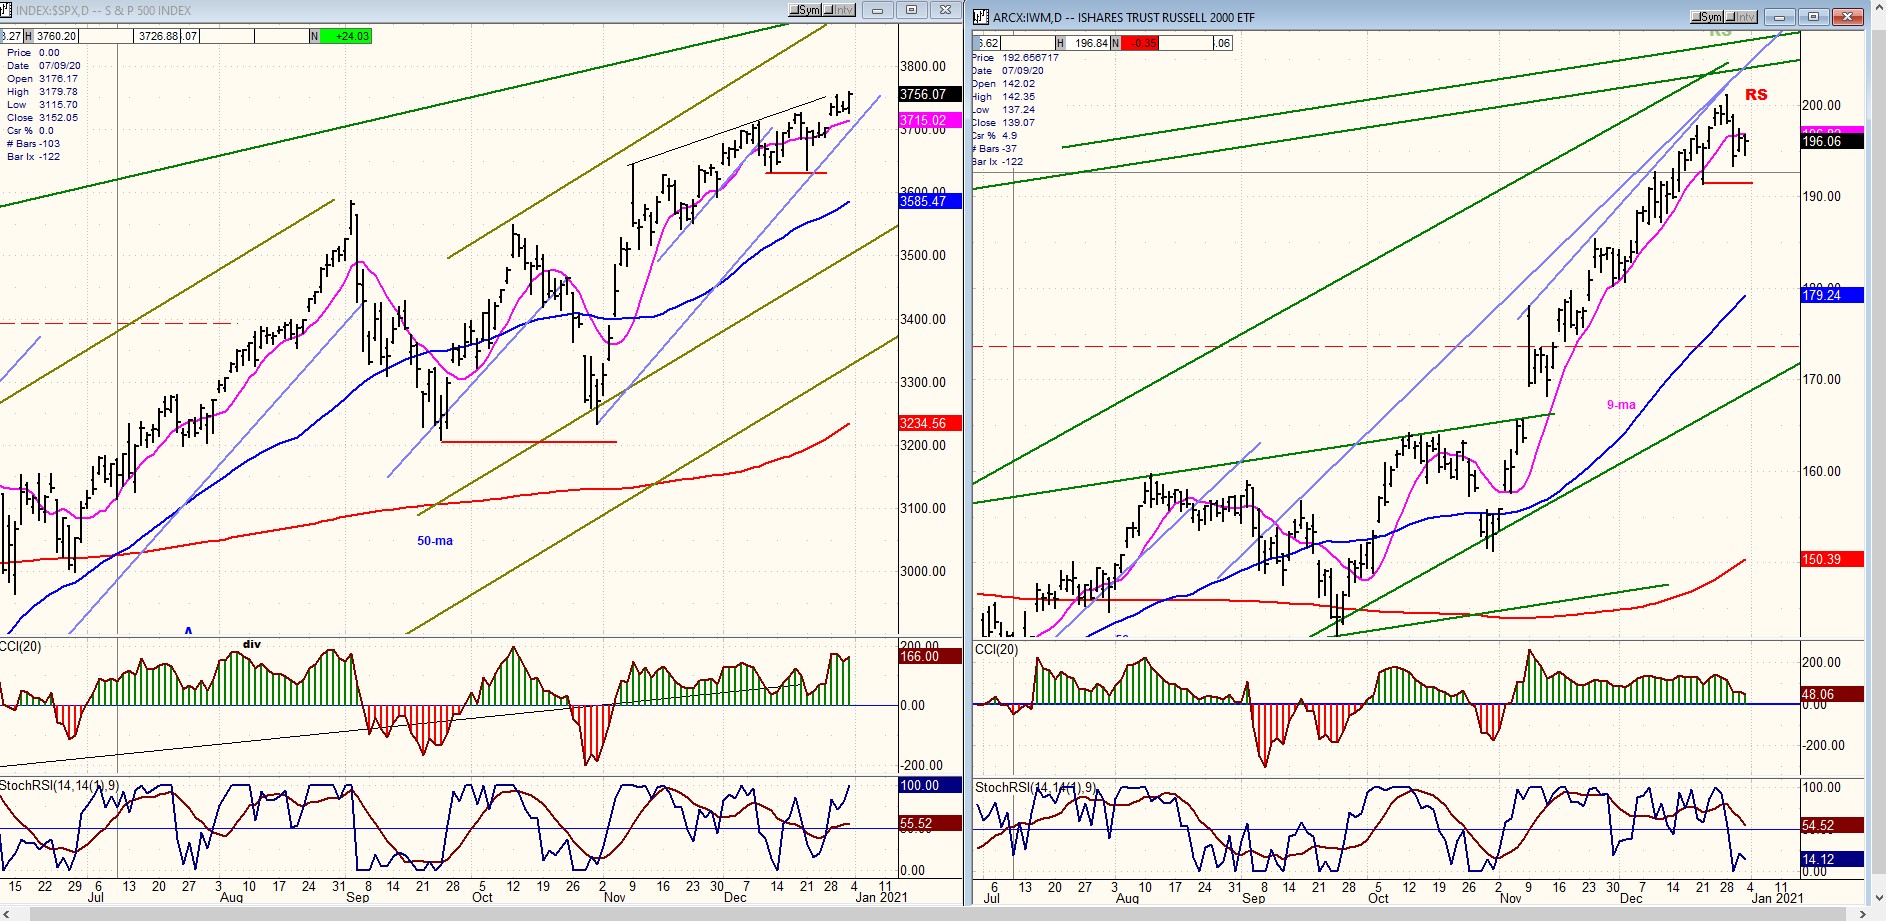
SPX-IWM weekly charts
For the first time since early September – the date when it issued its last warning of an important top -- IWM is showing relative weakness to SPX. This is a sign that we are probably reaching an intermediate top which should be followed by a correction. At the same time, SPX is drawing near its projection target of ~3770. The final high could come as early as next week.
This should be the first of three consecutive highs which could mark the top of the bull market. It should be followed by two more highs, the next at 4130 and the final one at 4550, the latter occurring around April or May 2021.
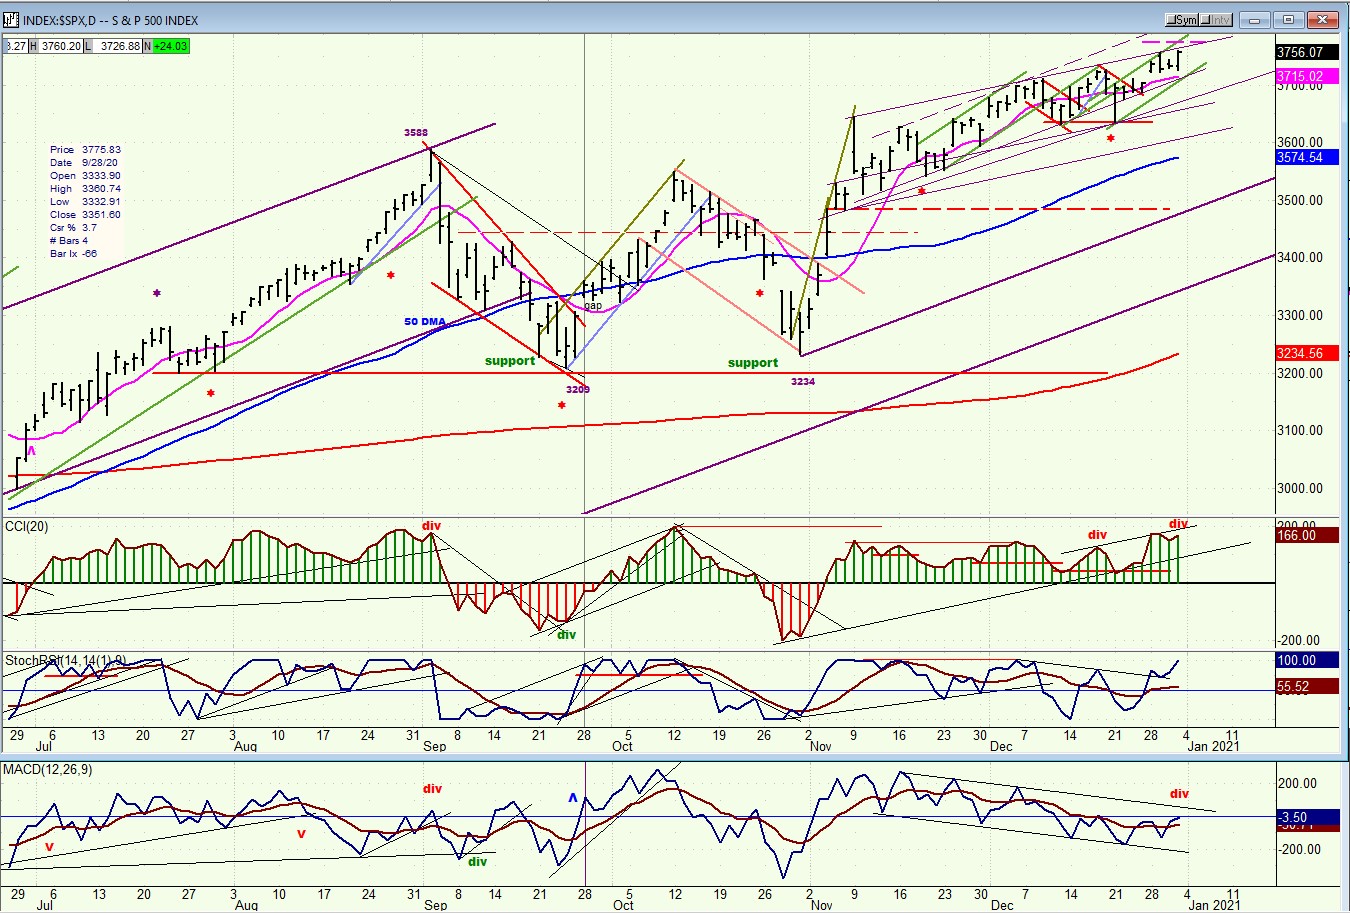
SPX daily chart
After SPX completed an a-b-c intermediate correction at 2234, it rallied sharply for a week and continued moving higher in a crawling pattern which has now lasted eight weeks and which appears to be coming to an end. As was mentioned above, SPX is close to reaching its 3770 projection (derived from one of the phases of the March low) and IWM is also signaling a market high.
The crawling pattern consists of consecutive small rising channels with the last one currently underway and taking the index to its anticipated top. The pattern from the November high can either be interpreted as a narrow channel or an ending diagonal which could retrace as low as one of the parallel trend lines drawn below during the correction. We will have to wait for a reversal to take place to see if the top P&F formation gives us a potential downside count for the pull-back. In the meantime, we can resort to the normal Fibonacci retracement levels of .382 (3568) or .50 (3504) to determine its extent.
Among the oscillators, only the A-Ds is showing important negative divergence. This suggests that the top could still be a few days away.
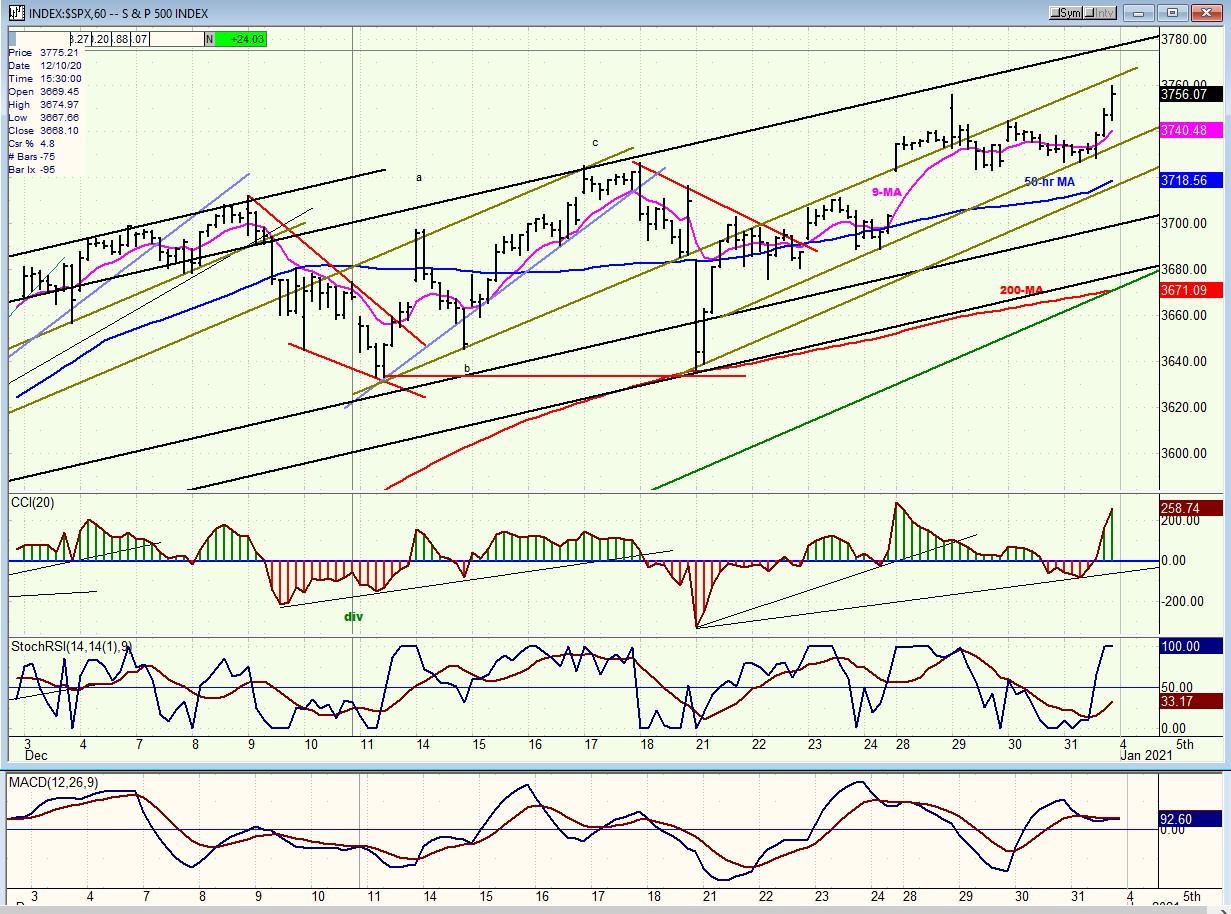
SPX hourly chart
My approach to trend analysis is multi-faceted and somewhat unconventional, using parallel lines to identify price channels as well as support and resistance areas, oscillators for overbought and oversold levels, and Point-&-Figure charts to arrive at projections. I adjust for various time frames, and this methodology seems to bring about satisfactory results.
On the hourly chart below, price is approaching resistance as the index is challenging the recent high of 3756. The momentum oscillators are overbought, but after Thursday’s strong move, show no negative divergence suggesting that SPX is likely to make a new high before topping. This is consistent with the P&F chart which calls for a move to ~3770 before reversing.
The odds that this will be an important short-term top, if not one of intermediate stature, is enhanced by the relative weakness exhibited last week by IWM vis-a-vis SPX. You may also recall that in last week’s letter I also mentioned that the DJTA had started to show some weakness. It does not hurt to have a little extra confirmation!
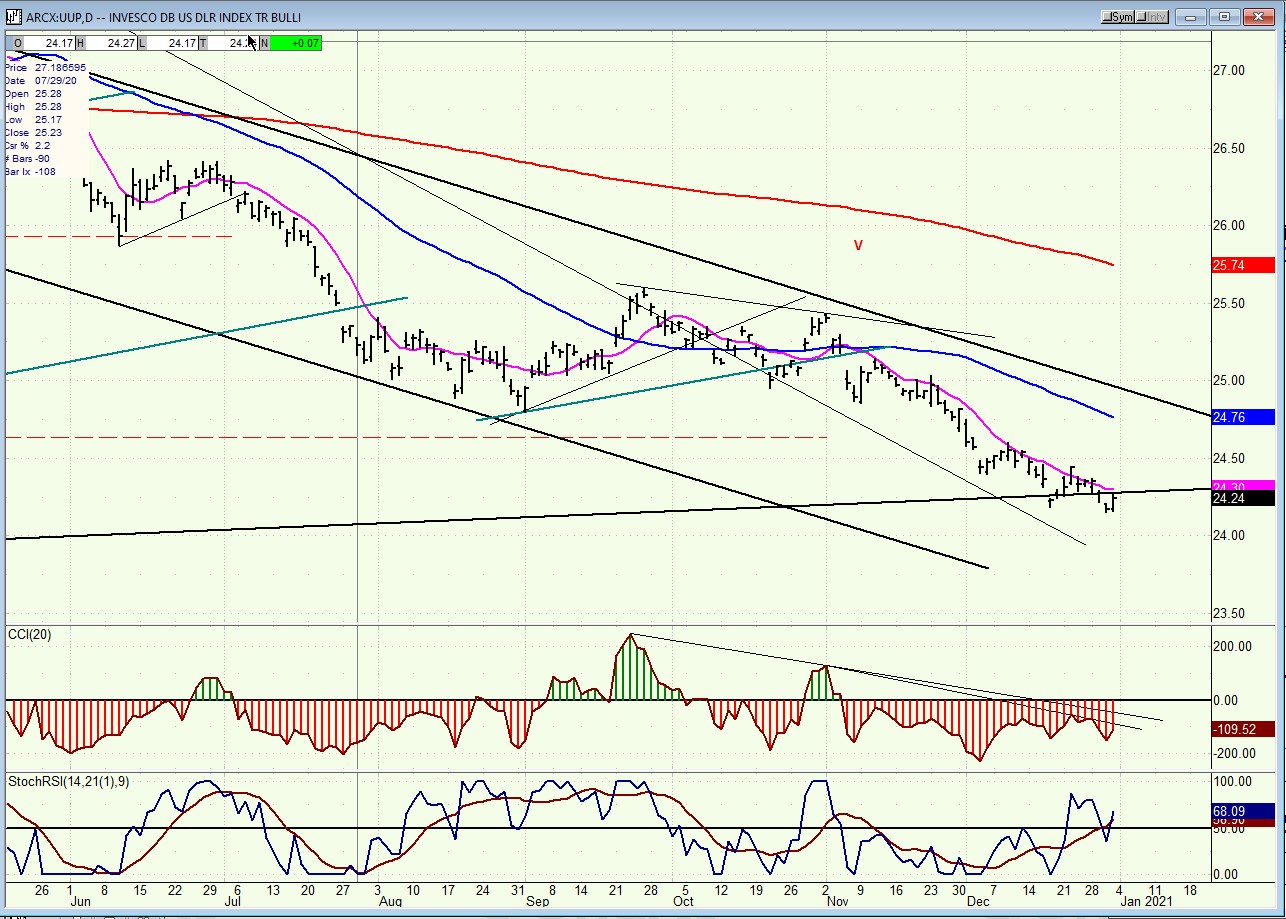
UUP (dollar ETF) WKLY ($USD chart not available from this data provider)
UUP is attempting to hold around a major lower channel line. A move back above the line could start a rebound to the 50-dma.
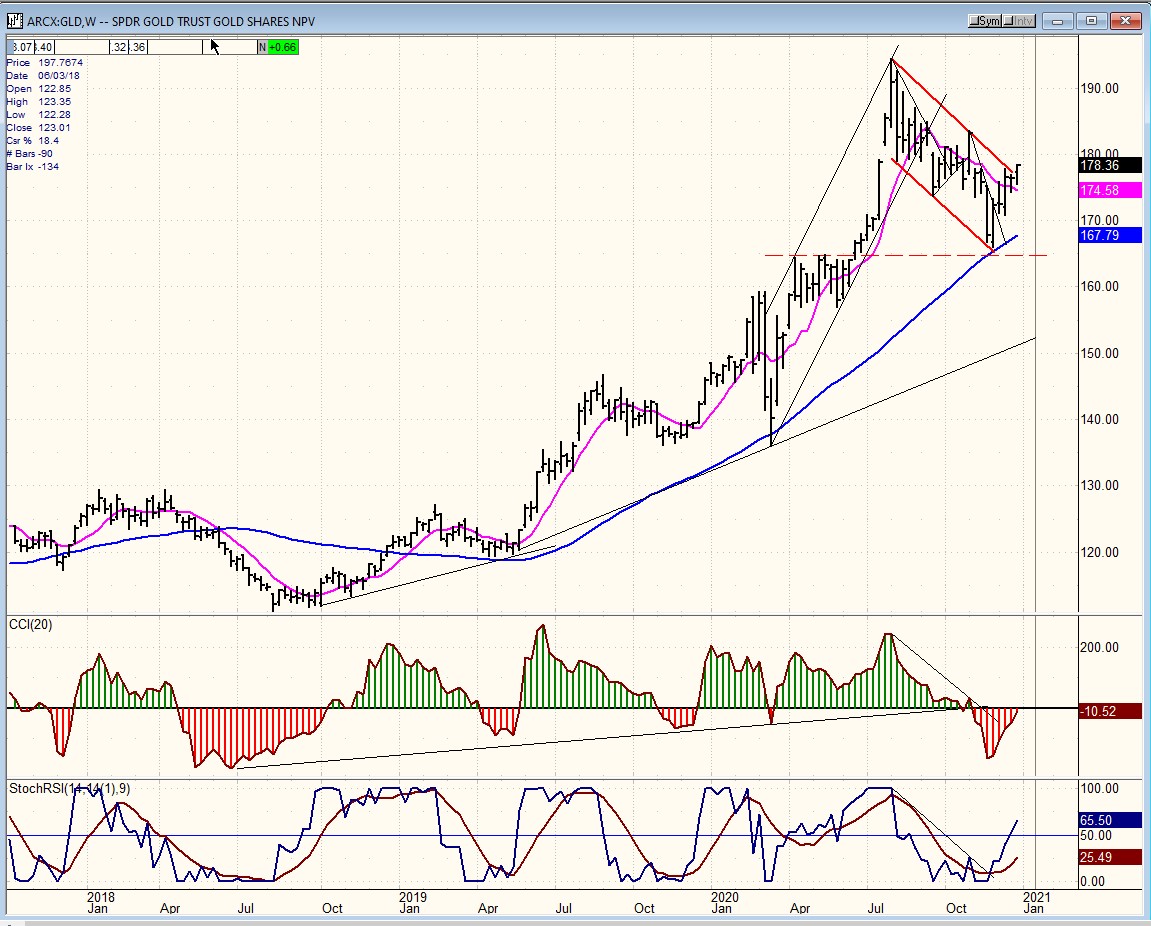
GLD (gold)-WKLY
GLD is challenging the top of its correction channel. It is not expected to make much more gain before retracing for some additional consolidation.
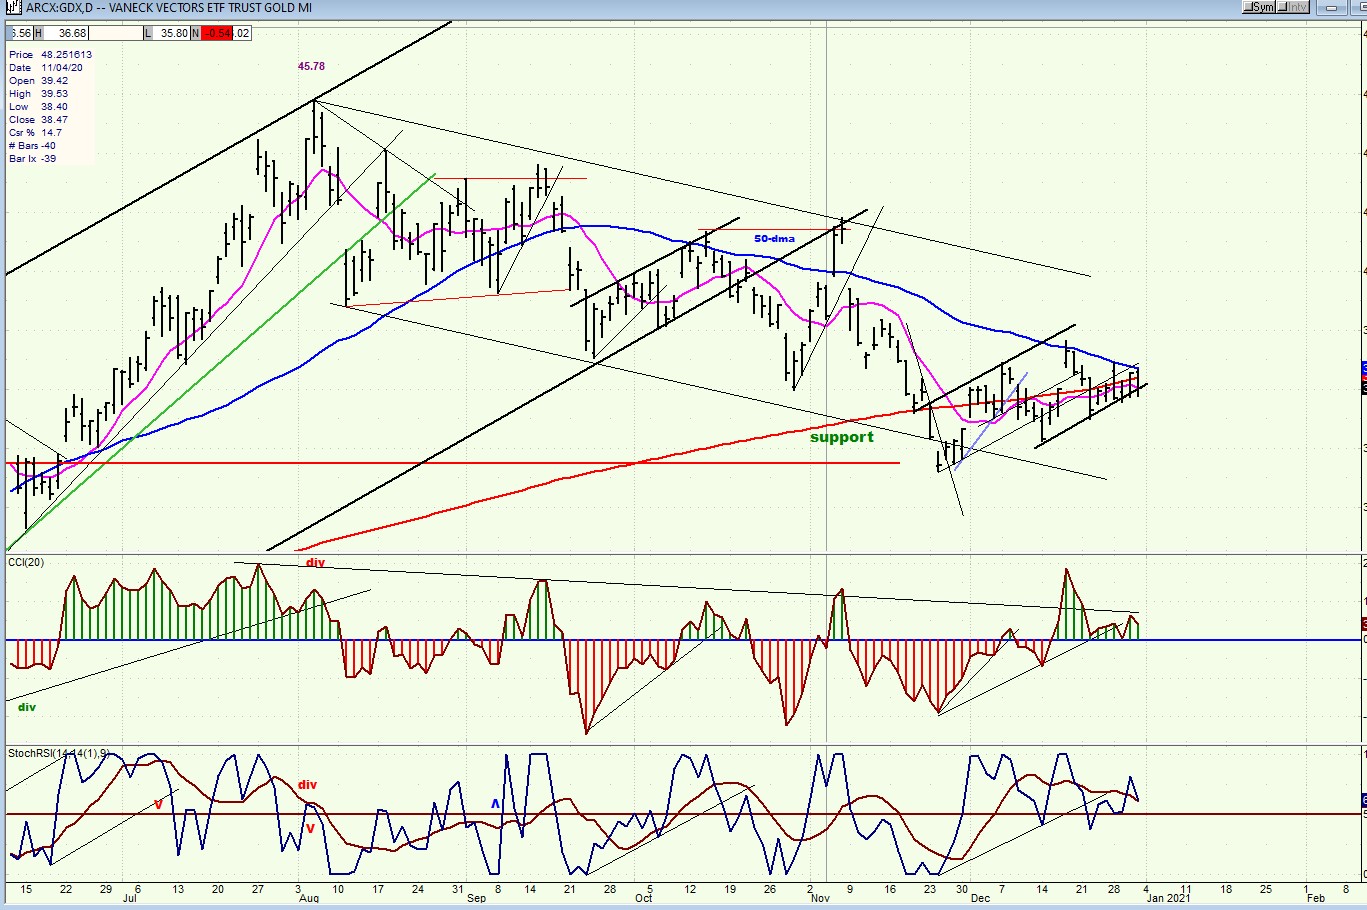
GDX (gold miners)-DLY
GDX has been arrested by its 50-dma. Additional consolidation which could lead to a retest of the recent lows is possible.
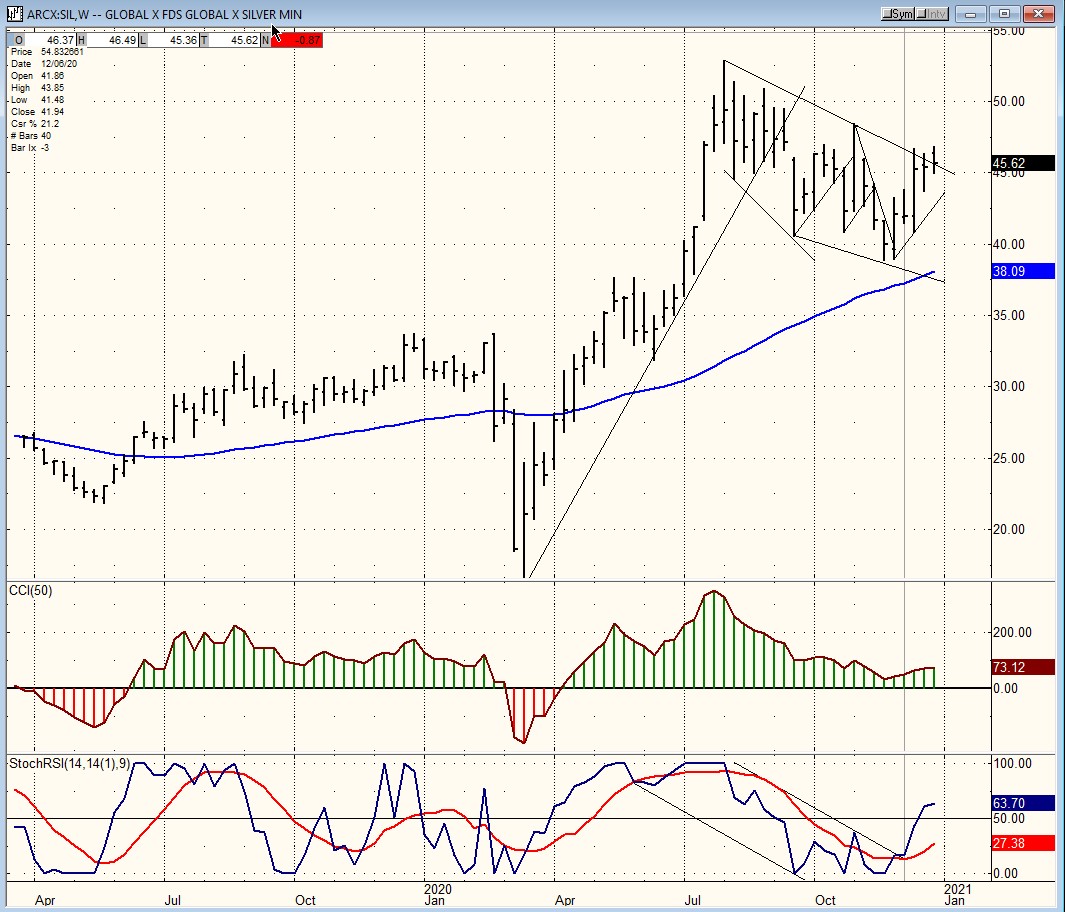
SIL (silver)-WKLY
Silver is also challenging the top of its correction channel but is likely to meet with resistance…and THEN pull-back to create a better consolidation pattern before starting on an extensive uptrend.
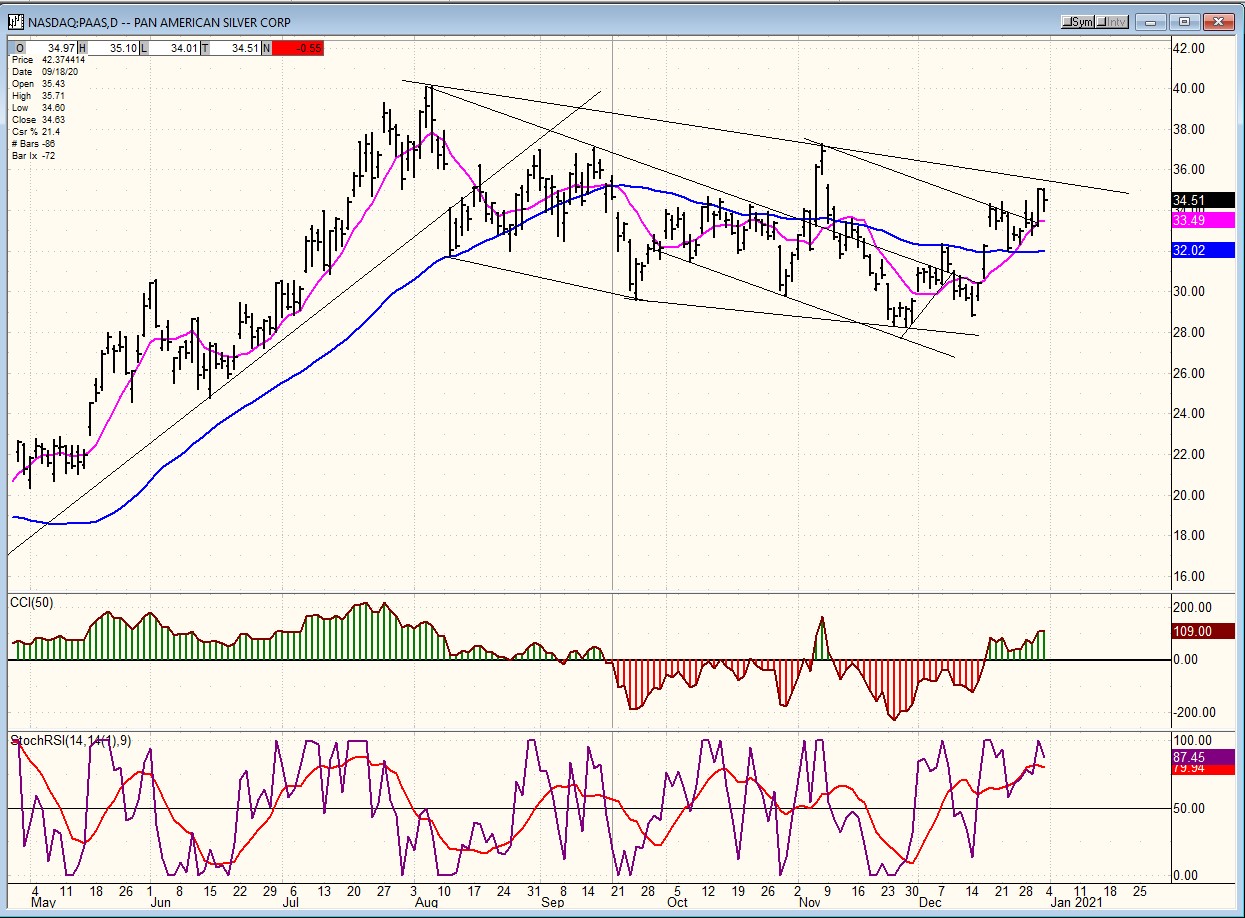
PAAS (Pan American Silver Corp-DLY)
PAAS has reached the top of its correction channel and should start to pull-back to create additional consolidation ahead of a resumption of its long-term uptrend.
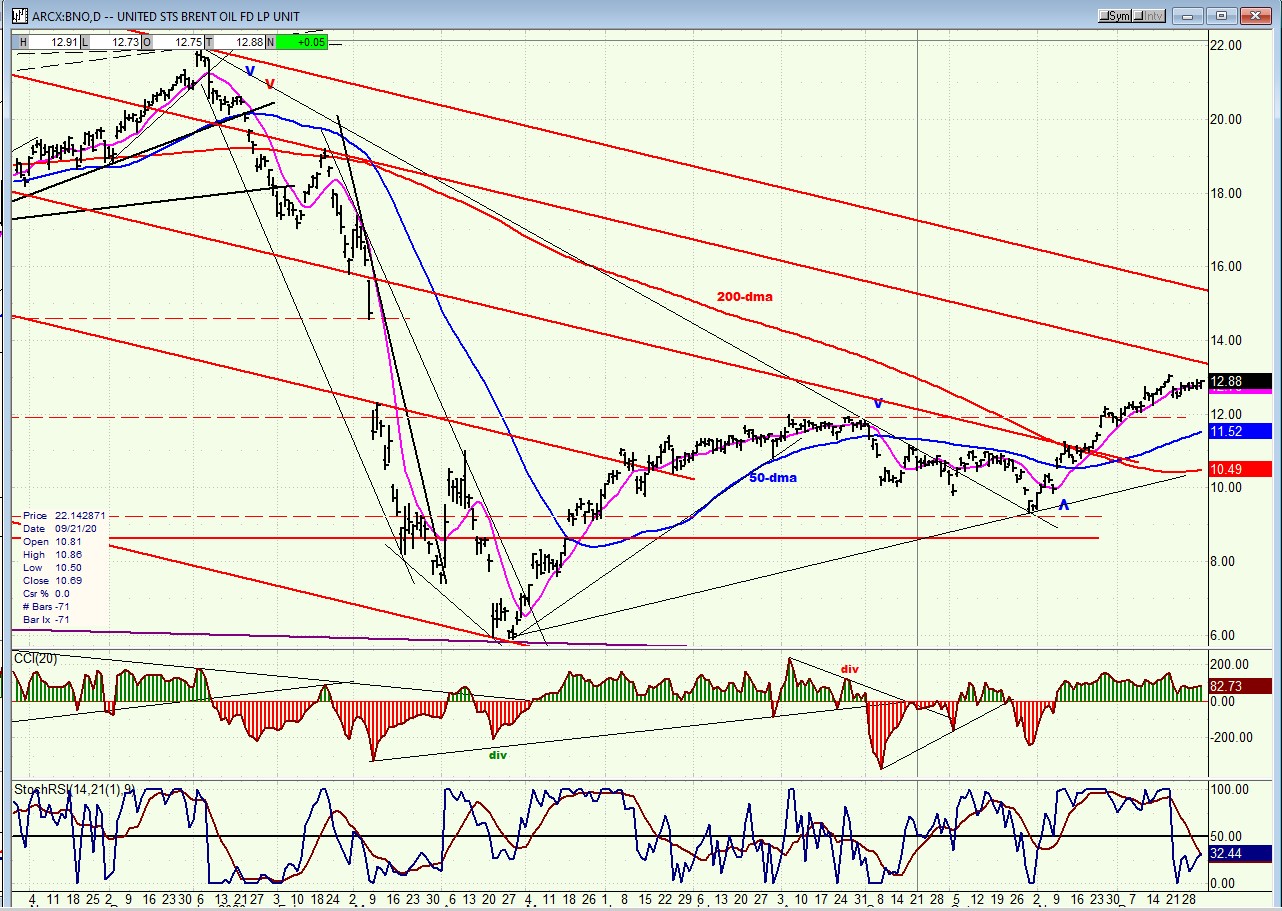
BNO (U.S. Brent Oil fund)
BNO is most likely making a short-term top which should be followed by a return to the dashed-line support.
SUMMARY
Warnings are increasing that SPX is near a price projection which should be followed by a retracement that could last several weeks.
Free trial subscription
With a trial subscription, you will have access to the same information that is given to paid subscribers, but for a limited time-period. Over the years, I have developed an expertise in P&F charting (price projection), cycles (timing), EWT (structure), and general technical analysis which enables me to warn subscribers of pending reversals in market trends and how far that trend can potentially carry. For a FREE 2-week trial, subscription options and payment plans, I encourage you to visit my website at
The above comments and those made in the daily updates and the Market Summary about the financial markets are based purely on what I consider to be sound technical analysis principles. They represent my own opinion and are not meant to be construed as trading or investment advice but are offered as an analytical point of view which might be of interest to those who follow stock market cycles and technical analysis.
********

When Andre Gratian was a stock broker years ago, a friend introduced him to technical analysis of the market. Consequently, it is not an exaggeration to say that Andre fell in love with this approach! Ever since then, it has become an increasingly important part of his professional life. Gratian has studied the works of Wyckoff, Edwards & Magee, Edward J. Dewey (cycles) and many others. However, one of my most profitable undertaking has probably been to study Point & Figure charting, which he finds invaluable in analyzing stocks and indices. If he were restricted to one methodology, this is the one that he would choose. This well-rounded background has given him what he feels to be a special insight into the stock market, facilitating the recognition of meaningful patterns and the ‘turning points’ in all trends, whether they be short or long term. Andre feels very comfortable discussing the stock market and passing on meaningful information to others. His subscribers include individuals and money managers throughout the world. Moreover, his Newsletters are currently published on several financial sites, here and abroad.


