Are Commercials Achieving Success?
 share
share
 share
share
 share
share
 share
share
 share
share
For a long, long time now, just when it looked as if the prices of gold and silver were breaking free and starting to fly – even with a 3-month rally last year – the hopes of the PM bulls have been brought back to earth by a realization the Cabal is in control. Any fresh hopes being dashed is nothing new; that has been happening on a large scale since the mid 1990s, when Clinton’s strong dollar policy became the credo that still underlies US policy despite changes in the White House. Early in 2021 the Big Shorts saw a new challenge appear, from the REDDIT Primates. With the real risk of a short squeeze in silver, they had to react and did so with a vengeance. Yet they are still at risk with a large net short position.
As discussed widely and in these pages for some months now, the Cabal is fully aware of the risk they are facing should they be caught heavily short at a time when silver is in short supply. Perhaps it happens because shifting of obligations for delivery over to London no longer works since buyers are no longer satisfied with paper promises, but want the actual metal. Perhaps a new crisis develops – whether this is in the financial or the physical PM markets does not matter – one that suddenly makes it important for investors to have actual metal in their own possession. Similar to what Basel lll is supposed to have done for gold, but this time it must be something with real teeth.
Fear of the risk of a short squeeze should something occur to reduce the availability of silver or to change investors’ willingness to accept paper PM metal for delivery, has seen the Cabal in high gear since early August last year to suppress the metal prices.
The first suppression campaign lasted from early August to March this year. Gold was taken down from a high of $2067 to a low of $1687 (-18.4%), while the price of silver lost slightly less, from $29.95 to $24.0 (-17.3%). Both metals then started a rally, to raise bullish hopes that the market would repeat what had happened in 2020.
The rally started off well; gold rallied off the low to $1903 (12.8%) while silver also did well, reaching $28.48 for a gain of 18.7%, to outperform gold. Which, of course, reawakened the fears of a silver squeeze. That triggered a new and determined effort to bring the PM prices under control. Gold reached a low of $1723, down by 9.5%, in mid-August while silver also bottomed then at $23.21 (-18.5%) to make it clear to investors that silver definitely was not going anywhere. However, silver joined gold in what could develop into a new rally, this while the Commercial net short OI of silver was still too high for the Big Banks to become complacent, as described last week.
Despite the initial larger decline in the price of silver, its price came under renewed pressure last week to reach a low of $22.395 – as was anticipated in last week’s USM, because the Commercial net short OI had not responded as the Big Banks had wished.
As shown later, the price of silver has held and bounced a little off tentative technical support, but what happens next depends very much on how successful the strategy of the Big Banks to sucker the hedge fund algos into a short position turns out to be.
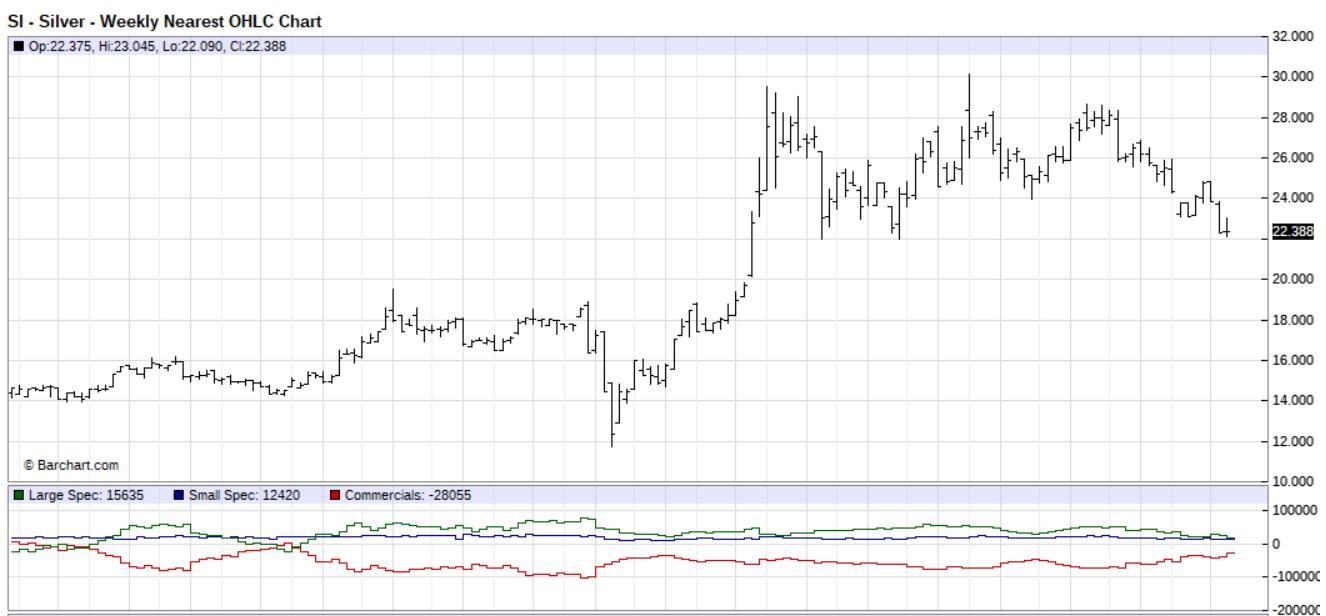
The weekly Barchart shows the new low in the price of silver, lower than the earlier gap island low which has clearly failed to hold. Two weeks ago the Commercial net short position was 43 252 and a week ago this had improved only slightly to 40 156, despite the renewed attack on the price. Last week’s intense suppression therefore came as no surprise, but the Commercials must be heaving a sigh of relief as their net short position on Monday – always a week behind to keep investors in the dark – had declined substantially to 28 056.
As is to be expected, the decline in the net long position of the hedge funds (Large Specs) made the change in the Commercial position possible. Recent changes in the net long position of the Large Specs are from 28 556 on 6 September to 26 676 on the 13th and then 15 635 on the 20th. The decline in the Commercial CoT net short position in silver is 12 100 while the Large Spec net long position is lower by 11 041. The Small Spec net long position fell from 13 480 to 12 420 to cover the difference.
The balance in the changes implies that the overall open interest in silver would not have changed by much at all: On September 20, the time of the last CoT report, the silver OI was 144 257 and on Friday’s preliminary report it is 144 096, having hardly changed during last week’s raid on the price. Of course, we have to wait until next Friday to find out how the net long and short positions changed during this recent raid on the silver price.
The decline in the Commercial net short position between the two recent CoT reports was substantial, being nearly 30%. Whether a net short position of 28 056 positions will be sufficient to pacify the Big Banks is an open question. They must have memories of September 2018 when their net long position briefly was less than
10 000 contracts and that might be the target they have set for this near desperate raid on the price of silver. So again we should not be surprised if the raid continues this week.
However, rational behaviour of the Big Banks – if they succeed in reducing their net short position even further, perhaps to 2018 levels – would be to accept the facts of life and actively enter the market as aggressive buyers in an attempt to become net long in the market. At least, that would be in terms of the facts as discussed above.
There is, however, a 800 pound gorilla in the room, consisting of all the paper silver stored in London given the use of EFPs for both silver and gold. If these certificates truly represent actual metal in the vault as implied by their name, there will not be problems. However, given one’s perceptions of the duplicity in the PM markets, there is a distinct possibility the EFPs in reality should be described as Exchange For Paper and not for Physical. If the price of silver – and/or gold – really takes off and investors try to obtain full delivery of their EFP silver or gold when prices may have doubled, it is certain they will be told Force Majeure is invoked with investors to be paid in cash.
This particular gorilla could be the primary reason why the prices will be suppressed for as long as at all possible; until Comex gets crushed between a rock and a hard place and has to own up about the fraudulent situation, thereby to lose all credibility as a futures exchange.
Meanwhile Wall Street is on a mission of its own to prove that the talk about a really improving economy is not just hot air. Like the PM market, the stock market and also the dollar, are hovering at levels that in due course should prove untenable. Given a rogue dollar printing press spewing out trillions of currency into a consumer market that suffers from a range of constraints on the production of consumer goods, prices are bound to range higher in non-transitory fashion. The time is bound to come when all the helicopter money is no longer sufficient to sustain the illusion of new highs on Wall Street and a dollar happily holding above 93 on the dollar index.
The picture of being trapped between a rock and a hard place again comes to mind.
Euro–Dollar
The chart of the euro is one a few in this report to show minimal change from where the markets had closed last week. The euro last week lost only $0.0005 from the $1.1724 where it had closed the week before, when it had held at the support of line S. Early last week the euro dipped lower, but managed by Friday to recover close to the bottom of its bull channel KL.
In terms of the technical system used for the analysis, two possibilities remain: firstly is that the recovery back to line L happens to perform a ‘goodbye’ kiss on the trend line, before the recent weaker trend resumes and extends.
Alternatively, the break below line L was a brief excursion to meet and confirm some other significant support level that is not defined in this analysis – either because it does not form part of this analysis or because it is derived from another master gradient than the one used here. It is not yet possible to distinguish which it will be in this instance, but by early in the new week the new direction ought to be revealed.
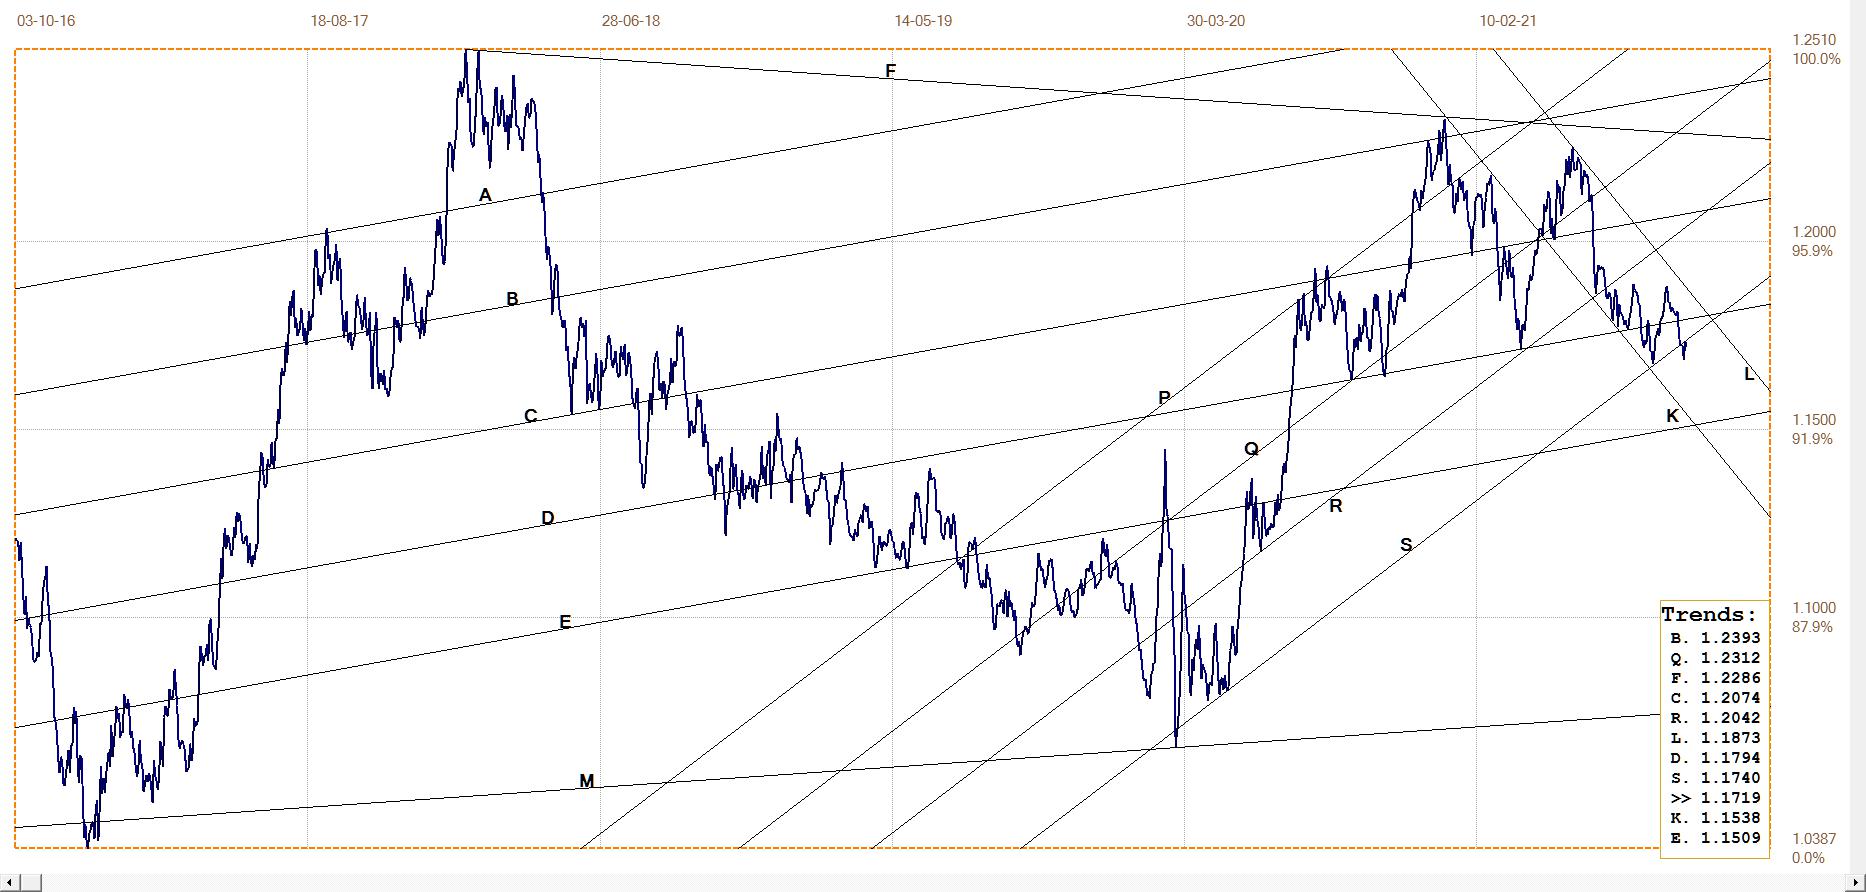
Euro–dollar, last = $1.1719 (www.investing.com)
DJIA daily close
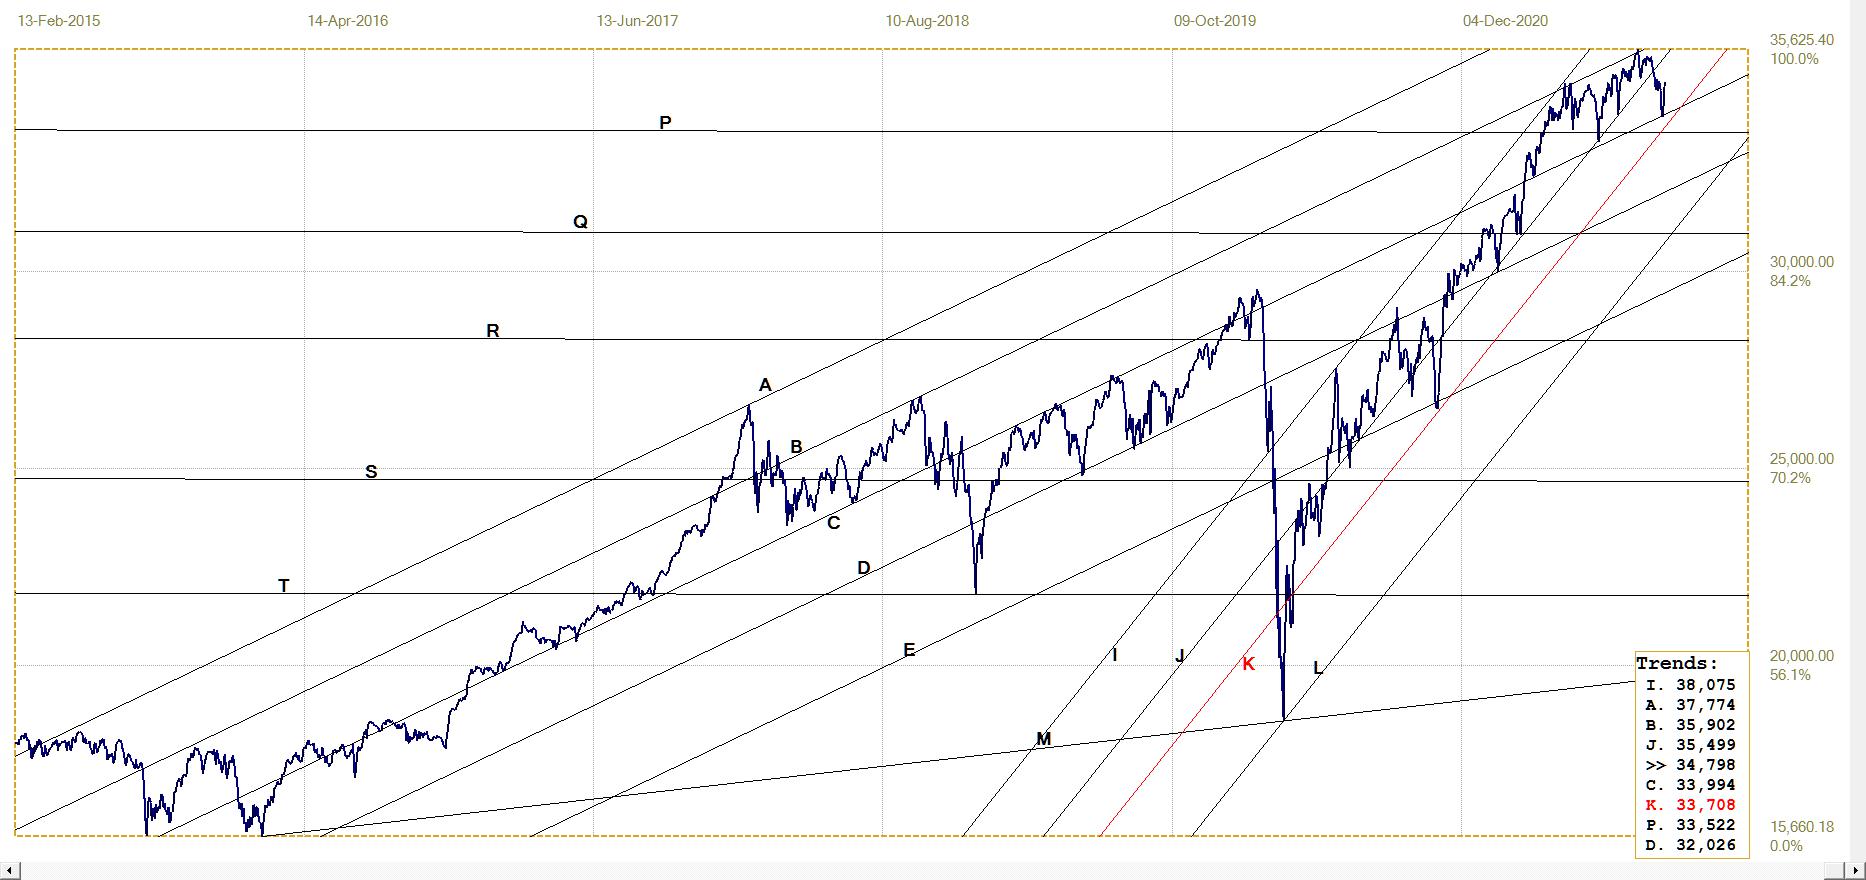
DJIA. Last = 34798.00
Gold London PM fix – Dollars
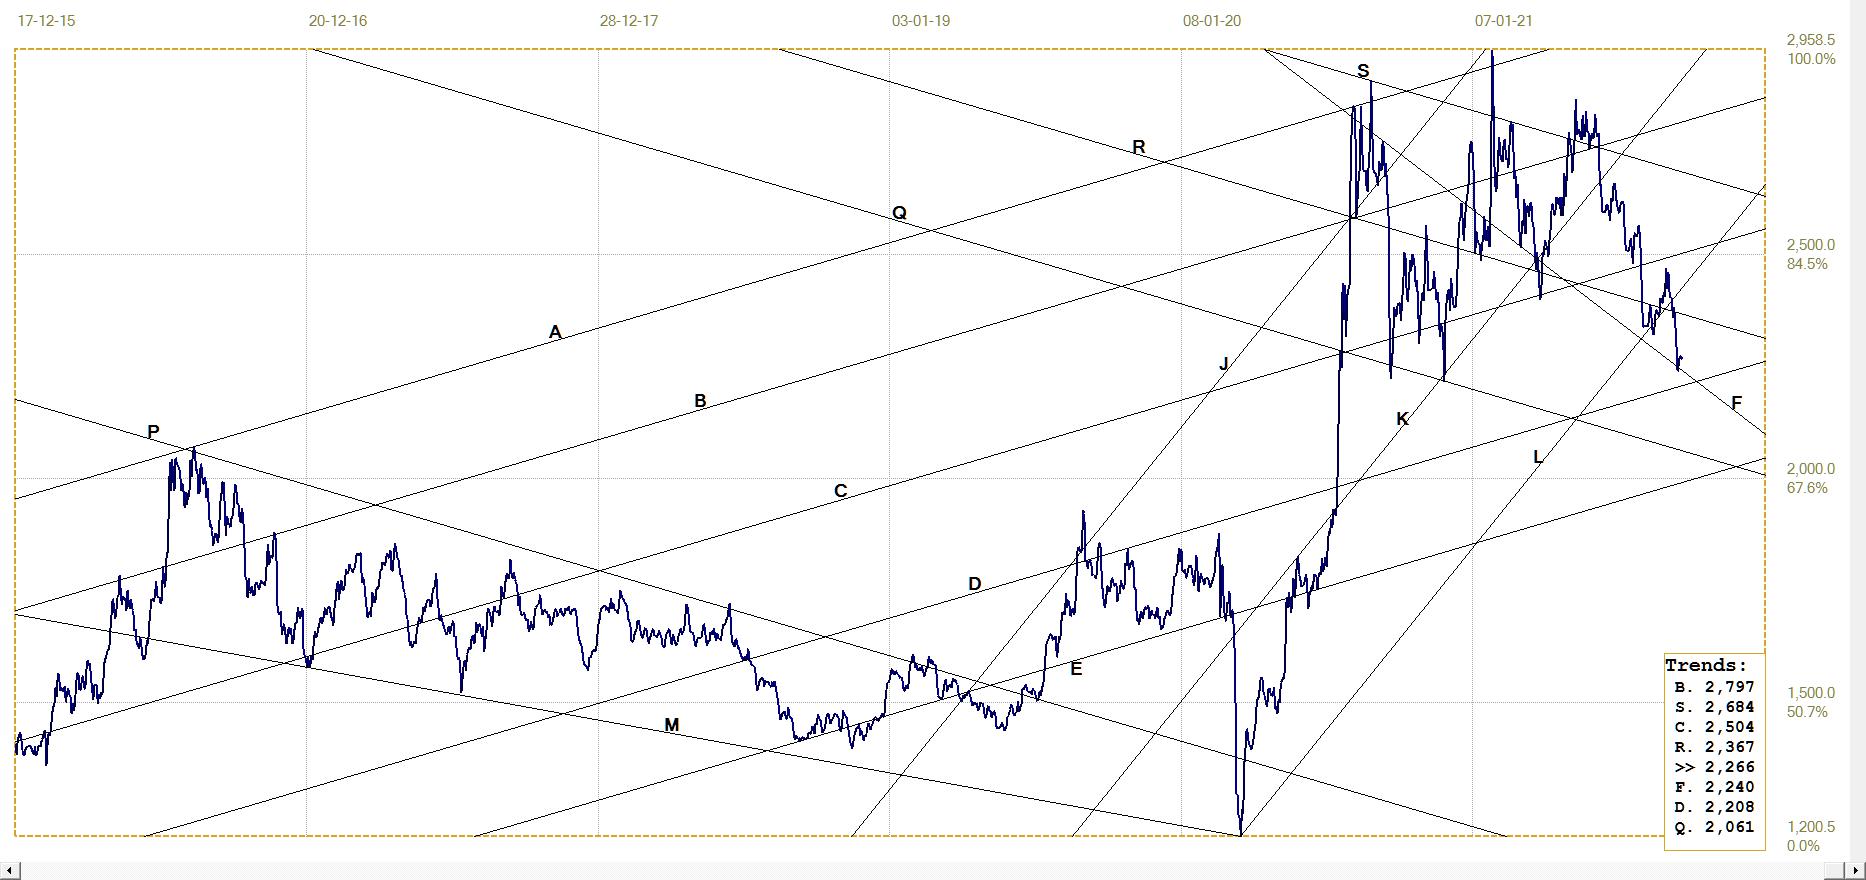
The London PM gold price fix has now broken a third time below the main bull channel PQRS. On the previous two occasions, the price held at and reversed higher again off the new trend line T. During the current sell-off, the price on Thursday of the previous week rebounded off line T, but then last week it dipped lower again to be fixed a little below that support on Friday.
We now have to wait for this week to find out whether the break is merely a minor overshoot or a signal of a further decline to come. From the earlier discussion there are reasons to sustain the pressure on the PM prices – not that gold is presumed to be really close to a potential short squeeze, but in order to add more pressure to the price of silver.
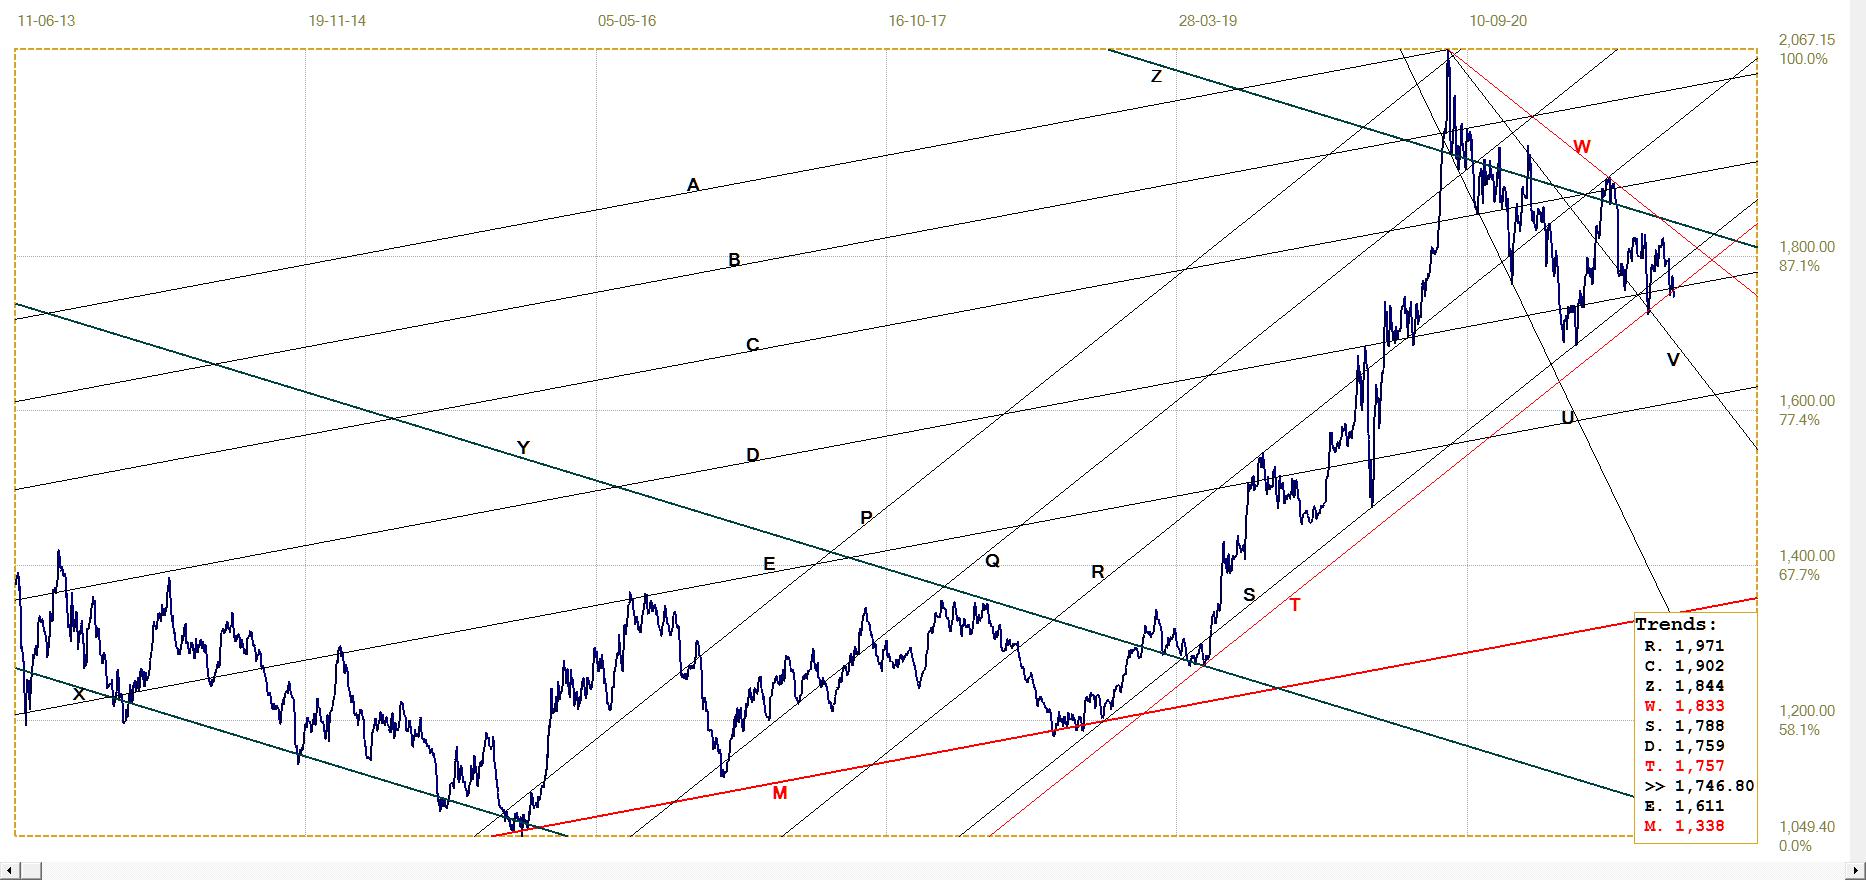
Gold price – London PM fix, last = $1746.80 (www.kitco.com)
Euro–gold PM fix
The euro-price of gold has now broken below its main bull channel for the second time is as many weeks, similar to what the dollar price has done. These breaks are also marginal, and perhaps this good fit of the price of gold to charts in two currencies serves to confirm the validity of the two analyses.
Another chart that shows little recent change and might give new direction this week.

Euro gold price – PM fix in Euro. Last = €1491.24 (www.kitco.com)
Silver Daily London Fix
Silver daily London fix, last = $22.66 (www.kitco.com)
The new trend line F – also derived from the master gradient, M – that was added to the analysis, offers a potential level of support for the price. Whether it will hold to result in a trend reversal remains to be seen. Should the Big banks continue with their strategy to bluff the hedge fund algos into going more short, the price of silver has to be pushed lower, perhaps to hold near line D and the $22 level.
U.S. 10–year Treasury Note
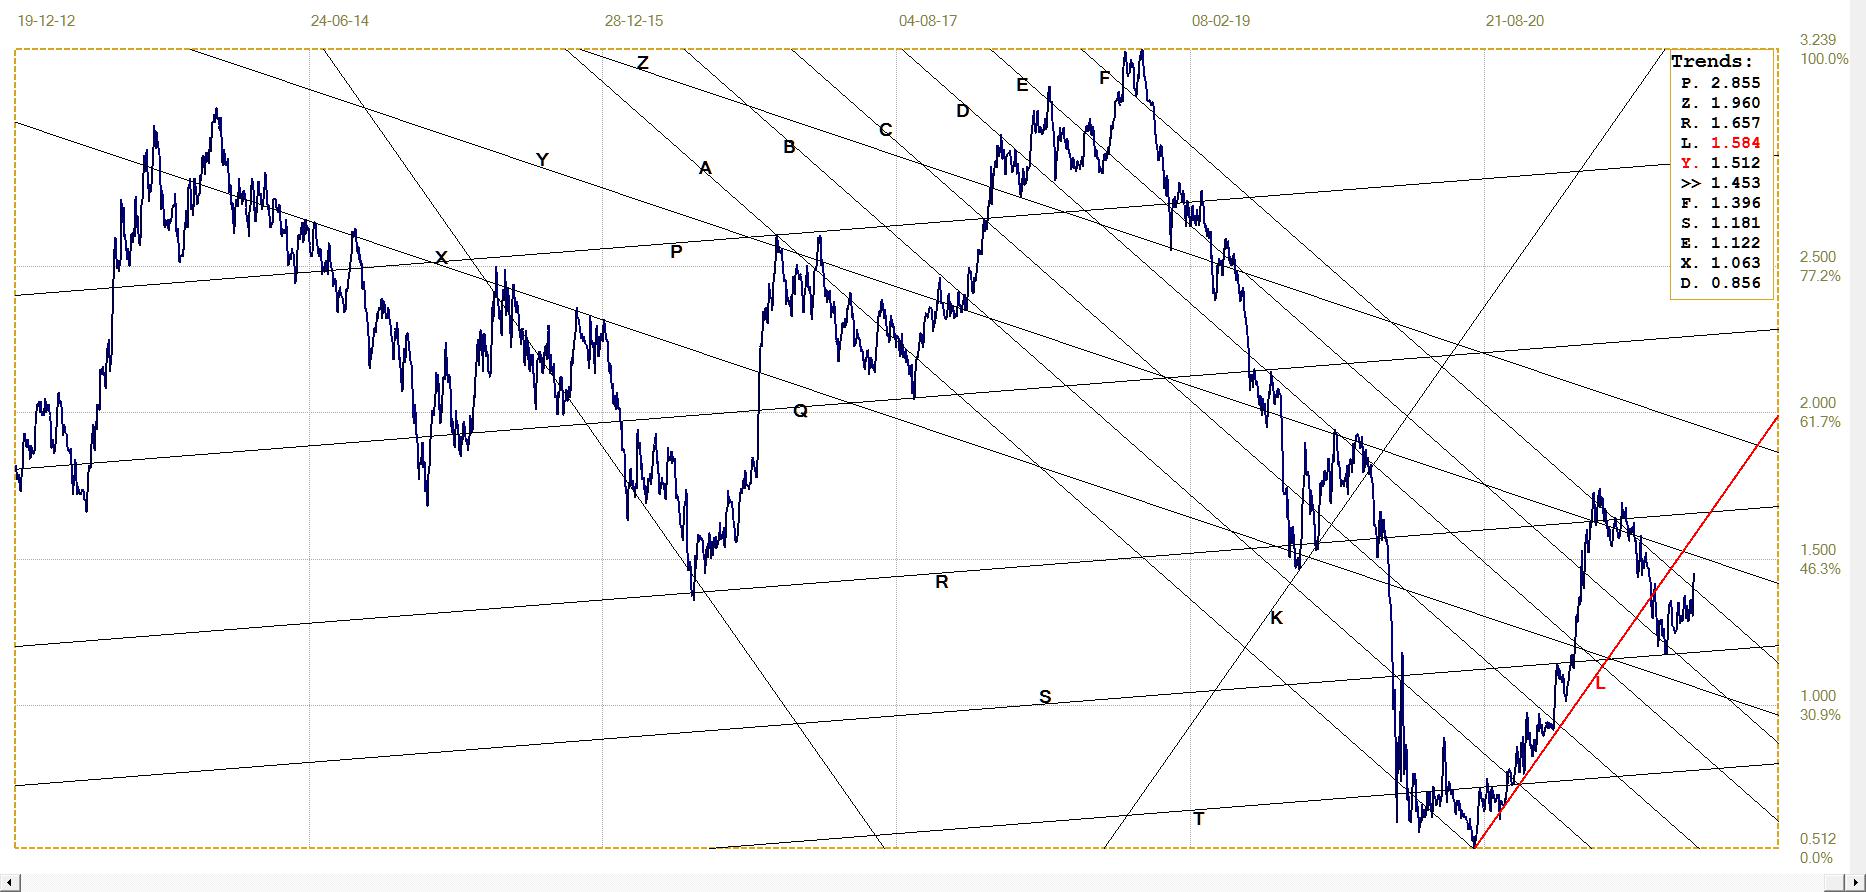
U.S. 10–year Treasury note, last = 1.453% (www.investing.com )
After the yield on the 10-year Treasury note rebounded off line S following the break below channel KL, the yield moved slowly higher in a series of small zig-zag changes. Last week, after a zag lower, the yield suddenly spiked higher to break above channel EF, the high band of bull channel AF. This has happened on two previous occasions and in neither of them was the break extended higher or sustained for a long time.
Before this new break higher can serve as a signal that the bond market is preparing for much higher inflation, the yield has to break above channel XY and hold the break longer than it did on the recent occasion when it broke higher.
West Texas Intermediate crude. Daily close
The reversal from the spike low after the break below bull channel JKL is extending higher, holding below channel KL and is now closing in on the intersection of lines L, S and B. A break higher at that level ought to be quite bullish and a sign the market for fossil energy, possibly like the bond market, is seeing higher inflation on the horizon.
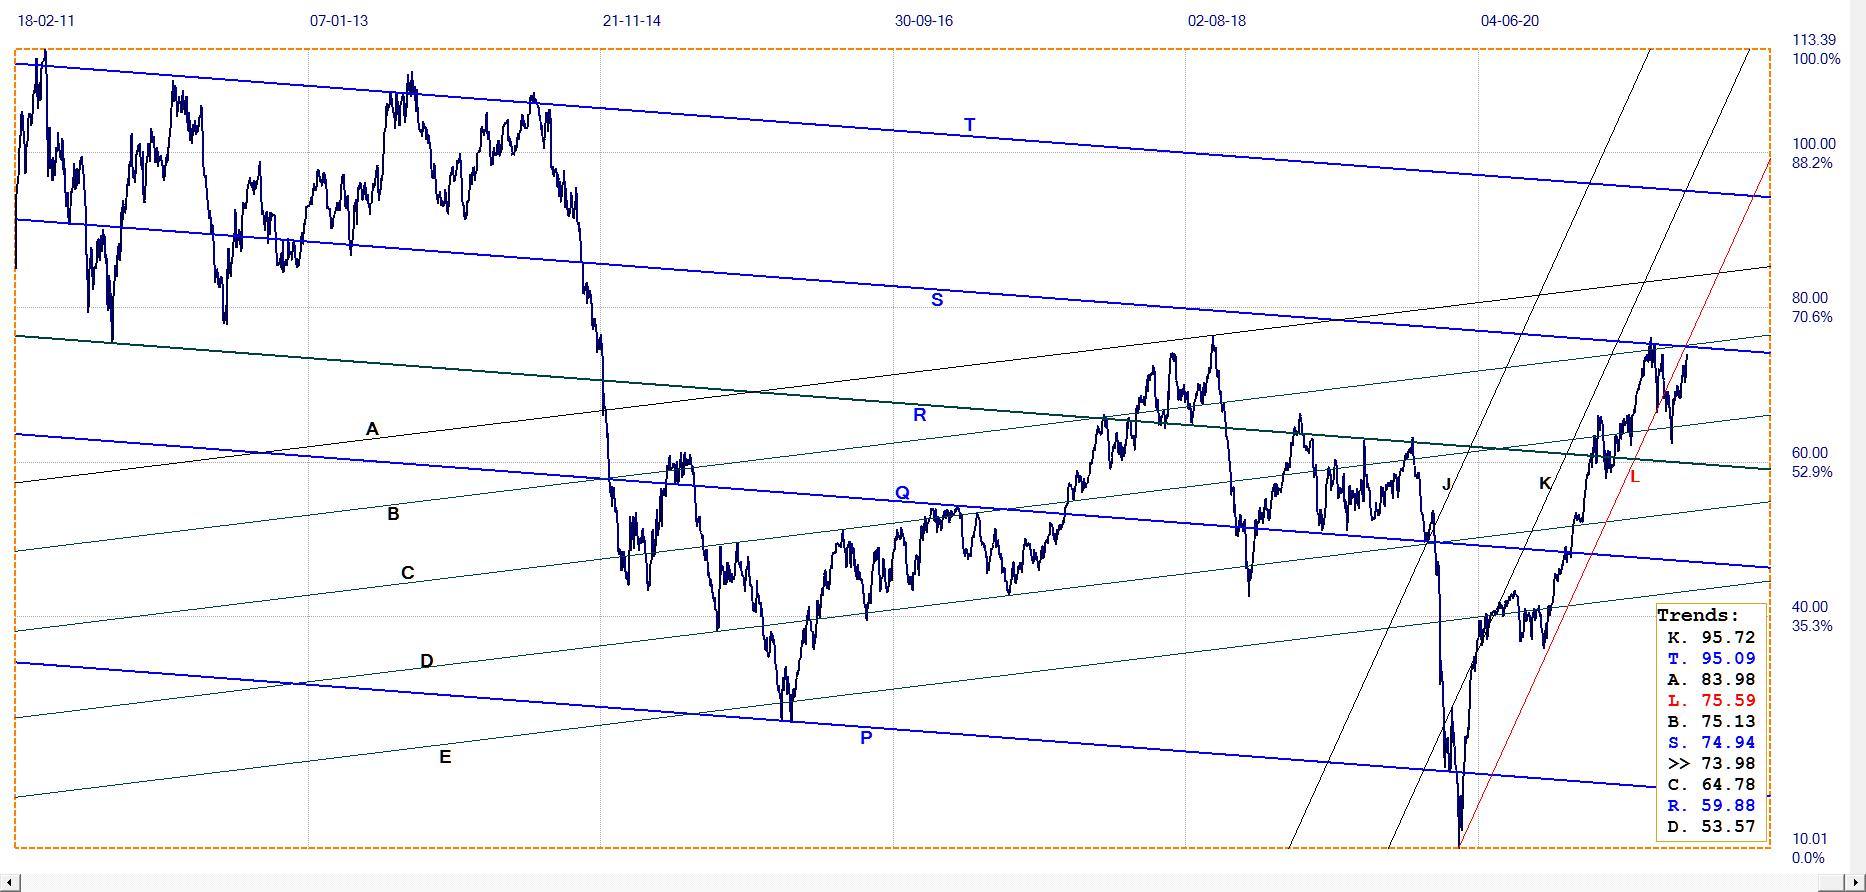
WTI crude – Daily close, last = $73.98 (www.investing.com)
********
share
share
share
share
share
More from Gold-Eagle