Gold: How High Can It Go?
 share
share
 share
share
 share
share
 share
share
 share
share
US Rates:
The Captain’s long-term monthly US rates chart.
Analysis:
The US 10-year Bond Yield has now completed wave i at the 5.021% high and we are now correcting that 5-wave impulsive sequence within wave ii, which has the following retracement levels:
50% = 2.698%;
61.8% = 2.155%.
We are now working on the assumption that wave ii has become a flat-type correction as shown on our Daily 10 Year US Bond Yield Chart.

Within wave ii, we completed wave (a) at 3.785%, and wave (b) at the 4.809% high. We are now falling in initial stages of wave (c) which has projected endpoints of:
(c) = (a) = 3.600%.
(c) = 1.618(a) = 2.850%.
Within wave (c) we have now updated our internal count to suggest that all of wave -i- ended at the 3.886% low and if that is the case then we are now moving higher in wave -ii-, which has the last retracement level of:
78.6% = 4.611%.
Within wave -ii-, wave *a* ended at 4.592%, wave *b* at 4.124% and we are now moving higher in wave *c*, which has now reached our minimum target of 4.592%.
For our current analysis to remain valid we need to turn down very soon, otherwise we will need to conclude that this market is heading back to the 4.992% high.
We will provide our initial projected endpoint for wave -iii-, after we believe that all of wave -ii- is complete.
Trading Recommendation: Short, risking to 5.50%.
Active Positions: Short risking to 5.50%!
Gold:
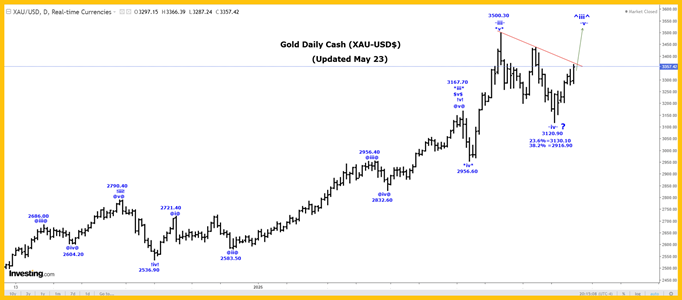
The Captain’s daily gold chart.
Analysis:
The short-term dip in rates indicated by our wave counts is likely related to a stock market tumble. Both the projected tumble and the following inflationary rise in rates to follow are good for gold!
We continue to rally in wave .v. of -iii-. Within wave .v., we completed wave ^i^ of *i* at the 1997.20 high and all of wave ^ii^ at the 1931.80. We continue to rally in wave ^iii^, which has a projected endpoint of:
^iii^ = 6.25^i^ = 3249.40.
Within wave *iii* of ^iii^, we completed wave -i- at 2151.20 and wave -ii- at 1973.10.
We are still rallying in a subdividing wave -iii- with wave $i$ ending at 2088.50, wave $ii$ at 1984.30, wave $iii$ at the 2431.50 high, and our wave $iv$ bullish triangle at the 2277.60 low.
It looks like all of wave $v$ of *iii* ended at the 3167.70 high, wave *iv* at the 2956.90 low and wave *v*, at the 3500.30 high, to complete all of wave -iii-..
If that is the case, then we are now moving lower in wave -iv-, which has the following retracement levels:
23.6% = 3130.10.
38.2% = 2916.90.
We have now reached our 23.6% retracement level, so we need to be on guard for the completion of wave -iv-, perhaps at the 3120.90 low, and the start of another rally in wave -v-…which will see gold move to all-time new high again.
Next major resistance is the downtrend line connecting 3500.33 and 3438.60, which we challenged on Friday.

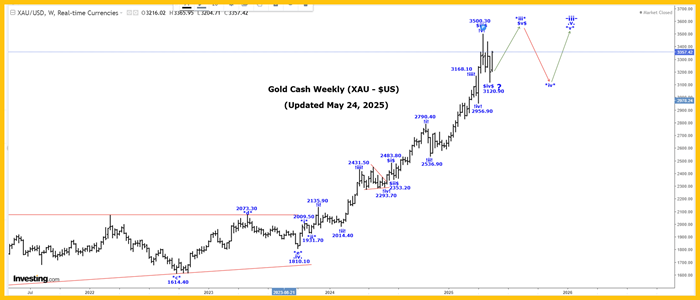
The Captain’s weekly gold chart.
Here are the weekly chart wave counts:
We are moving higher in a multi-year wave (3) of 3, that has a current projected endpoint of:
(3) = 1.618(1) = 4298.80!
Within wave (3) we are moving higher in wave -iii- which has a current projected endpoint of:
-iii- = 6.250-i- = 3249.40.
Within wave -iii-, we are moving higher in wave *iii* which has an updated projected endpoint of:
*iii* = 6.25*i* = 4660.20.
We are working on the assumption that wave *iii* is still underway, as shown on the Weekly Gold Chart, with wave $iii$ is ending at the 3500.30 high and if that is the case then we are now falling in wave $iv$,…
Although we have now reached our 23.6% retracement level, so we need to be guard for its completion and the start of another rally in wave $v$.
Trading Recommendation: Go Long gold. Use puts as stops.
Active Positions: Long gold, with puts as stops!
********
share
share
share
share
share