Gold –> The (Short) Saga Continues…


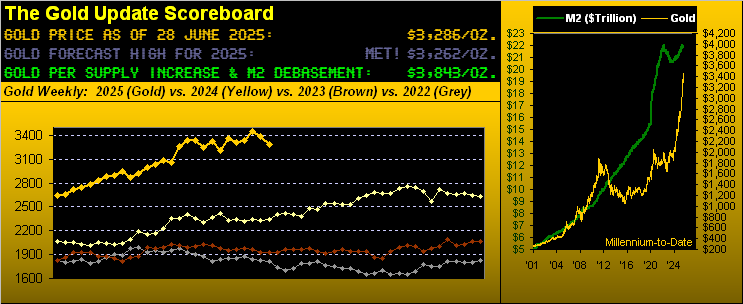
Amazing, eh? ‘Twas but a week ago we cited Gold having come within just four li’l ol’ points of flipping its weekly parabolic Short trend back to Long had 3480 traded. But it didn’t transpire, nor since did price really rise toward the revised 3476 flip level for this past week. Which means Gold just completed its seventh week of such Short trend, regardless of price having settled yesterday (Friday) at 3286 and thus still above where it all started at 3220 per the opening back on 19 May.
However, Gold has now recorded back-to-back down weeks for only the second time during 2025 as we come into mid-year. As well, ’twas Gold’s sixth down week in the last 10. Thus year-over-year, here’s how it all looks with 26 weeks of 2025 in the books:

Indeed at 3286, Gold sits just above our 3262 forecast high for this year, (not that it need be supportive). Still, ’tis Gold’s lowest weekly settle across these past six.
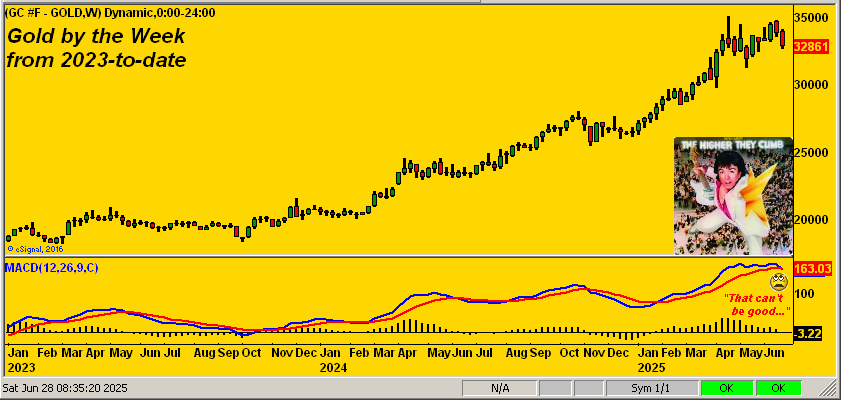
And now looms this rather ominous technical study: a negative weekly MACD (“moving average convergence divergence”) crossover, which to the trading/investing community at large is a tool far more visible than our own deMeadville analytics. Here is the history of that MACD from 2023-to-date. The good news is given Gold having recorded “nuthin’ but up” through this time frame, the prior such negative crossovers induced relatively little selling of substance, the average price drop having been only -52 points before the MACD’s next swing to positive. However this new negative crossover appears more pronounced and from a significantly higher oscillative level. Hat-tip David Cassidy’s LP from ’75: “The Higher They Climb, The Harder They Fall”:
On a nearer-term basis, let’s go ’round the horn for Gold inclusive of all eight BEGOS Markets by their daily bars for the last 21 trading days (one month) along with their baby blue dots of day-to-day regression trend consistency. Note that at present, seven of the grey trendlines are positive: only that for Gold has just rotated to negative, its “Baby Blues” therein dropping at a precipitous pace. And as therein reminded “Follow the Blues…”
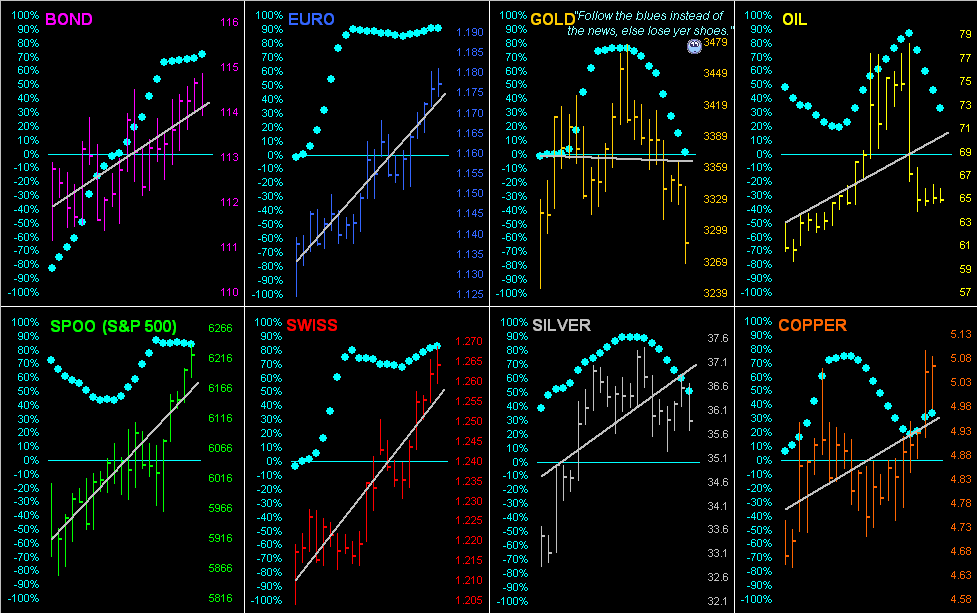
“But mmb, the Dollar is going down; just look above at the Euro and Swissie…”
‘Course as Squire knows, Gold plays no currency favourites. And this year, the Buck has been losing the fiats’ “Ugly Dog Contest” as later exemplified in our wrap.
Too, May’s “Fed-favoured” Personal Consumption Expeditures at the “core” level came in hotter (+0.2%) than consensus (+0.1%, as ’twas too for April). So that, plus the Fed’s being unaware of the plunging Economic Barometer (as we’ll see), likely keeps the Federal Open Market Committee from cutting the Funds Rate per their 30 July Policy Statement. And yet as we go to the puke-green inflation table for May, whilst the 12-month summation average of +2.4% remains above the FOMC’s preference for +2.0%, May’s annualized readings (all of which — save for the “core” PCE — were just +0.1%) are indicative of inflation cooling. But as we’ve said in the past, heaven forbid the Fed actually being ahead of the curve. (At least we are). Here’s the table:
On to what the Fed, as noted, apparently doesn’t dread: the Econ Baro being all but dead. Yes, throughout the 27-year history of the Baro, there have been worse fallouts; however, they’ve regularly been followed by S&P 500 routs. Not this time however: neither the Fed nor the FinMedia nor most investors get it. Rather, as the economy cringes, the S&P binges. Reprise: “Marked-to-market, everybody’s a millionaire; marked-to-reality, nobody’s worth squat” … especially given the S&P’s present market capitalization of $54.2T supported by a liquid StateSide “M2” money supply of but $22.0T. That’s an “Uh-oh…” Here’s the Baro:
Back to Gold, and as (save for one trading day) ’tis month-end, let’s peek at the year-over-year percentage tracks of Gold comparable to several top-tier precious metal equities. So here’s what we’ve got from the bottom up: Newmont (NEM) is +35%, bettered by Franco-Nevada (FNV) +37%, Pan American Silver (PAAS) +40%, Gold itself +42%, both the Global X Silver Miners exchange-traded fund (SIL) and the VanEck Vectors Gold Miners exchange-traded fund (GDX) +50%, and amazing Agnico Eagle Mines (AEM) +79%. ‘Course specific to this one-year time frame, only AEM is exhibiting the notable leverage play whilst the balance of the bunch are merely scattered ’round the yellow metal:
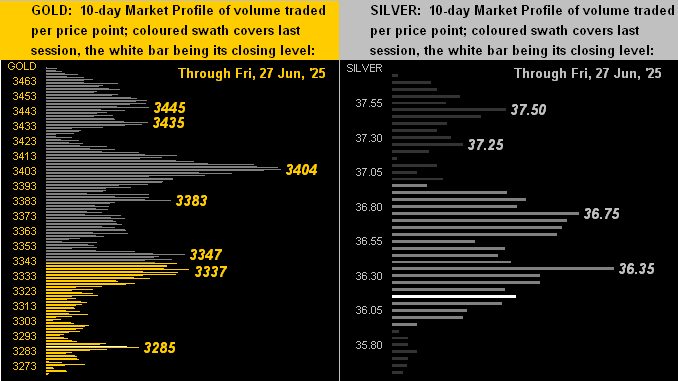
Now to the 10-day Market Profiles for Gold on the left and Silver on the right, wherein both panels echo the same sentiment: “resistive”. Still, on a century-to-date basis, the white metal remains the better value per the Gold/Silver ratio at 91.7x. Were Silver instead priced to the ratio’s average (69.1x), ‘twould today be 47.57 … that’s +33% higher than the actual 35.84 level. Again we refrain: “Poor ol’ Sister Silver!”
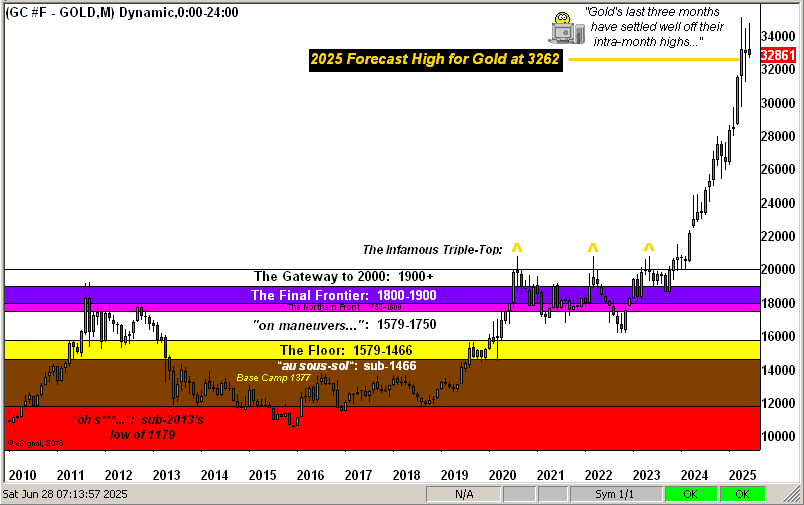
Next to Gold’s Structure by the month from the year 2010-to-date. Again acknowledging one trading day remains in June (the rightmost candle), nonetheless duly note the selling from these last three months’ respective highs, the 3400 level having thus become arduous to maintain:
To wrap it up, ‘twouldn’t be month-end (less a day) without the BEGOS Markets’ Standings. And through these six months, our Metals Triumvirate has dominated the podium: none of the other markets thus far have fared better than fourth position. For June, swapping the first two spots from May are Gold by Copper, the red metal having just recorded its fourth best week (+4.8%) of the year. Meanwhile the non-earnings supportive S&P 500 miraculously clings to a +5.0% gain, oblivious to its pending pain, (yes ’tis coming with a vengeance by any historical means-reversion measure of earnings multiples, the “live” price/earnings ratio at present 44.6x). Moreover as earlier teased: pity the poor Dollar! The Dollar Index is -10.5% through the first half of this year. That is Dixie’s worst first six months’ percentage drop since coming on line as a futures product 40 years ago! Again cue the late, great “Bullet” Bill King: “Holy Toledo!!”
But barring anything untoward (i.e. renewed geo-political jitters, an equity market collapse, the inevitable loss of confidence in the financial system), we shan’t be surprised to find Gold working lower through here. Yet one can buy Gold’s dip to stay financially fit!
Cheers!
…m…
www.TheGoldUpdate.com
www.deMeadville.com
and now on “X”: @deMeadvillePro
********

Mark Mead Baillie has had an extensive business career beginning in banking and financial services for two years with Banque Nationale de Paris to corporate research for three years at Barclays Bank and then for six years as an analyst and corporate lender with Société Générale.
For the last 22 years he has expanded his financial expertise by creating his own financial services company, de Meadville International, which comprehensively follows his BEGOS complex of markets (Bond/Euro/Gold/Oil/S&P) and the trading of the futures therein. He is recognized within the financial community of demonstrating creative technical skills that surpass industry standards toward making highly informed market assessments and his work is featured in Merrill Lynch Wealth Management client presentations. He has adapted such skills into becoming the popular author each week of the prolific “The Gold Update” and is known in the financial website community as “mmb” and “deMeadville”.
Mr. Baillie holds a BS in Business from the University of Southern California and an MBA in Finance from Golden Gate University.
More from Gold-Eagle


