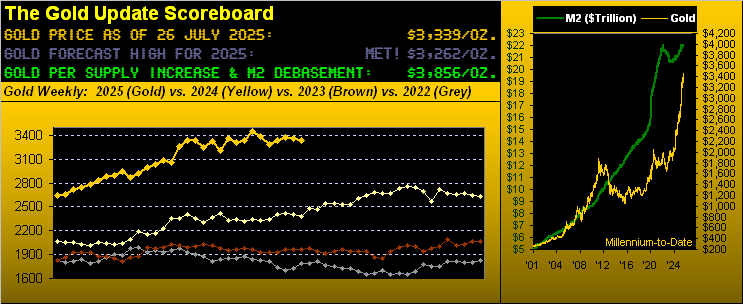
Gold Ends Its Short Spell; But Then Falls Pell-Mell


We open with both Good News and Bad News for Gold:
The Good News is this past Wednesday at 00:21 GMT, Gold provisionally ended its 10-week parabolic Short spell upon breaking above 3449, confirmation then coming at the (albeit quite a bit lower) 3339 settle yesterday (Friday).
The Bad News is in surpassing 3449 by only a few points to 3452, Gold then fell pell-mell through the week’s balance to as low as 3323 — a three-day -3.7% El Plungo (technical term) of -129 points — en route to the noted 3339 settle.
Thus Gold has begun its new weekly parabolic Long trend by going the wrong way, in turn sporting its sixth worst “points given up” from high to settle of the year’s 30 weeks-to-date. ‘Twas not a beautiful thAng. Either way, here year-over-year are Gold’s weekly bars, featuring its fresh rightmost encircled parabolic Long trend blue dot, which in itself always is a beautiful thAng:

‘Course, one trend’s inference is not necessarily that of all measures on the same time frame. As herein posted in our 28 June missive, we’ve since updated Gold’s weekly bars for these past three calendar years along with the MACD (“moving average convergence divergence”) study. And by that construct, it keeps the “bad idea” of being Short — rather than Long — on the table, given the recent and still ongoing negative MACD crossover. However, we don’t sense ’tis that worrying:
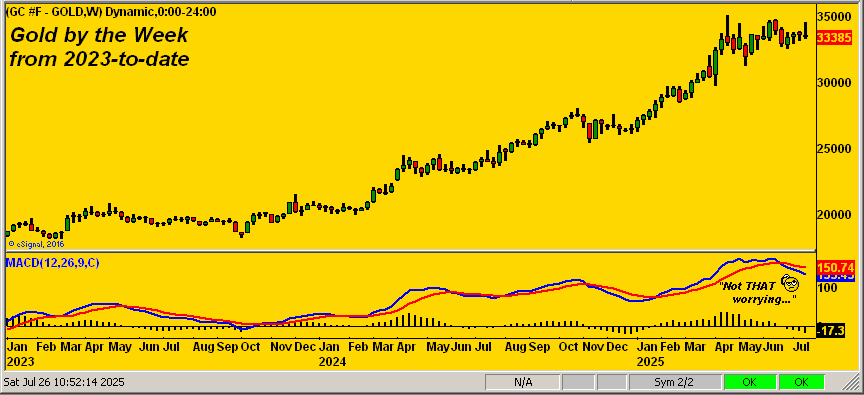
Nonetheless cited, let’s go the “What To Do? Dept.” Clearly by Gold’s upward slant across the above graphic, the Long side has been the right side. ‘Tis easy to prove mathematically: in purely swinging solely on the Short trends of Gold’s last five weekly MACD negative crossovers, the silly Shorts have amassed a single contract loss of -$57,500; whereas purely swinging on Gold’s last five weekly Parabolic Long trends is a single contract gain of +$69,600. Reprise: “Shorting Gold is a bad idea.” Case closed.
“So because the parabolic trend now is up means another all-time high is coming, right mmb?”
Squire, whilst over time inevitably yes, ’tis hardly “automatic” during this new Long stint. But we conservatively give it a 60% chance of occurring given the following table’s statistics. Therein we display the performance of Gold’s last 10 weekly parabolic Long trends. Bearing in mind that from here at 3339, Gold need gain at least +5.2% on this trend to reach 3511, (the current All-Time High being 3510 since 22 April). So why a 60% chance of getting there? In the “Max Gain” column, six of the 10 trends bettered +5.2%. Further, why “conservatively”? Because the both the average and median gains of Long trend are basically +10%. Moreover, solely in that +10% vacuum with durations running 13-15 weeks, November would bring us Gold 3700. That’s not a predication, rather a reasonable assessment of potential upside range, barring this Long trend becoming Short-lived. Here’s the table:
And to be sure, there’s a lot on the mid-summer table to affect the price of Gold. Most imminently, next Wednesday (30 July) brings The Big Double-Whammy of StateSide Q2 Gross Domestic Product followed by the Federal Open Market Committee’s Policy Statement. Then two days hence brings 01 August and the introduction of more “Trump Tariffs!”
Too, there’s this from the “Oh By The Way Dept.” ‘Tis time for the U.S. Treasury to spritely come up with $7T to pay its noble holders of maturing Bills, Notes and Bonds. According to “AI” (“Assembled Inaccuracy”), as of this year’s Q1, operating cash amounted to about $406B, which combined with other monetary assets totaled a tad over $1T for 2024. Thus by your six-year-old’s first grade arithmetic, the Treasury is about -$6T short of its looming funding requirements.
So who or what is going to buy all this requisite new debt? Here’s a thought: remember that (as we herein mathematically constructed) “all” $7T of the COVID monetary “creation” essentially found its way into the S&P 500. So, why not have the Treasury thus promote a “group sell” of $7T in stocks with the proceeds moving into debt at its currently attractive rates? ‘Tis so easy, a WestPalmBeacher can do it.
“But mmb, that might crash the stock market…”
The stock market, Squire, is so overdue for a harrowing crash, be it driven fundamentally, technically and/or quantitatively, a “group sell” to save the U.S. Treasury would be the perfect crash catalyst.
But with respect to Gold (and barring such selling of stocks), should the ensuing Treasury auctions be feeble, ‘twould fall to the Fed being forced to make that next BIG accounting entry to buy up the difference. And Gold, in turn, would go upside gonzo nuts (again, a technical term).
Speaking of stocks, we’ve run out of ways to indeed express (purposeful repeat) how we’ve run out of ways to describe the LooneyTunes overvaluation of the S&P 500. During recent years, we’ve herein detailed in-depth (using what is today an unknown science called “math”) sensible scenarios for the “Look Ma! No Earnings!” crash and the “Look Ma! No Money!” crash. Now let’s add to those the “That’s All, Folks!” crash, wherein upon it all going wrong, the market doesn’t so much crash as instead ’tis just closed, (rather akin to the “Look Ma! No Money!” crash). Then again the Fed can create the difference and ’tis more upside gonzo nuts for Gold.
As to the current state of the S&P, ’tis now 23 consecutive trading days “textbook overbought”, as well as having arrived at our “extremely overbought” classification with a sub-par Q2 Earnings Season in process. Oh yes, we saw the CNBC[S] end-of-week headline last evening: “S&P 500 posts fifth straight record close this week, powered by solid earnings”. Hardly are earnings “solid”. To wit:
In this era of dumbing-down earnings estimates to dirt, ’tis super easy to beat ’em: so far for Q2, we’ve 149 S&P 500 constituents having reported, of which 79% have exceeded expectations! Why typically, only 76% so do! Sadly however, here’s where the “solid” earnings hocus-pocus loses focus. In an average Earnings Season, 66% of the constituents improve their bottom lines over the like quarter of a year earlier. To this point for Q2, such rate has slowed to 63%. ‘Course that shan’t be on CNBS, Bloomy nor FoxyB. But ’tis why the following multiple has gone beyond stoopid:
Again, don’t argue nor ask “AI“; just do the math. And per last week’s piece, yes, we still sense “The Sell” shall be ever-intense.
As to the math that makes up the Economic Barometer, as anticipated, ’twas well ahead of last Monday’s lagging indicator known as the Conference Board’s “Leading Indicators”. So severe had been June’s Econ Baro plunge, we knew the consensii for just -0.1% shrinkage in the June reading was too timid: rather, it came in (no surprise) at -0.3%. Too, the month’s Existing Home Sales slowed and Durable Orders shrank. But bailing the Baro out by just the wee-est of bits was growth in June’s New Home Sales, plus a reduction in the prior week’s Initial Jobless Claims. So below, we’ve the whole picture from one year ago-to-date. Duly therein note the insert of the S&P 500 futures chart for the past month (21 trading days): we made such a song-n’-dance a week ago about the baby blue dots of trend consistency being finally in decline … but they’ve suddenly lurched back up (per the three red dots). “Perfect timing ain’t easy…”:
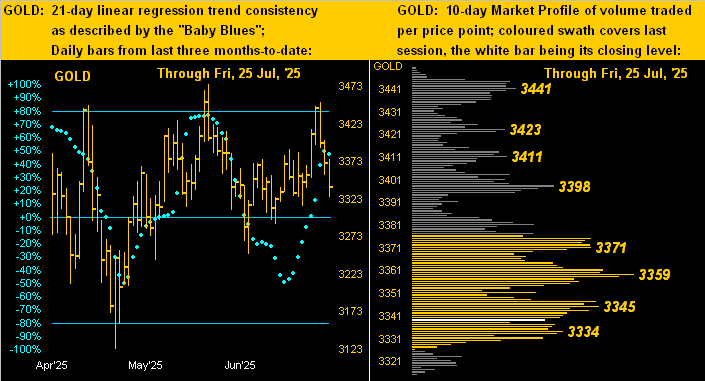
Back to Gold, per our opening observation, ’tis a bit of a dismal start to the fresh weekly parabolic Long trend. You can see the selling quite starkly in the lower left-hand panel following the rightmost high of last Wednesday, the “Baby Blues” having just kinked lower, too. As for the lower right-hand panel, Gold has formed quite a bevy of overhead volume-dominant resistors as labeled:
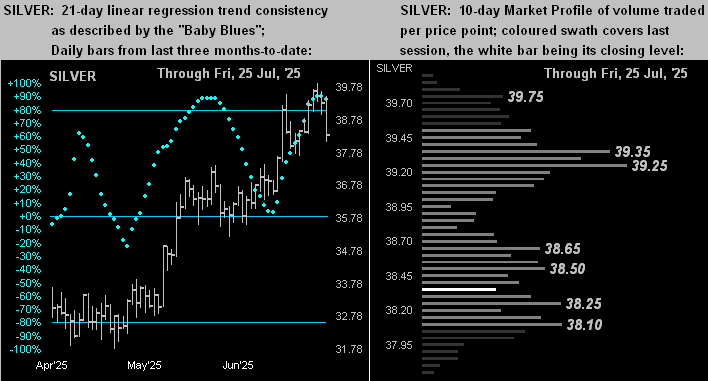
The like graphic for Silver shows her having also just taken a bit of a beating per her daily bars from three months ago-to-date (at left). Still, her 10-day Market Profile suggests some safety in the 38s (at right):
We see next week as pivotal for both Gold and the S&P. Inclusive of the GDP, the FOMC and the renewed tariffs spree come 18 metrics for the Econ Baro’s scrutiny. As well, Gold’s contract volume rolls from that for August into that for December with better than +50 points of fresh premium, merci! Where might your money be?
Cheers!
…m…
www.TheGoldUpdate.com
www.deMeadville.com
and now on “X”: @deMeadvillePro
********

Mark Mead Baillie has had an extensive business career beginning in banking and financial services for two years with Banque Nationale de Paris to corporate research for three years at Barclays Bank and then for six years as an analyst and corporate lender with Société Générale.
For the last 22 years he has expanded his financial expertise by creating his own financial services company, de Meadville International, which comprehensively follows his BEGOS complex of markets (Bond/Euro/Gold/Oil/S&P) and the trading of the futures therein. He is recognized within the financial community of demonstrating creative technical skills that surpass industry standards toward making highly informed market assessments and his work is featured in Merrill Lynch Wealth Management client presentations. He has adapted such skills into becoming the popular author each week of the prolific “The Gold Update” and is known in the financial website community as “mmb” and “deMeadville”.
Mr. Baillie holds a BS in Business from the University of Southern California and an MBA in Finance from Golden Gate University.


