A Gold Stocks Horse Race


Thankfully, it looks like the treacherous 2021-2025 war cycle is ending on schedule, as I have suggested it would. The daily death count in Gaza is down significantly, Israeli hostages have been released, and odds of an imminent ceasefire in Ukraine grow exponentially.
As the new year of 2026 begins, what events await savvy metals market investors?
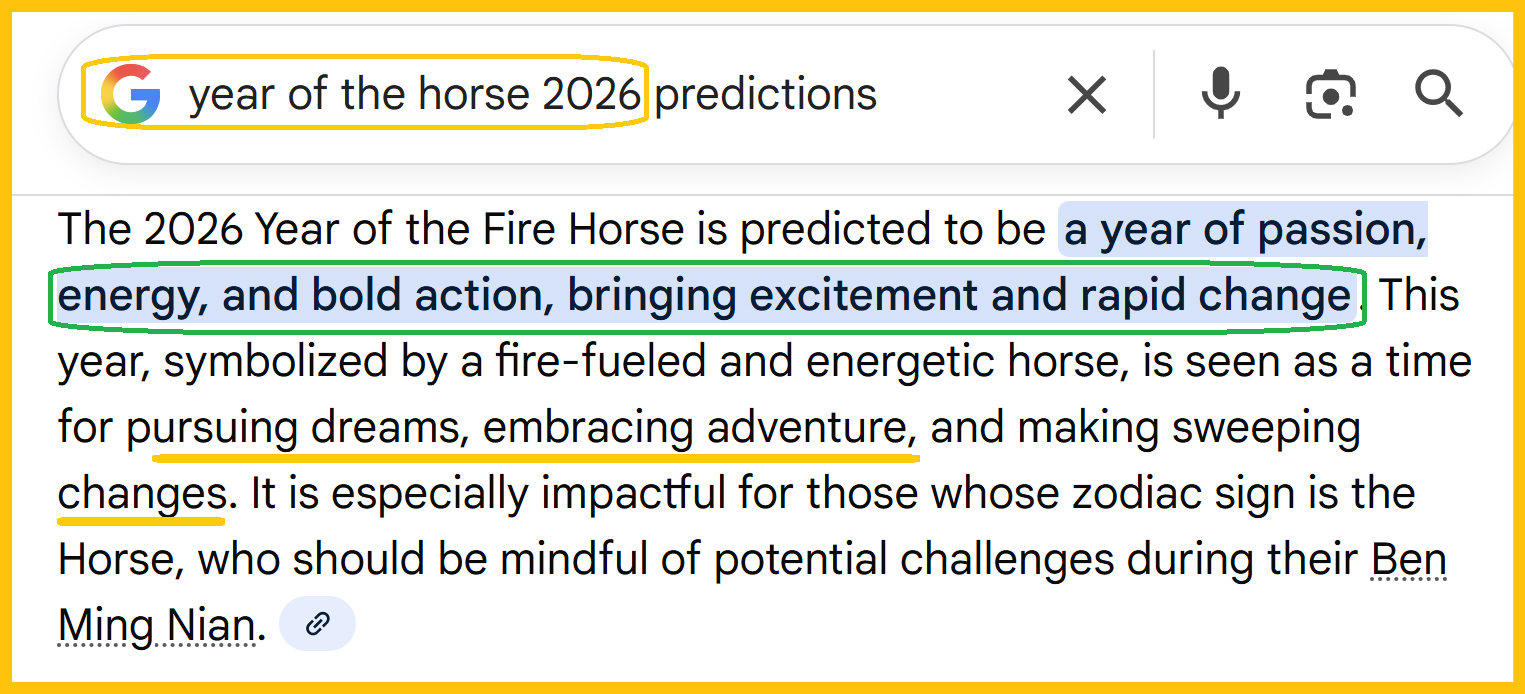
The year of the snake (tariff taxes?) is ending, and the year of the horse (highly flying miners?) is set to begin. The only question may be:
Are gold stock investors ready to mount up and ride?
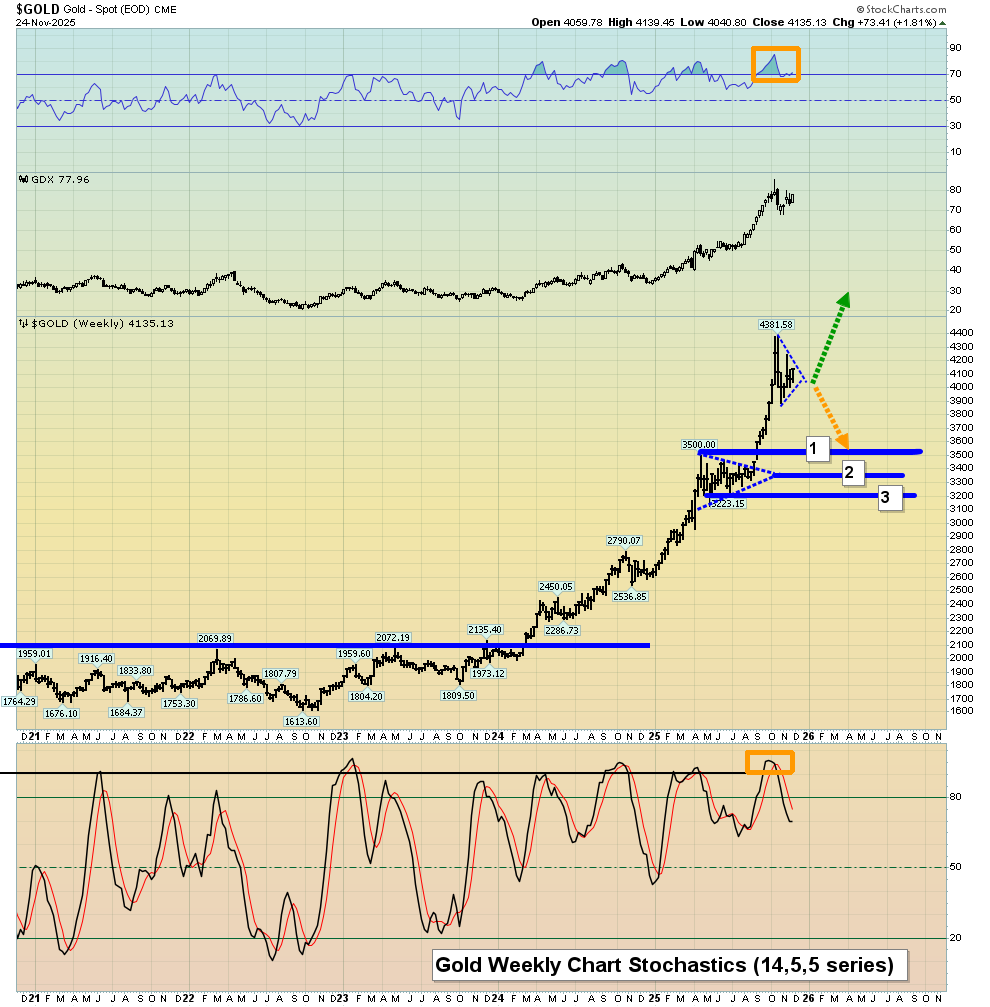
This is the weekly chart for gold. While oscillators like RSI are still overbought, actual “boots on the ground” investor sentiment seems quite calm.
Investors need to be prepped to buy the $3500 zone if there’s a surprising dip into it, but the odds of it happening are diminishing.
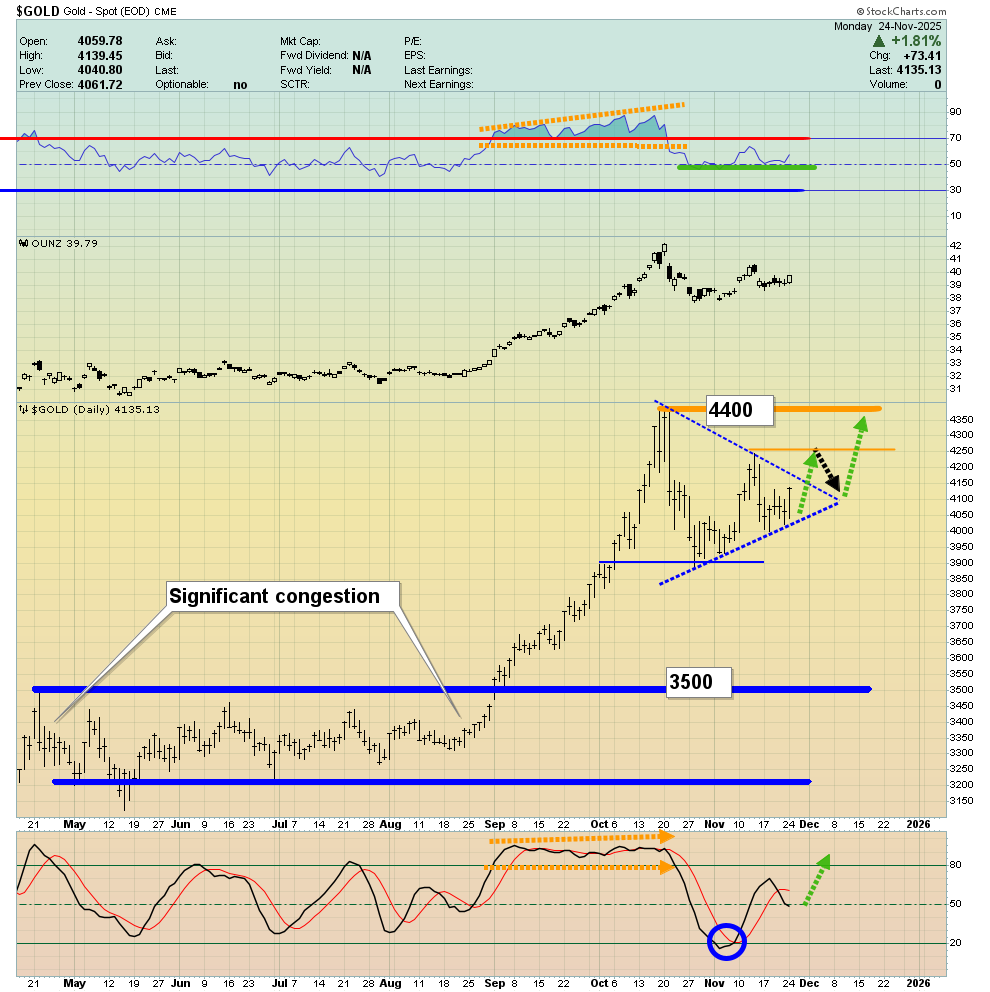
The daily chart looks good; Stochastics (14,7,7 series) is at the 50 marker and its lines are potentially crossing into a buy signal. RSI has also been holding at the 50 zone.
The bottom line is that a set-up for a momentum-oriented breakout from the triangle pattern is now in place.
The entire precious metals sector is looking quite good. For a look at another key metal (platinum):
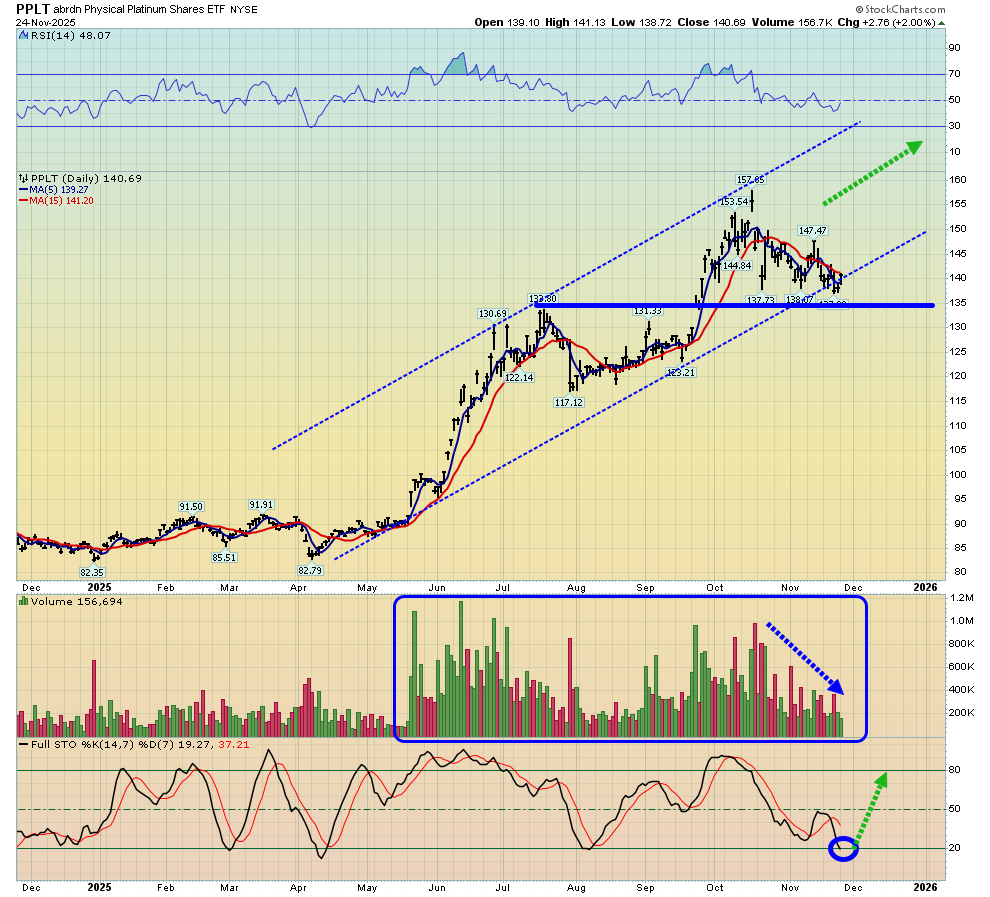
This is the PPLT physical platinum ETF chart. Note the great position of the Stochastics oscillator. In a nutshell:
Platinum (basis PPLT) looks like a freight train set to pull out of a train station. The pullback from about $157 to $133 has been accompanied with a nice fade in volume. The set-up for solid gains in the early months of 2026 is clearly in place.
I love platinum (but nowhere as much as I love gold) and I urge all metals enthusiasts to consider some grub stake buys on platinum itself, the PPLT ETF, or both!
Silver?
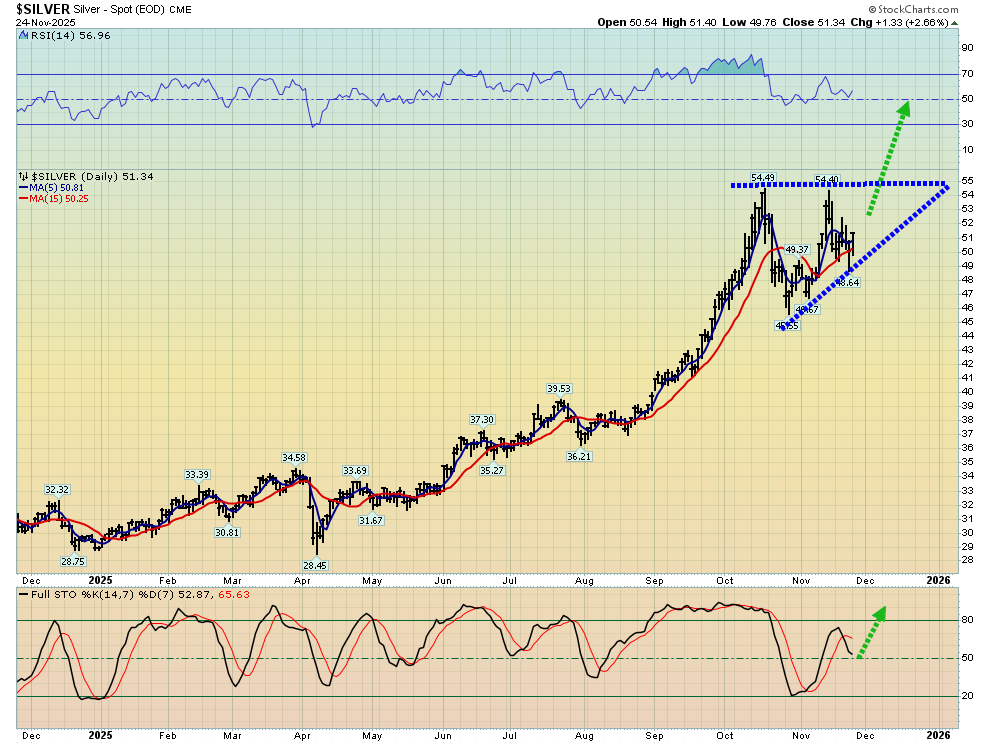
As with gold, Stochastics and RSI are hovering nicely in the 50 zone.
A possible ascending triangle may be forming too, with a target price of about $63.
What about the stock markets?
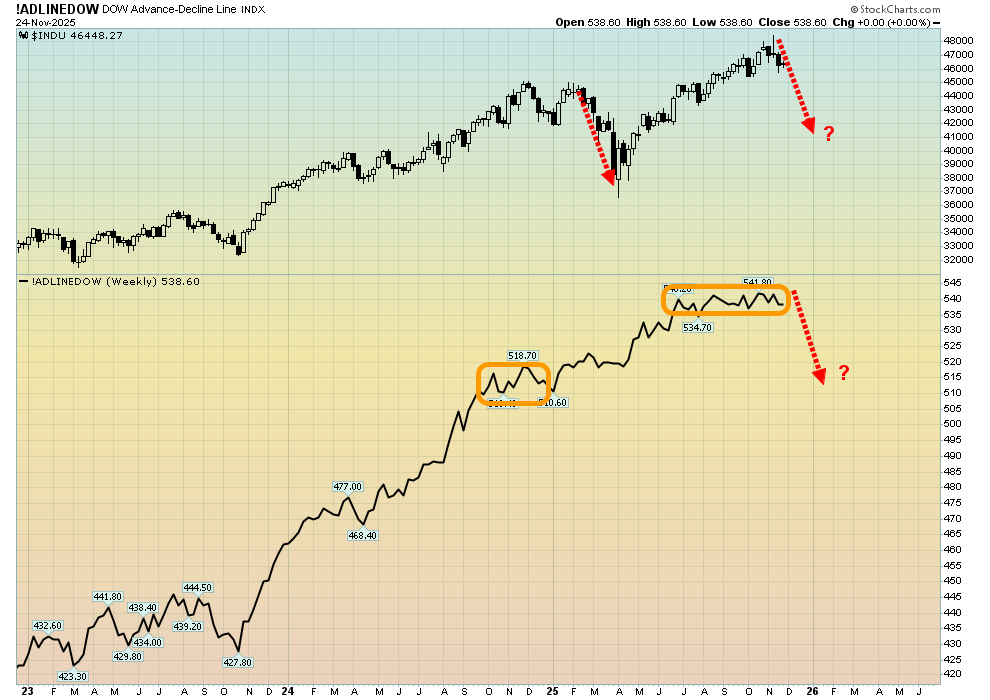
This is the US stock market chart. The advance-decline line (ADL) is an important (and often under-appreciated) indicator for this market.
It’s flatlining now, as it often does ahead of a significant dip in the price. If the Dow, SP500, and Nasdaq now all surge to new highs while the ADL does not, this would be a major warning to investors.
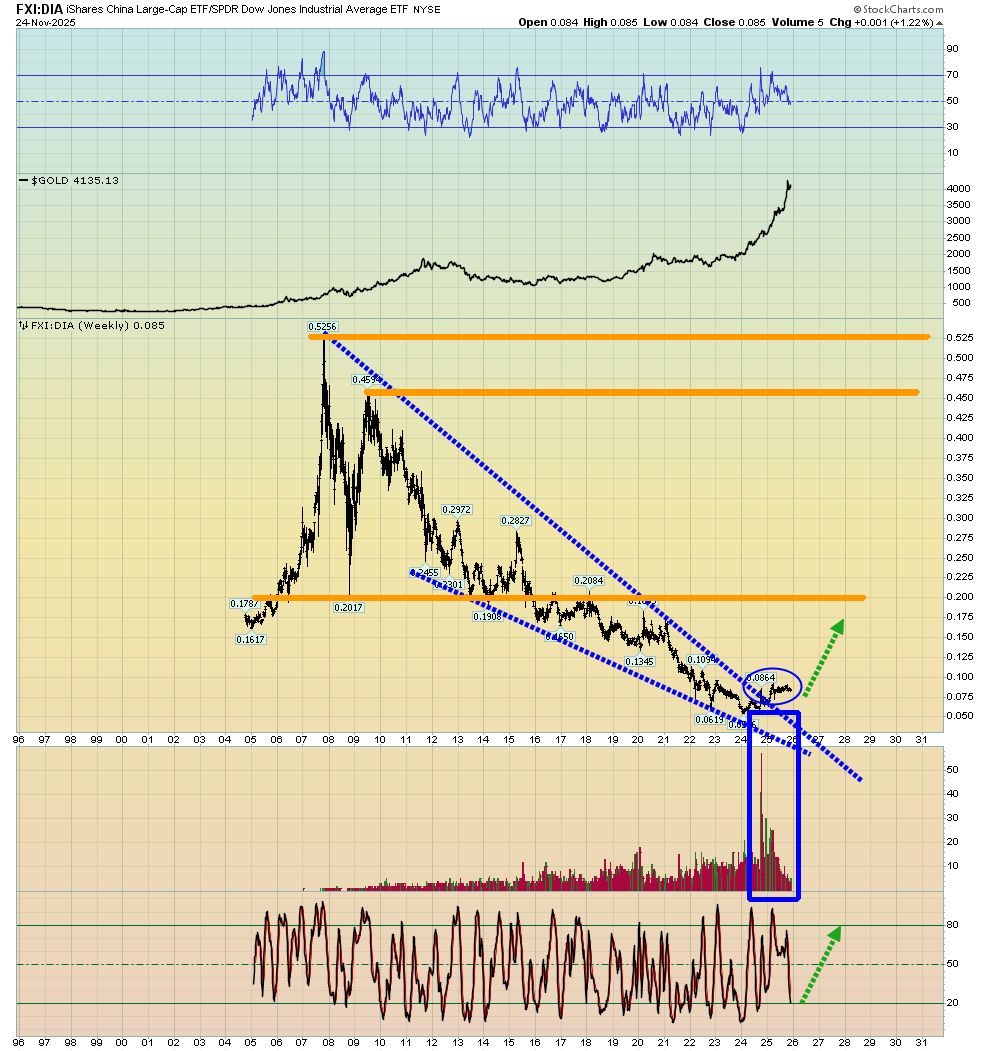
This is the stunning FXI versus DIA ratio chart. The Chinese government has engaged in ridiculous debt worship for a long time. That silly behaviour isn’t much different from the debt obsession showcased by the equally silly US government, but the power of the private sector in both nations needs to be respected.
The Chinese private sector clearly offers relatively good long-term investor value while the US side currently offers only tiny pockets of value. I’m not a big stock market enthusiast, but I am comfortable holding Chinese stocks for life… while trading the US market for short to medium term gains.
The one pocket of US stock market undervaluation is of course gold and silver mining stocks. For an exciting look at them:
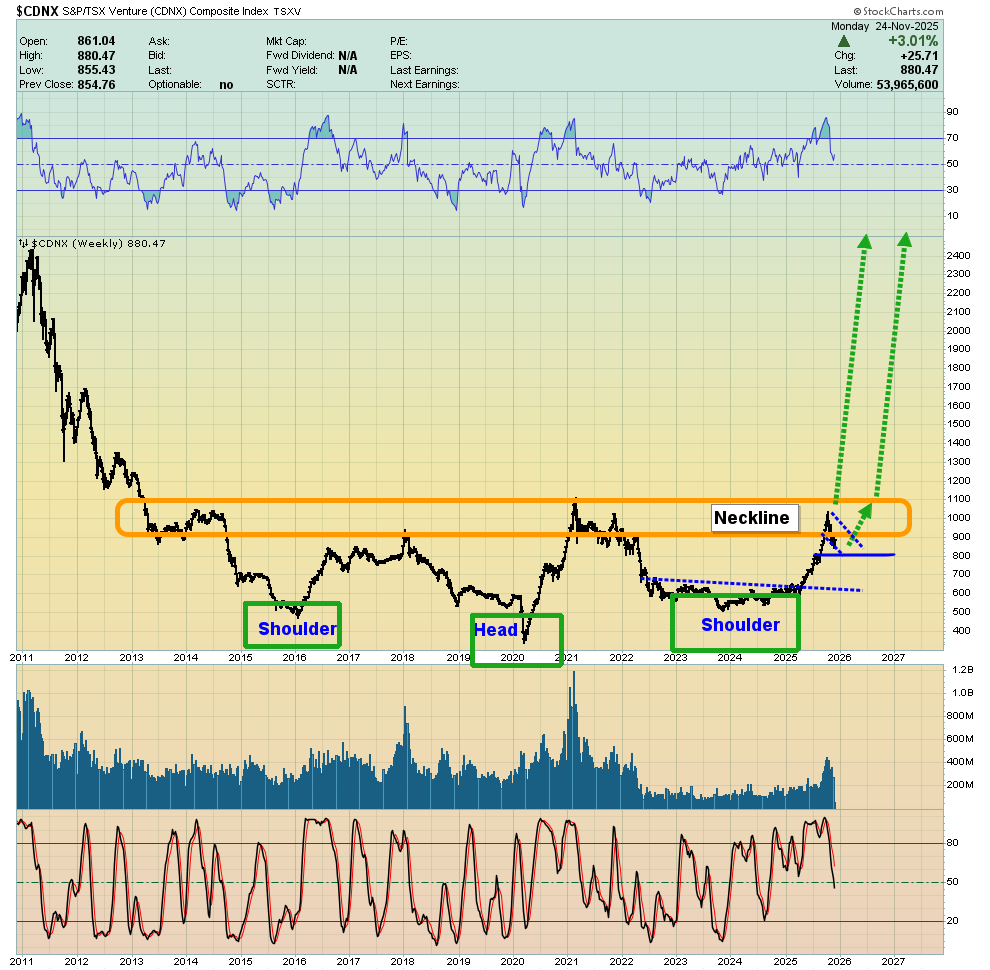
For years, I’ve been walking investors through the potential formation of this massive inverse H&S pattern on the CDNX chart. Is a glorious surge through the neckline now imminent?
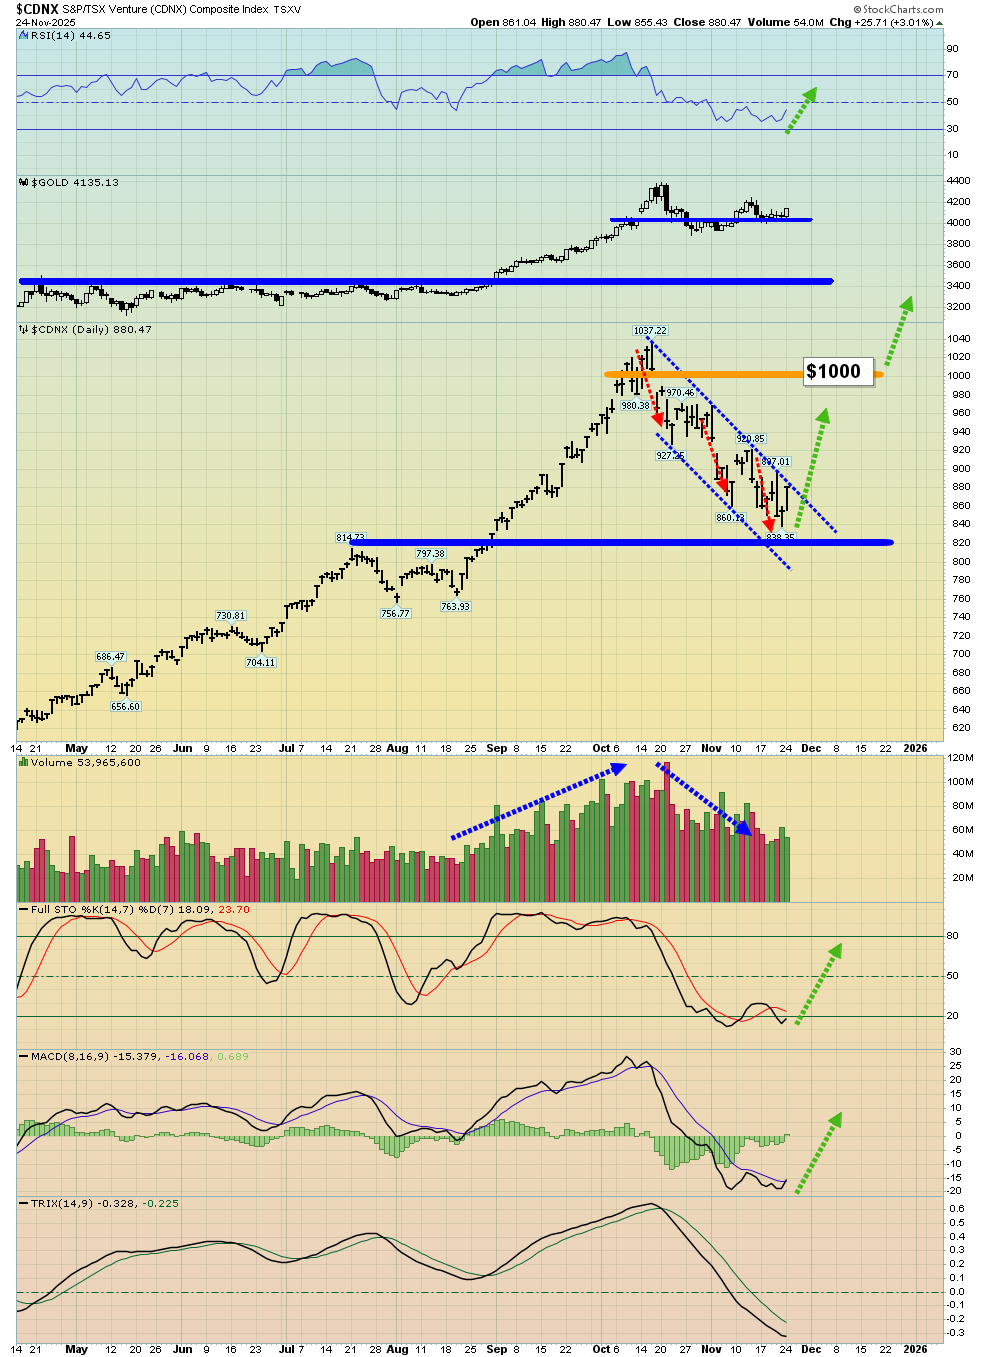
The daily chart action suggests it is! Stochastics and RSI did not confirm the latest dip in the index and now there’s a MACD (8,16,9 series) buy signal in play.
With three minor waves down, the correction has been orderly. Volume has also faded, which is a bullish sign. Junior mine stock investing isn’t for everyone, especially with size, but as this gargantuan gold bull era rollout continues, these miners look set to outperform everything! At $199/year, my junior resource stocks newsletter is an investor favourite, and I’m doing a special pricing this week of $169 for 14mths! Send me an email or click this link if you want the special offer and I’ll get you onboard. Thanks!
Is the bullish action in the juniors confirmed by the seniors? Well, to view a key chart that supports this thesis:
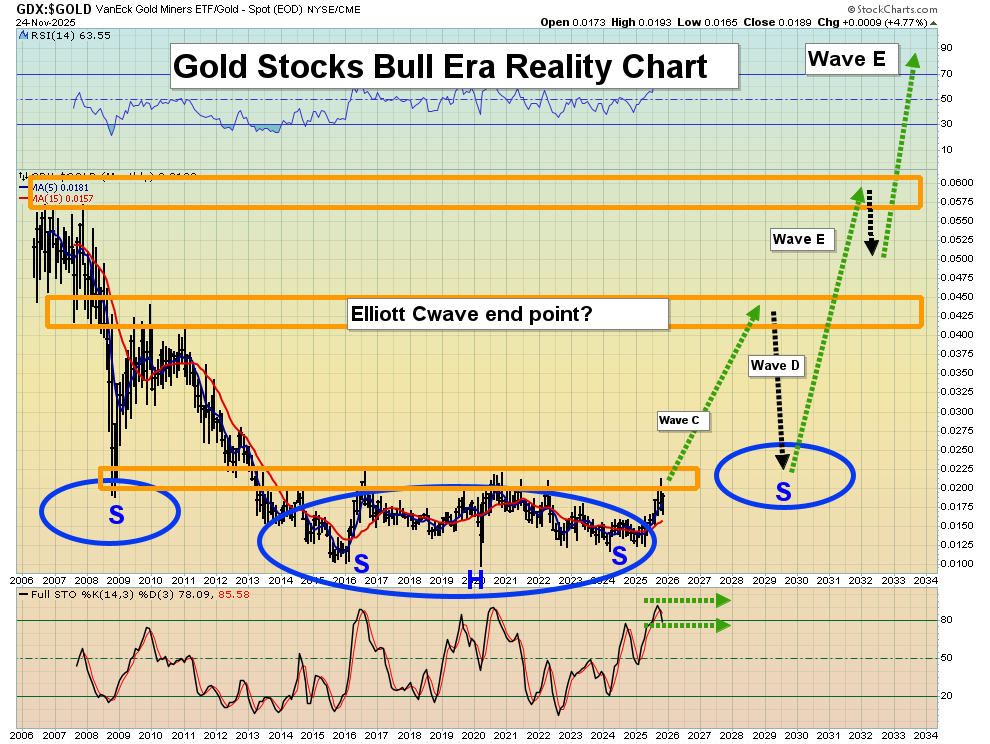
This is clearly one of the most enticing charts in the history of markets; the long-term GDX versus gold chart.
Incredibly, the inverse H&S pattern on this chart is in perfect sync with the one on the CDNX chart. This kind of bullish synchronicity opens the door to much higher price scenarios…
For both the juniors and the seniors.
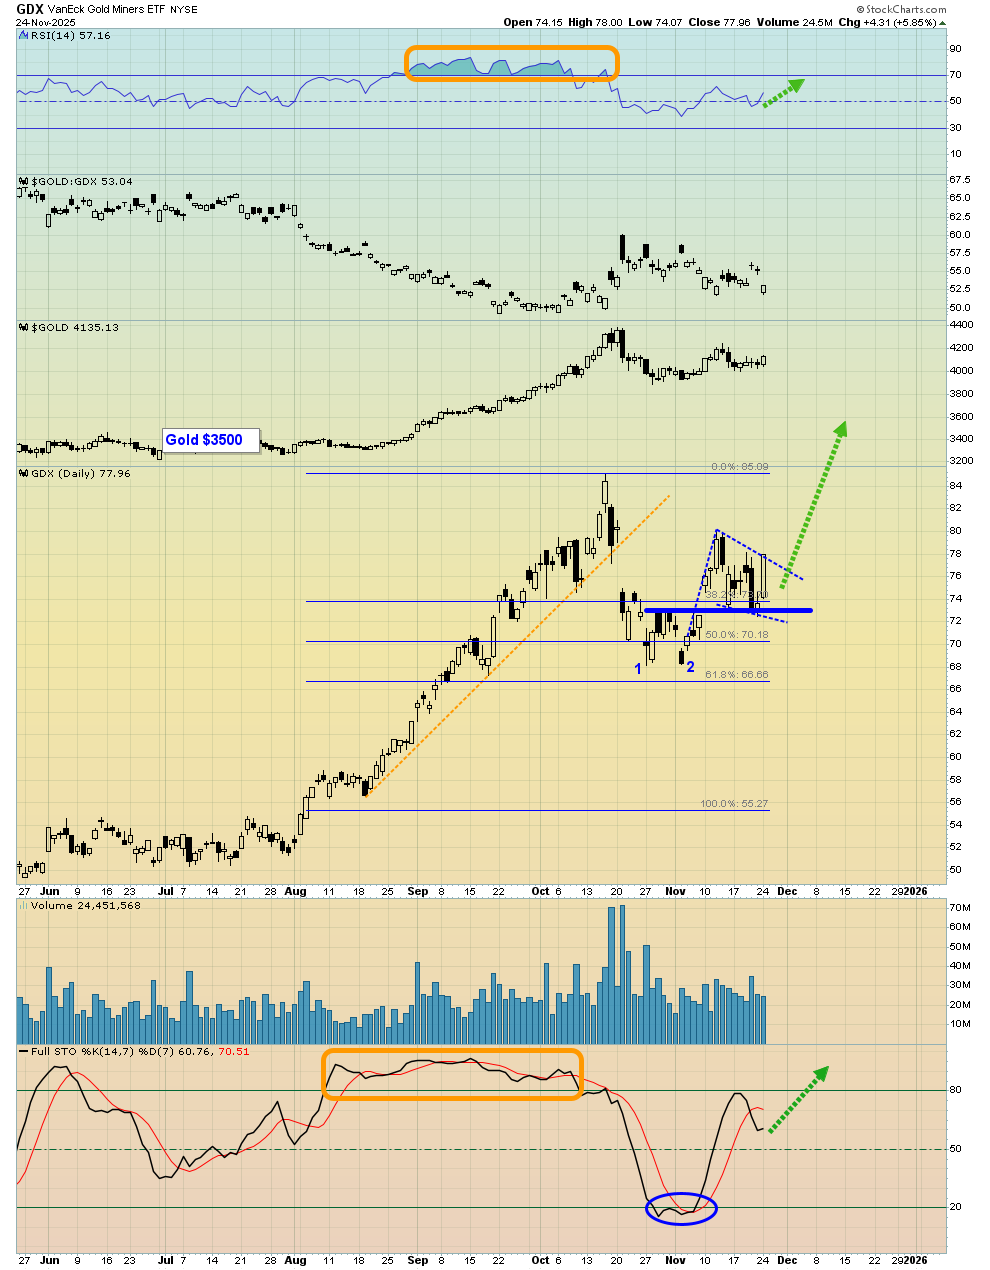
This is the GDX daily chart. Stochastics looks perky just above the 50 mark and there’s a double bottom with a flag-like drift in play.
Anyone light on miners could consider doing some buys now, because while the $3500 zone for gold would create truly stupendous value, a pullback to that price is becoming less likely to occur. As noted, it’s the end of the putrid war cycle and the start of the exciting year of the horse. All mine stock jockeys may want to consider making their way to the bull era gate now, to be sure they are ready to race!
Thanks!
Cheers
St
Special Offer For Gold-Eagle Readers: Please send me an Email to [email protected] and I’ll send you my free “Get Jacked With J!” report. I highlight key GDXJ stocks that could surge after Fed man Jay’s speech this week! Both core and trading position tactics are included in the report.
Stewart Thomson
Galactic Updates
Note: We are privacy oriented. We accept cheques, credit card, and if needed, PayPal.
Written between 4am-7am. 5-6 issues per week. Emailed at aprox 9am dailyhttps://www.gracelandupdates.com/
Email:
Rate Sheet (us funds):
Lifetime: $1299
2yr: $299 (over 500 issues)
1yr: $199 (over 250 issues)
6 mths: $129 (over 125 issues)
To pay by credit card/paypal, please click this link:
https://gracelandupdates.com/subscribe-pp/
To pay by cheque, make cheque payable to “Stewart Thomson”
Mail to:
Stewart Thomson / 1276 Lakeview Drive / Oakville, Ontario L6H 2M8 Canada
Stewart Thomson is a retired Merrill Lynch broker. Stewart writes the Graceland Updates daily between 4am-7am. They are sent out around 8am-9am. The newsletter is attractively priced and the format is a unique numbered point form. Giving clarity of each point and saving valuable reading time.
Risks, Disclaimers, Legal
Stewart Thomson is no longer an investment advisor. The information provided by Stewart and Graceland Updates is for general information purposes only. Before taking any action on any investment, it is imperative that you consult with multiple properly licensed, experienced and qualified investment advisors and get numerous opinions before taking any action. Your minimum risk on any investment in the world is: 100% loss of all your money. You may be taking or preparing to take leveraged positions in investments and not know it, exposing yourself to unlimited risks. This is highly concerning if you are an investor in any derivatives products. There is an approx $700 trillion OTC Derivatives Iceberg with a tiny portion written off officially. The bottom line:
Are You Prepared?
********
 Stewart Thomson is president of Graceland Investment Management (Cayman) Ltd. Stewart was a very good English literature student, which helped him develop a unique way of communicating his investment ideas. He developed the “PGEN”, which is a unique capital allocation program. It is designed to allow investors of any size to mimic the action of the banks. Stewart owns GU Trader, which is a unique gold futures/ETF trading service, which closes out all trades by 5pm each day. High net worth individuals around the world follow Stewart on a daily basis. Website: www.gracelandupdates.com.


