Six Days into 2026, Gold and Silver Net Upticks


Six trading days into 2026 find Gold having already netted a year-to-date gain of +4.3% and Silver +12.4%. Or … just in case you’re scoring at home … to go deeper inside the data for the 138 hours so far traded, 81(59%) have been up for Gold and 75 (54%) have been up for Silver.
Moreover, from the “‘Tis Too Early to Extrapolate Dept.”, Gold at its current year-to-date regressed growth pace would achieve our 5546 forecast high for 2026 come 27 February. Too early, indeed, perhaps too much detail. Yet it punctuates just how positive are the precious metals’ internals thus far into the young year.
“And like you say, mmb, markets don’t move in a straight line…”
‘Tis axiomatic, Squire, given markets’ means reversion is natural phenomenon  “do-doo-de-do-doo” –[Henson, ’69]. For as we’ve herein quipped over the years: “The markets are never wrong; but they can be vastly misvalued.”
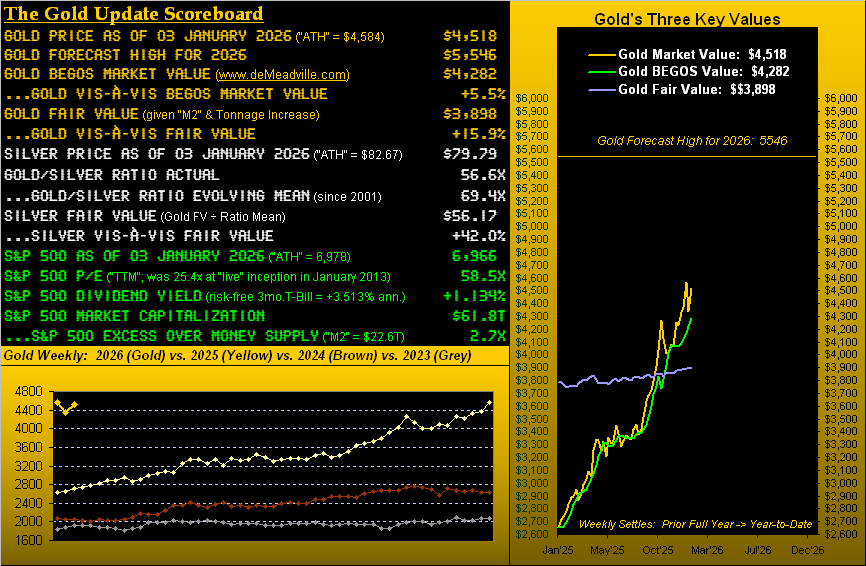
And thereto, overvaluation is the present state of both the precious metals — and far more so — that of the S&P 500. As depicted in our above newly-enhanced Gold Scoreboard, whereas Gold settled this past week yesterday (Friday) at 4518, ’tis +5.5% above its BEGOS Market Value* of 4282, and further, +15.9% above Fair Value of 3898. Too, Silver’s settle at 79.79 is +42.0% above her Fair Value of 56.17. So clearly there will be price retrenchment for both the yellow and white metals as the year unfolds, albeit within the broader context of Gold getting to 5546.
(*Valuing Gold by its price movement relative to those of the five primary BEGOS Markets: Bond, Euro, Gold, Oil, S&P 500).
As to the S&P 500, today’s market capitalization of $61.8T is 2.7x the supportive StateSide liquid money supply (“M2”) of $22.6T. And as we wrote in last Thursday morning’s Prescient Commentary, the S&P: “…settled [Wednesday] with a “live” P/E of 57.2x, more than double from its inception 13 years ago [meaning] earnings have since grown at less than half the rate of the S&P itself…” Then yesterday, the S&P recorded yet another record high (6978), boosting such price/earnings ratio to now 58.5x per the Scoreboard .
Again we reprise Jerome B. Cohen: “…in bull markets the average [P/E] level would be about 15 to 18 times earnings…” What that means for you WestPalmBeachers down there is by buying the S&P as a whole unit today, you’d pay $58.50 for something that earns $1.00 (an implied yield of 1.709%, the actual dividend yield by the Scoreboard being 1.134%), all whilst facing a “means reversion” capital risk of worse than -50% upon it all going wrong.
‘Course for Gold, ’tis all going well, (and by present valuation too well, but hardly shall we complain). For the 52 weekly settles from one year ago-to-date, Gold is trending higher at a rate of +1.1% per week. At such pace, price a year from now would be dubiously 7843. Comparably, by century-to-date, there’s been but one other mutually-exclusive similar pace: from mid-May 2005 to mid-May 2006, (price recording a +69% run from 421 to 712). History — as is its wont — has thus repeated as we go to Gold’s weekly bars since this a date year ago, the blue-dotted parabolic Long trend now five weeks in duration:
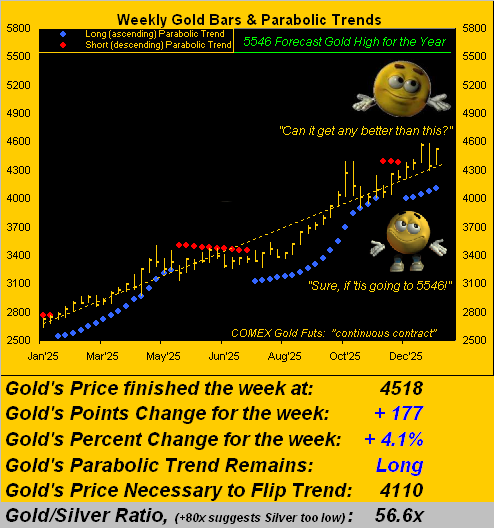
To be sure, given our forecast for 5546 this year, we’re anticipating such higher Gold even as the noted “overvalued” speedbumps certainly shall retard present pace. Of more import, Gold is getting the broad-based bid of which it has been so deserving throughout this century. But as charter reader JGS of the very first edition of The Gold Update said away back in 2009: “There’s always the overshoot.” Yet even as we’re now seeing that, it legitimizes a growing “awareness” (yucky word as ’tis) over ever-potential currency instability — even as the Dollar is getting a notable bid in starting the year — and certainly so, proliferating geo-political instability. ‘Tis a world on the edge in so many respects, be it asset overvaluations and/or sovereign nation invasions.
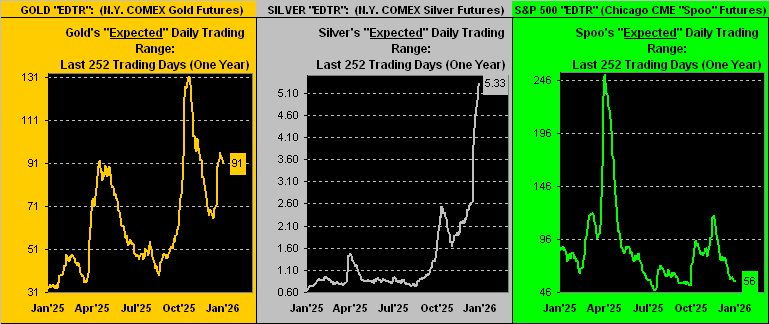
Further evidence of the precious metals being in play is measured by their respective “expected daily trading range” (“EDTR”). From the website, here are the current EDTRs for Gold on the left, Silver at center, and the S&P 500 “Spoo” futures on the right. The time frame is from one year ago through yesterday. (For our rookie readers, this is not price direction; rather ’tis how much range by points we expect each market to cover for the following trading day). And quite obviously, the precious metals are characterized by volatility well-exceeding that for the stock market: Gold’s current EDTR of 91 points equates to $9,100/contract of range expected (in this case) for Monday; Silver’s EDTR of 5.33 points equates to $26,650/contract of range expected, but the S&P 500 futures EDTR of 56 points equates to “only” $2,800/contract of range expected. Query: “What are YOU trading?”
Peeking a bit further into the S&P, despite it having recorded an all-time high yesterday, the mighty Index appears rather lackluster into this new year. Through the first six trading days for each of the 26 trading years century-to-date, this year’s low-to-high S&P range of 2.3% ranks a wee 20th. ‘Course, there hasn’t been that much fundamentally upon which to trade (the exception being the recklessly high P/E). Also, Q4 Earnings Season has only just started, wherein for the 23 companies thus far having reported, 78% beat estimates — but only 43% actually bettered their bottom line of Q4 a year ago; (‘course in this Investing Age of Stoopid, “earnings growth” has no relevance whatsoever).
Too, there’s been little economic data provided thus far in 2026: just nine metrics have been reported, of which four were in arrears from the StateSide “shutdown”. The metric getting the most FinMedia notice is December’s Unemployment Rate, having dropped a pip from 4.5% in November to 4.4%, (even as an already anemic Payrolls growth slowed from November, itself revised lower; and the December estimate was missed). Here’s the Economic Barometer, featuring the record high S&P, and from the website, everybody’s favourite P/Es. Stoopid indeed:
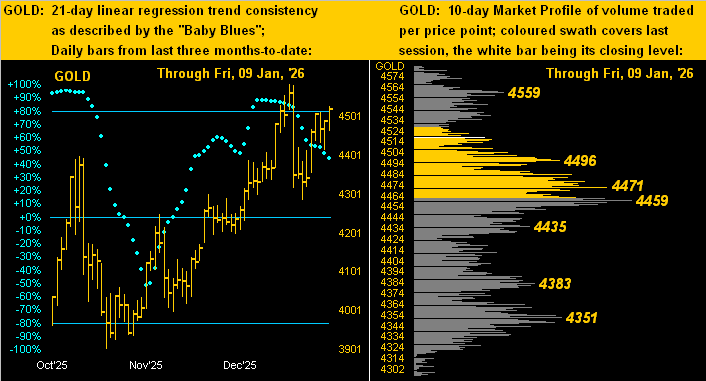
Returning to the intelligent side of investing, here next we’ve our two-panel graphic of Gold’s daily bars from three months ago-to-date at left and 10-day Market Profile at right. The yellow metal’s baby blue dots of trend consistency continue to trickle lower; and by the Profile, Gold’s most volume-dominant support price shows as 4459:
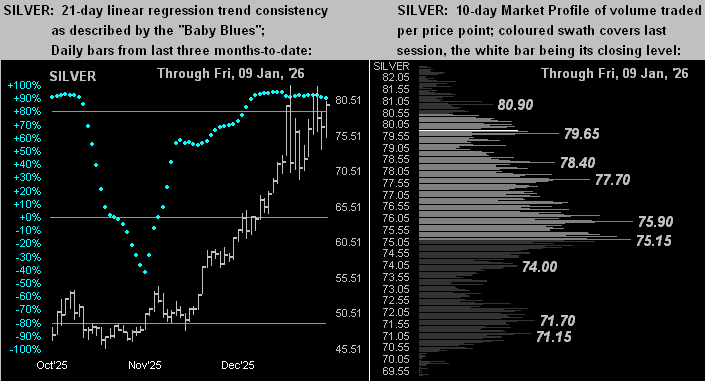
The like drill for Sister Silver still finds her “Baby Blues” above the key +80% axis, her on-balance December rise having been more uniform than that for Gold. And by the white metal’s Profile, the 75s appear as the most supportive area at present:
Supportive indeed for the precious metals are the aforementioned concerns over the world becoming a bit more wobbly. Regardless, anticipated trimming of recently netted gains “ought” not be too much of a concern. As to technically monitoring it all, we’ve this from our Market Rhythms’ analyses, with the corollary that ’tis — whilst current — measured via hindsight per each study’s last ten swing signals, (even as “shorting Gold is a bad idea”):
- Gold: for pure swing consistency, its best study of late has been the Parabolics on the 12hr time frame, else if targeting a profit per swing, the daily MACD;
- Silver: for pure swing consistency, her best study of late has been the Parabolics on the 30mn time frame, else if targeting a profit per swing, the 2hr MACD.
And, as always, remember: just because a technical study has profitably panned-out ten times in-a-row, ever-shifting market dynamics can bring such streak to an abrupt halt time and again.
“Yer sure givin’ it all away today, mmb…”
Just our way of humbly sharing with our valued readers what we’re seeing, Squire. Here’s to Gold and Silver!

Cheers!
…m…
www.TheGoldUpdate.com
www.deMeadville.com
and now on “X”: @deMeadvillePro
*********

Mark Mead Baillie has had an extensive business career beginning in banking and financial services for two years with Banque Nationale de Paris to corporate research for three years at Barclays Bank and then for six years as an analyst and corporate lender with Société Générale.
For the last 22 years he has expanded his financial expertise by creating his own financial services company, de Meadville International, which comprehensively follows his BEGOS complex of markets (Bond/Euro/Gold/Oil/S&P) and the trading of the futures therein. He is recognized within the financial community of demonstrating creative technical skills that surpass industry standards toward making highly informed market assessments and his work is featured in Merrill Lynch Wealth Management client presentations. He has adapted such skills into becoming the popular author each week of the prolific “The Gold Update” and is known in the financial website community as “mmb” and “deMeadville”.
Mr. Baillie holds a BS in Business from the University of Southern California and an MBA in Finance from Golden Gate University.


