…And That’s What A Reversal In Gold Looks Like


The combination of reversals that we are approaching is truly exceptional. Four different markets, many different lines and they all point to the same time-frame in which we should see a reversal of a huge importance. It seems that the markets almost can’t wait. Are these already the first baby steps of the huge move that is to follow, or will we see one additional tricky move before THE reversal itself takes place?
Before replying, let’s take a look at the charts.
Precious Metals’ Reversals
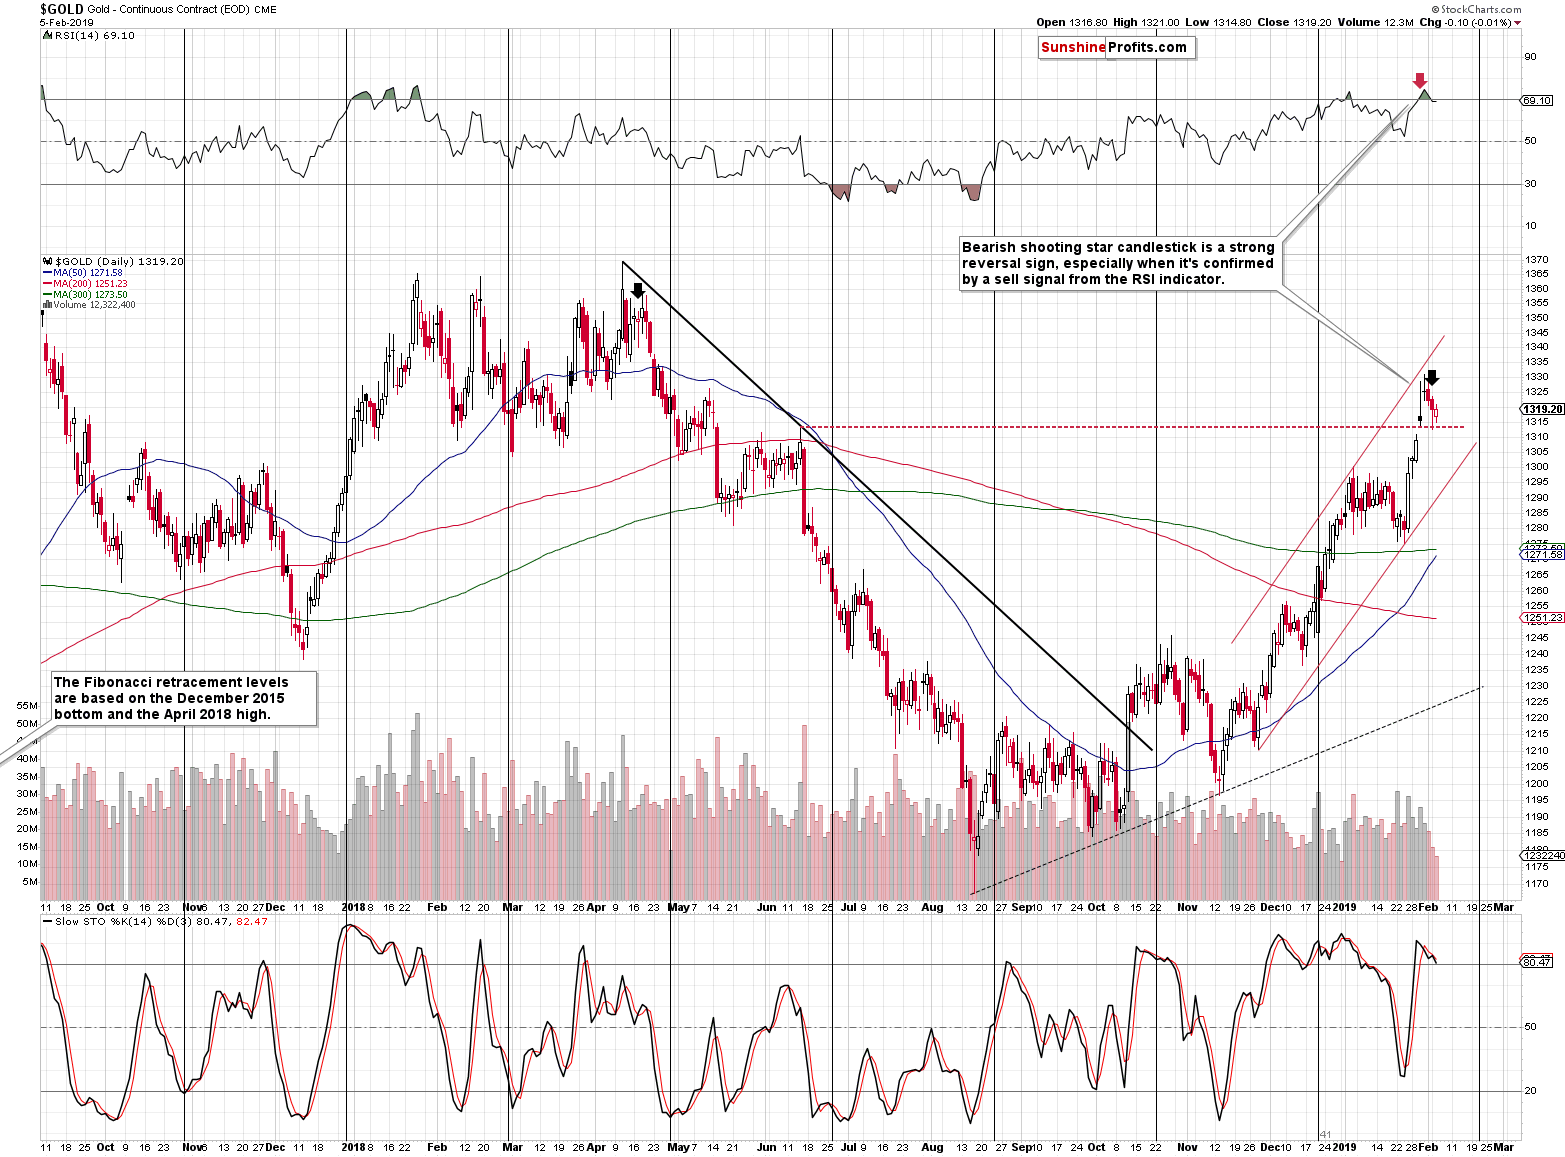
Gold formed a bearish shooting star reversal, then a doji, which is also a sign of reversal, and then it declined by a bit.
It’s also been declining in today’s pre-market trading. At first sight, this seems bearish. And this time, the first impression is correct – these are the signs of reversal taking place. The RSI above 70 confirms that we are indeed looking at a top.
Gold did move above the June high, but it was able to do so only after very dovish comments from the Fed and the size of the move actually should have been much greater. Gold had little choice but to rally given the importance of the announcement, but the size of the move is what tells us a lot. Why didn’t gold move higher? That’s an important hint for gold traders that tells us that gold’s rally is running out of steam. And there are multiple factors ready to come into play when gold finally reverses that will make sure that the following decline is huge.
On a short-term note, we could still see another move to the recent highs this week, but this is far from being certain.
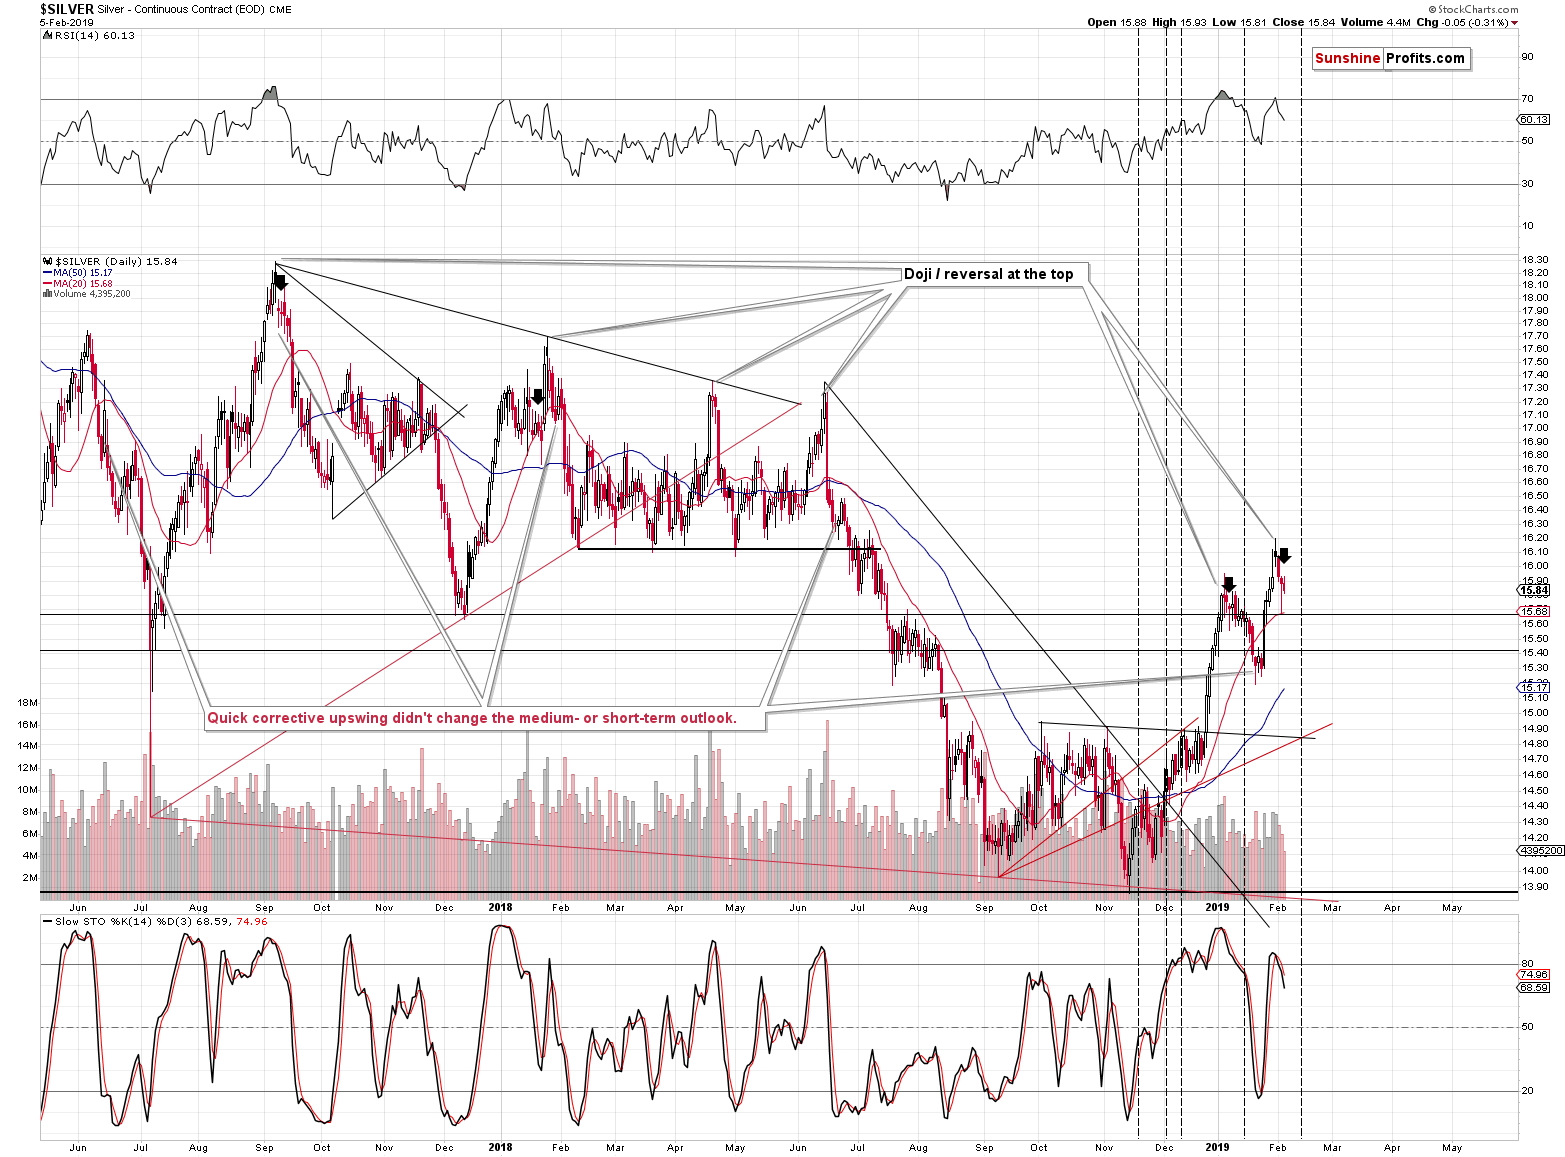
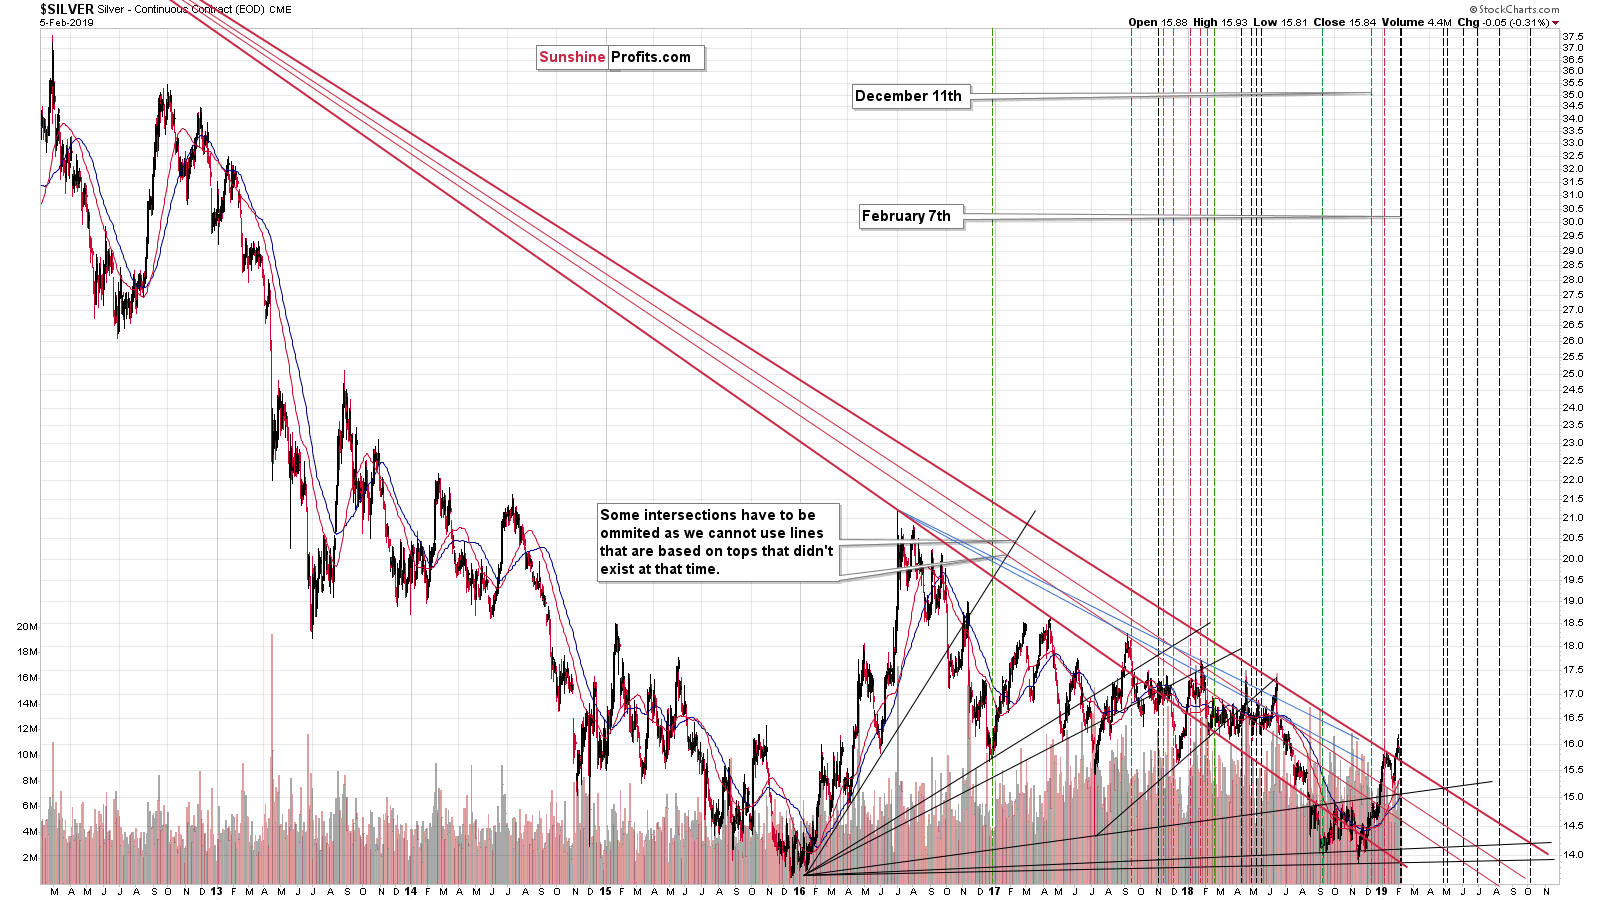
The reversal process is even clearer in case of silver. Especially, when we factor in today’s pre-market decline.
Silver moved above the early 2019 high, but not significantly so, and right now it’s back below the early-January intraday high. The only similar situation is what happened in early 2018. That’s when silver moved briefly above the previous local highs, topped (higher silver prices were never seen since that top), and then declined in a quite specific manner.
It first moved back below the early highs (just like what we see right now) and then one more time (precisely, there were two intraday attempts) tried to rally. That was the final chance to go short. A repeat of this scenario fits the prediction for silver’s upcoming reversal particularly well.

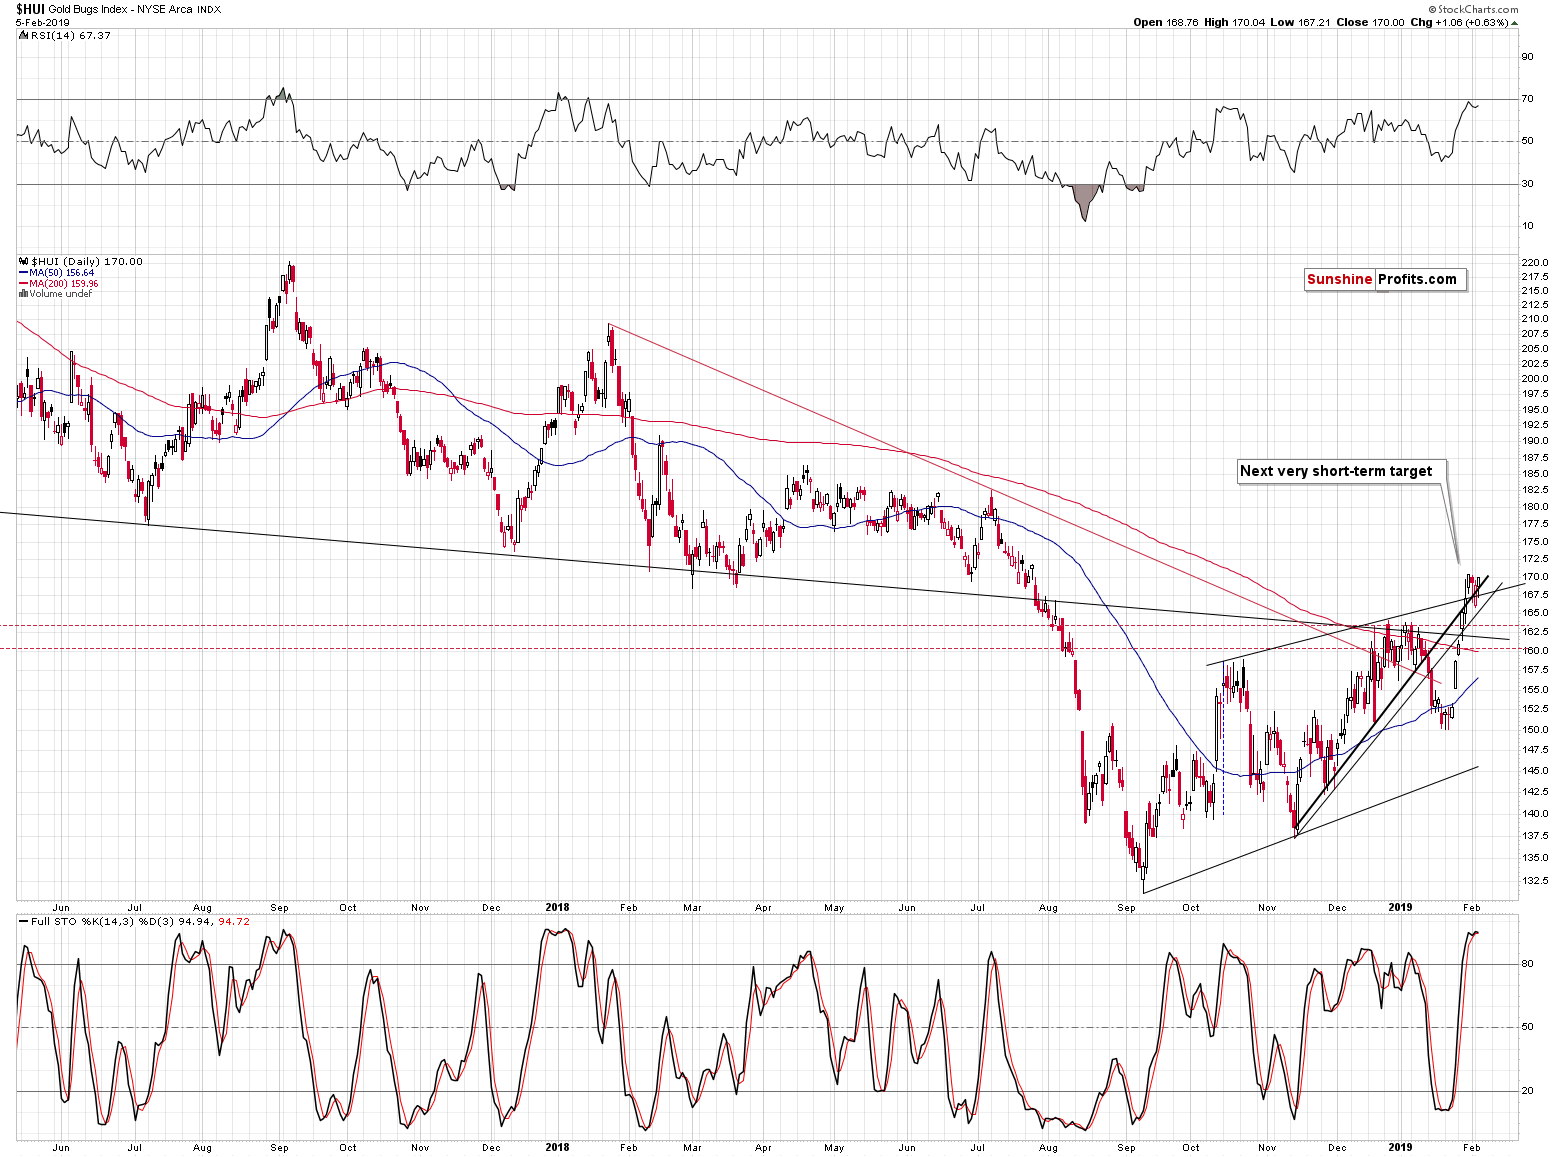
Gold stocks managed to close above their resistance level for a few days in a row, but given today’s pre-market move in gold, it seems that this breakout will be invalidated shortly. Invalidations of breakdowns are strongly bearish developments, which will likely result in even lower prices. And that’s how the reversal in the mining stocks might form. There could be another move higher before THE decline starts, but the invalidation of the breakout will already serve as a confirmation of what’s to come.
The Looming Reversal
The key issue right now, not only in case of gold, silver, and mining stocks, but also in case of the USD Index is the looming combination of reversals, so let’s take a closer look at the charts featuring them.
We will quote what we wrote about them over 2 weeks ago and we will supplement it with additional comments.
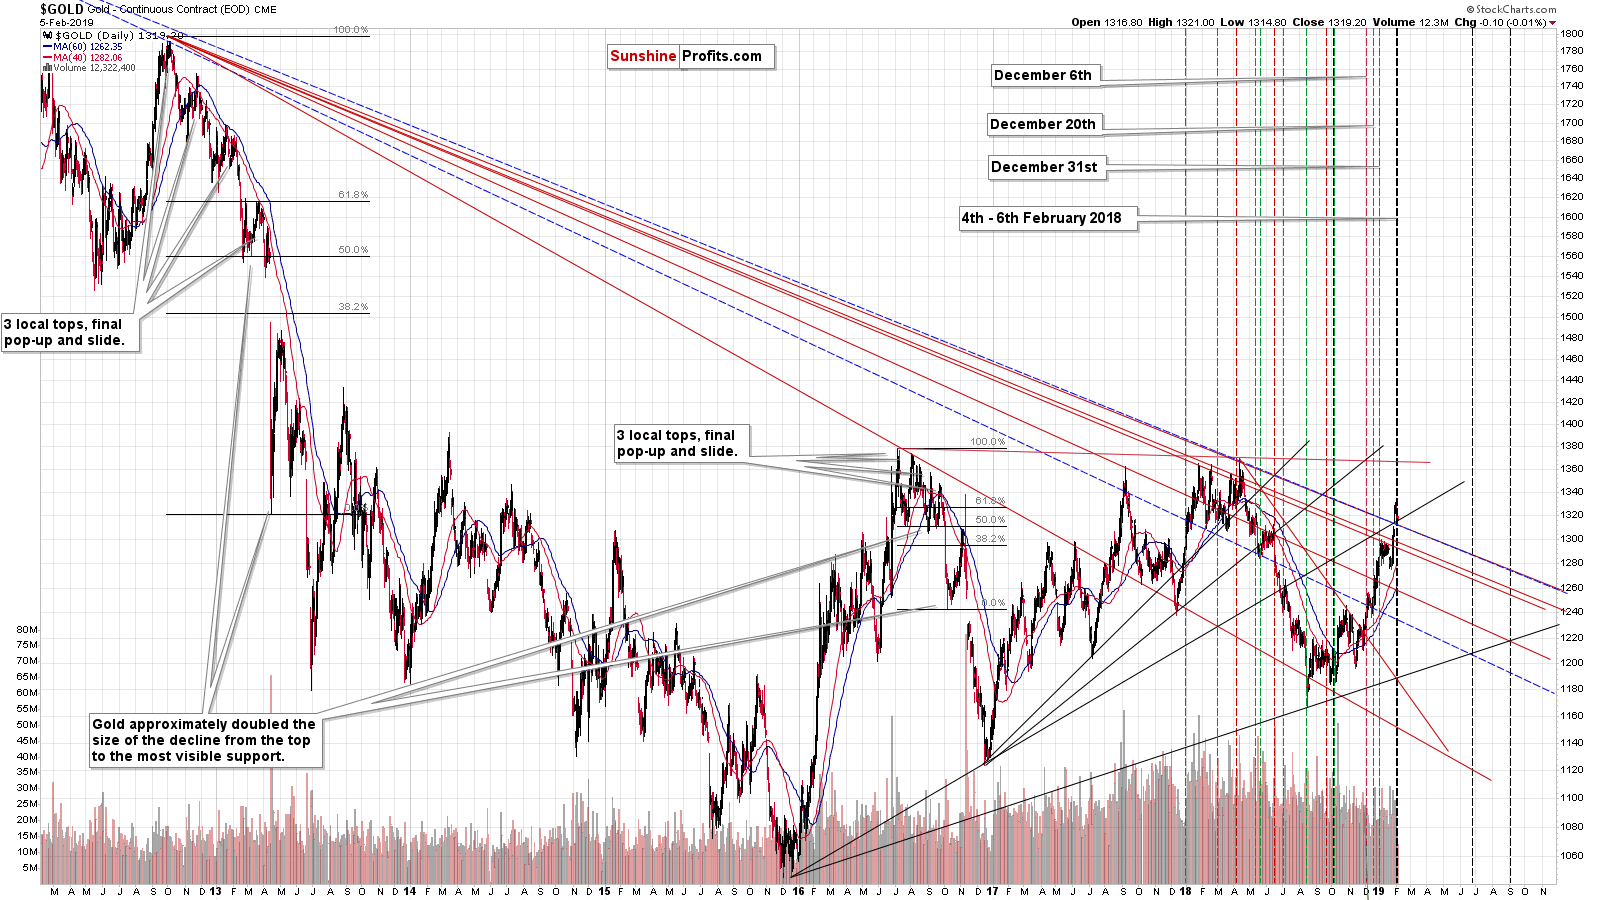
There are two apexes in early February, suggesting a strong reversal. After that, there are no indications of this technique (at least not based on the long-term lines) for the following months. The next reversal is in late June.
The key resistance and support lines are more clearly visible on the chart below:
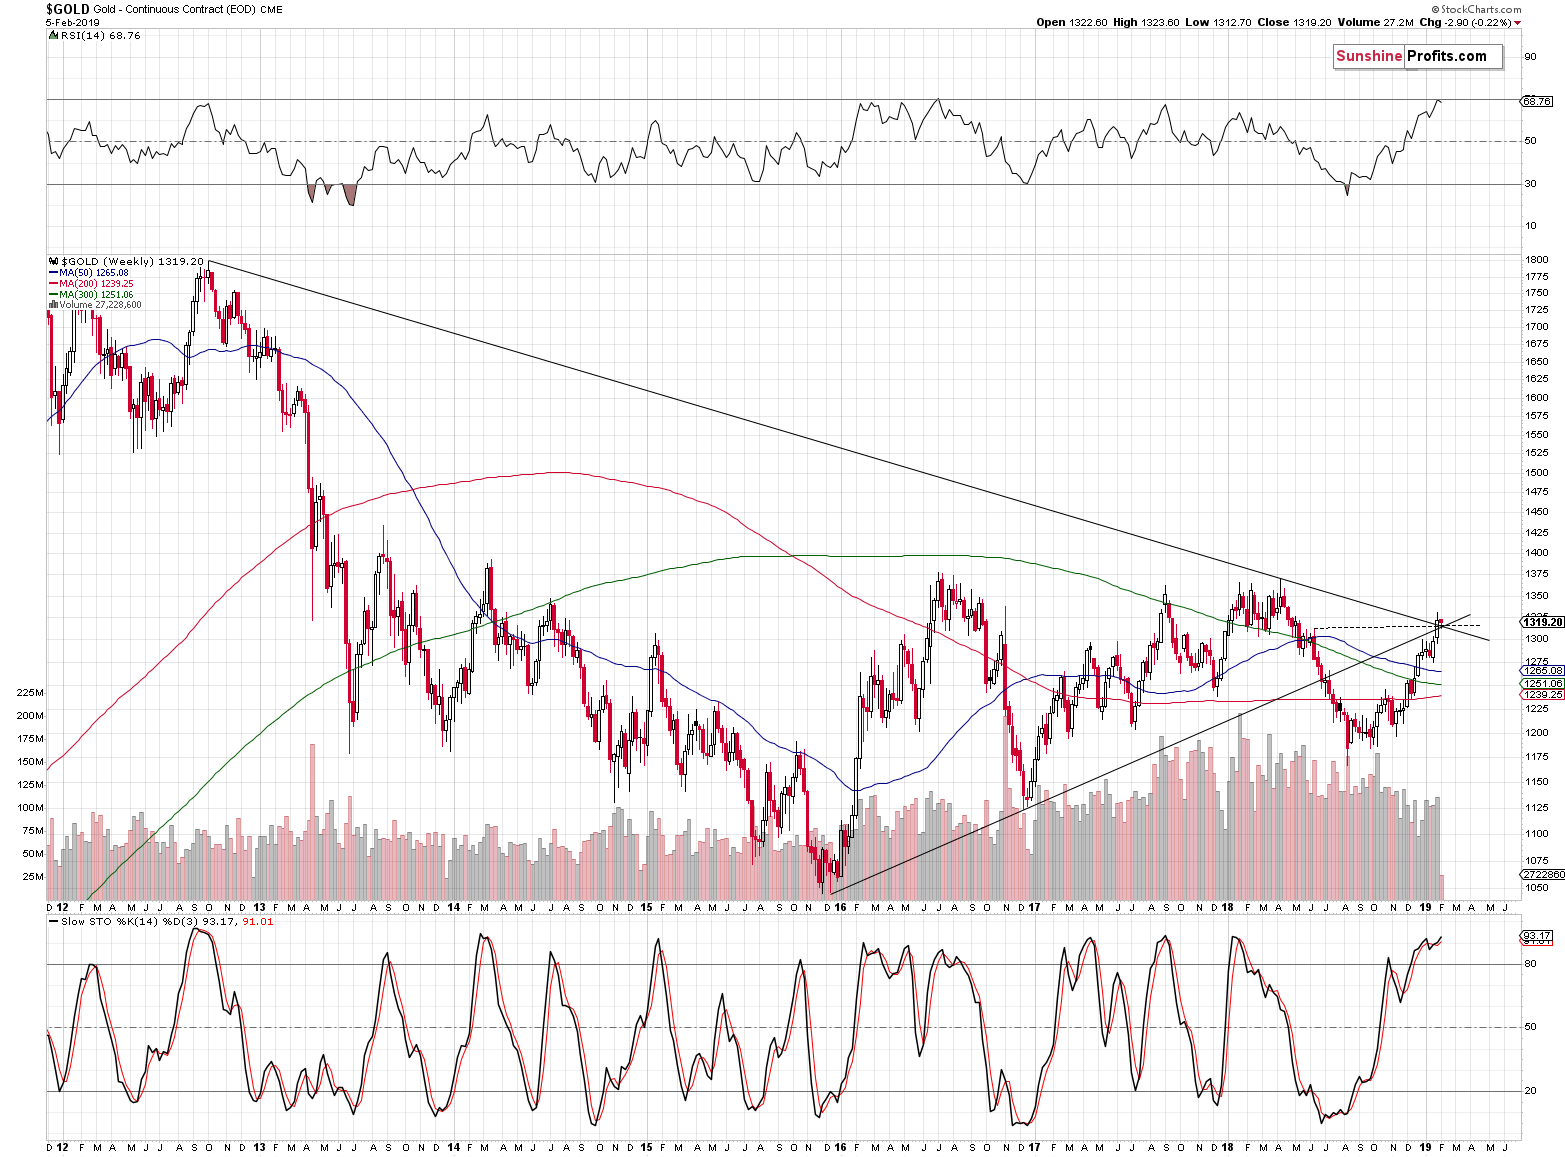
The vertex of the key triangle is this week and the weekly RSI just touched the 70 level, confirming that gold is ready for a major decline. Moreover, please note that the recent upswing took place on relatively weak volume in gold. The volume on which it had declined in the first half of 2018, was visibly bigger. It’s difficult to imagine more a bearish combination of strong factors with proven track record.
Again, quoting the same alert as above:
(...) The above chart fully confirms the signals from USD and gold. This is remarkable, because these lines are based on totally different charts. Yet, they provide a signal at the same time. Just like in case of gold, there are two vertexes that point to a reversal in early February. Then – again just like in gold – there are no reversals after the nearest one until we’re close to the middle of the year. In silver, the second nearest reversal is in late April / early May. It’s notable that there is also a reversal at the end of June.
It’s even more notable that when there were no reversals for longer (mid-2018), silver simply declined. And it declined far. That’s not a strong analogy, but still, it’s another confirmation that we can expect a sizable slide shortly.
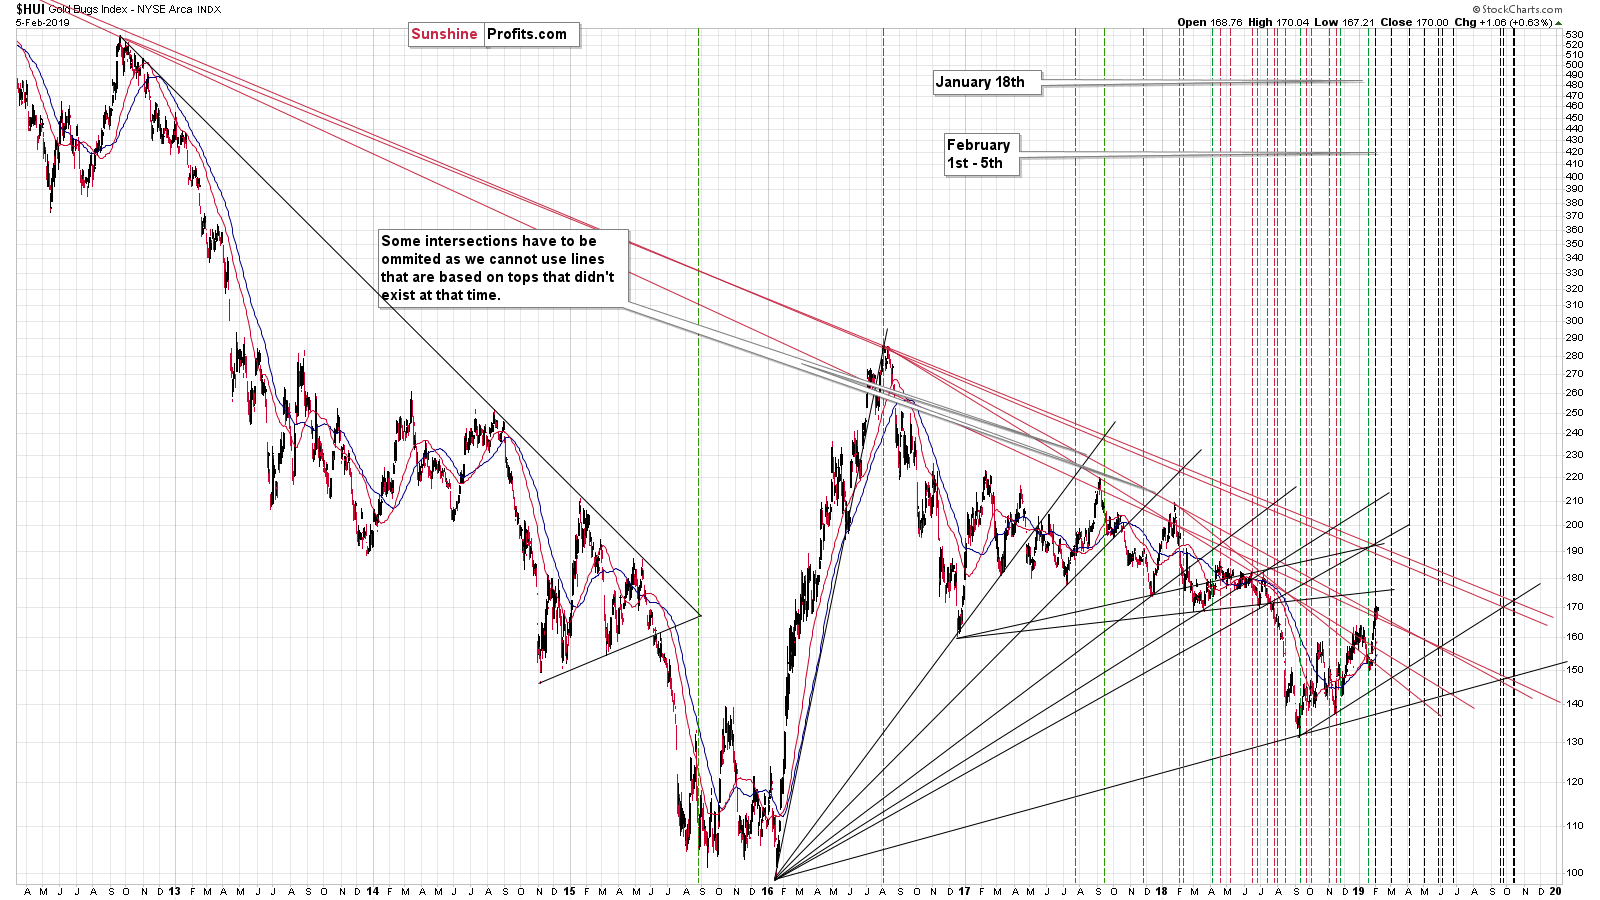
In case of gold stocks, we have one reversal right about now and – unsurprisingly – one coming at the end of January or in early February. Then there are a few extra reversals, but there is also one due in late June, just like in silver and gold.
The reversal that we have right now doesn’t tell us anything new. We already know that we might see a quick pop-up higher (and that’s exactly what happened), perhaps due to USD’s short-term decline (again, exactly what happened). But, the reversal at the end of the month (or early in February) emphasizes how important this date is. All key parts of the precious metals market and also the USD Index suggest that something major will happen in about 3 weeks. This is confirmed by total of 8 reversal signals (3 in USDX, 2 in gold, 2 in silver, and 1 in gold stocks).
(…)
The next major turnaround that all PM charts emphasize is in late June – perhaps this is where we should expect the final bottom for this prolonged decline in the precious metal sector.
Before summarizing, we would like to discuss the outlook for gold given the current situation in the USDX.
Gold and USD Link Revisited
Let’s examine the relationship between gold and USD Index from an angle that’s different than what’s usually presented – let’s look at their correlation. There are periods when both are moving in the same direction and there are times when the direction differs. The same can be said about the strength of the link, i.e. how closely, with what strength, these movements translate into one another. We look at correlation of gold price movement with USD Index in the context of the gold bear market, starting from the 2011 top.
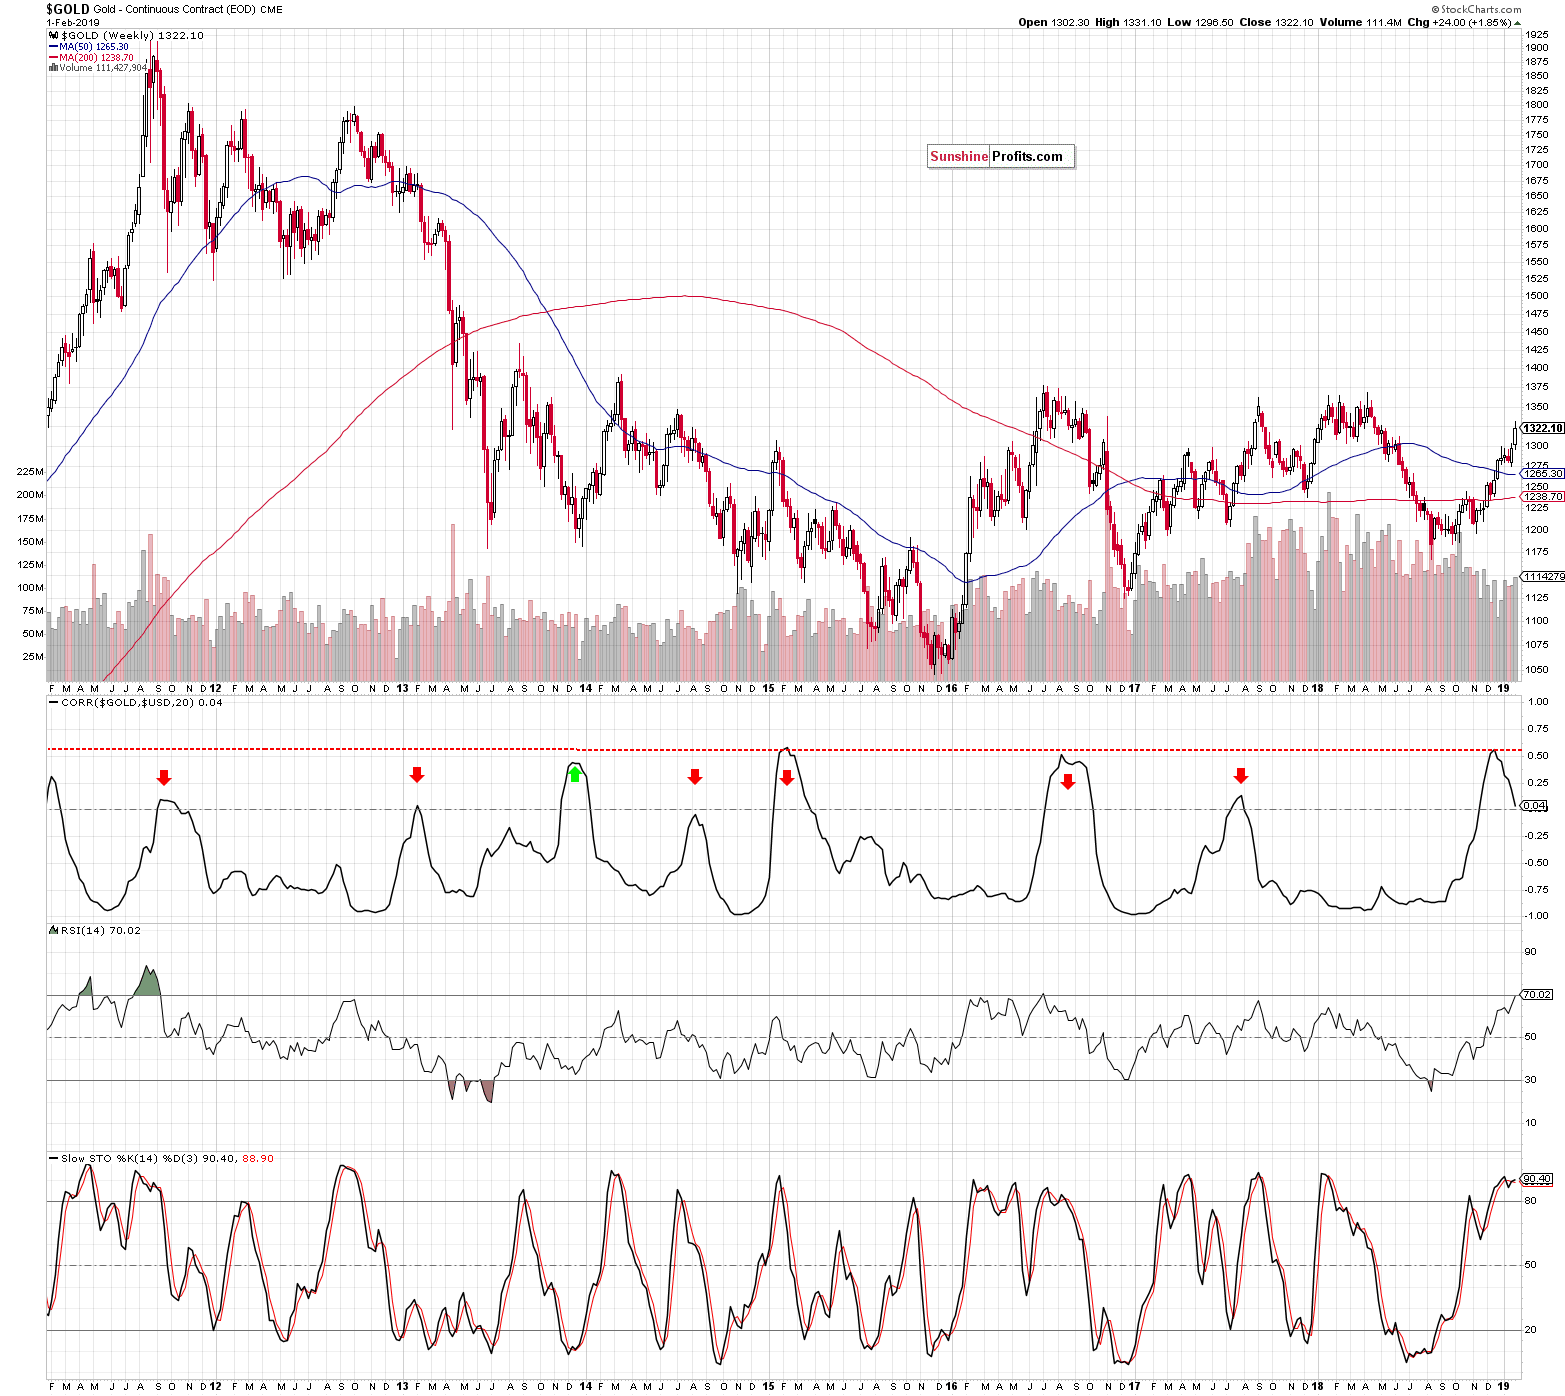
Positive correlation means that both are moving in the same direction. The red line represents the extremes of tightness of mutual movements - we have one instance almost touching it in Dec 2013, one in Feb 2015, one in Aug 2016 and finally now. Only the first one (end of 2013) resulted in gold price upswing (that was eventually reversed though) - the other two marked a sharp or prolonged top followed by declines. Currently, the top in positive correlation looks to be in but the price has not yet followed it down. Should it be a cause for concern? Not really, as it is not necessarily a precise timing tool – it works best in catching the direction of the next move right. Take a look at the similar situation in Q3 2016 when we first got a gold price upswing and only then the fall.
The current situation therefore favors the forecast in which gold declines. We see additional support for the bearish resolution in overbought RSI at almost 70 – again, this has marked good shorting opportunities in the past.
What about local tops in correlation coefficient? Could we get a clearer answer from them? Yes. Anytime the correlation turned briefly positive or even only approached zero, it meant good shorting opportunities (the top of Sep 2011, Feb 2013, Aug 2014 and slightly prematurely Aug 2017). This also points to a likely decline.
Another Look at Gold and Gold-Miners-to-Gold Ratio
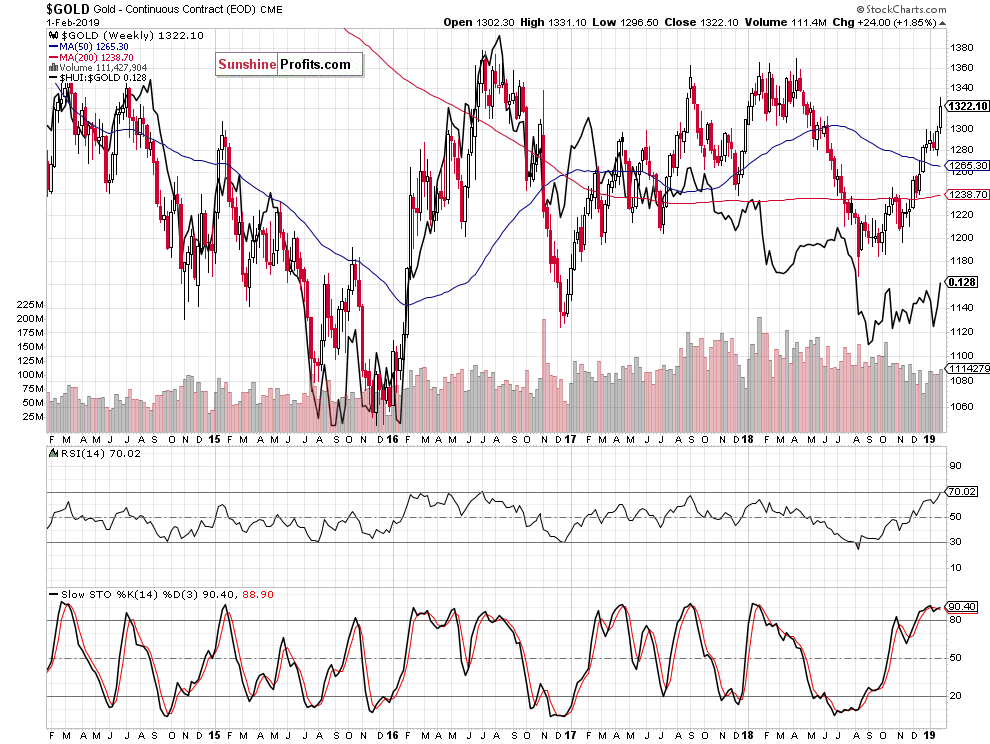
Overlaying gold and its ratio to the miners will provide us with a valuable and visually rich perspective. Namely, we will see the closeness of interdependency, its sensitivity and how well gold price approximates its leading indicator (the gold miners’-to-gold ratio). In short, the ratio’s feeble performance since the Aug 2018 lows shows a non-confirmation of the gold price upswing from these lows. Just look at how well tuned these two were during the decline to the late 2015 lows and also during the significant 2016 countertrend gold price upswing. Comparing to the 2016 rally, this shows how different the 2018 rally really is. The ratio simply suggests that the link between now and 2016 is either weak or doesn’t exist at all. This is not bearish on its own, but it emphasizes that the outlook is not bullish.
What about the answer to the question from the opening paragraph of today’s analysis?
In short, both outcomes are possible, and it seems best to be positioned in a way that should not be affected by the above dilemma. The trades focusing on several days are at the greatest risk right now. Either zooming out (focusing on the big move, which is our preferred take here) or zooming in (focusing on intraday moves, which some may prefer) lowers the exposure to the uncertainty regarding the next several days.
Summary
Summing up, the recent rally in the precious metals may appear encouraging, but it didn’t change the medium-term trend. In fact, since gold, silver, and mining stocks rallied right before the very powerful combination of reversals it means that the implications for the following weeks are bearish.
The very important detail about the most recent price moves is that they took place in light of a very positive news from the Fed. The thing is that the dovish comments from the Fed (“the case for raising rates has weakened somewhat”) should have caused a much more spectacular rally. Despite the intraday rallies that we saw yesterday and on Wednesday, gold is now just $2 higher, while it could have easily (based on the news alone) rallied $30 - $80 by now.
One of the most bullish situations in any market is when everything that could go wrong for it… Already did. The best confirmation of such bullishness is when the market doesn’t decline despite the facts that should make it decline. We seem to have just witnessed the exact opposite of the above. Gold doesn’t really want to move higher from here, and its technical situation is perfect for a start of a profound decline to the final lows of the prolonged slide that started in 2011.
The upside remains limited, while the downside remains enormous. The turning points are being reached this week, so we may either see a very brief upswing in the metals before the huge decline starts, or the latter may start right away.
Naturally, the above is up-to-date at the moment of publishing and the situation may – and is likely to – change in the future. If you’d like to receive follow-ups to the above analysis, we invite you to sign up to our gold newsletter. You’ll receive our articles for free and if you don’t like them, you can unsubscribe in just a few seconds. Sign up today.
Przemyslaw Radomski, CFA
Editor-in-chief, Gold & Silver Fund Manager
Sunshine Profits - Effective Investments through Diligence and Care
* * * * *
All essays, research and information found above represent analyses and opinions of Przemyslaw Radomski, CFA and Sunshine Profits' associates only. As such, it may prove wrong and be a subject to change without notice. Opinions and analyses were based on data available to authors of respective essays at the time of writing. Although the information provided above is based on careful research and sources that are believed to be accurate, Przemyslaw Radomski, CFA and his associates do not guarantee the accuracy or thoroughness of the data or information reported. The opinions published above are neither an offer nor a recommendation to purchase or sell any securities. Mr. Radomski is not a Registered Securities Advisor. By reading Przemyslaw Radomski's, CFA reports you fully agree that he will not be held responsible or liable for any decisions you make regarding any information provided in these reports. Investing, trading and speculation in any financial markets may involve high risk of loss. Przemyslaw Radomski, CFA, Sunshine Profits' employees and affiliates as well as members of their families may have a short or long position in any securities, including those mentioned in any of the reports or essays, and may make additional purchases and/or sales of those securities without notice.
 Przemyslaw Radomski, CFA, is the founder, owner and the main editor of SunshineProfits.com. You can reach Przemyslaw at: http://www.sunshineprofits.com/help/contact-us/.


