$1526: Gold's Centerpiece Price


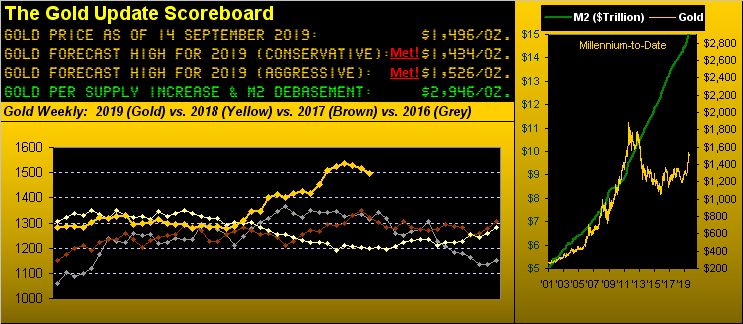
We've reminded our readers time-and-again per the above Gold Scoreboard that 1526 is our "aggressive" high forecast Gold price for this year. To be sure, following Gold reaching that 1526 target on 12 August (at 18:00 Pacific Time), price further punched through to trade as high as 1566 just a week ago ... only to have since sunk sub-1500 in settling out the week yesterday (Friday) at 1496.
But most remarkable given that 1526 was a significant "support becomes resistance" level from all the way back in 2013 -- the key rationale for selecting such price as this year's "aggressive" high -- is that since regaining 1526 this past 12 August, it has become Gold's Centerpiece Price. 'Tis stunning to so see when we look at it graphically: the red line in the below chart depicts 1526 across Gold's hourly trading track from 12 August through yesterday's close:

Thus from our purview for 2019, Gold 1526 has been a fairly accurate choice for price's topping out, notwithstanding the brief overshoot to 1566, price now back sub-1526.
Still, that stated: with better than three months to run in 2019, there's plenty of time for further fundamental Gold push given whatever chaotic flavour -- monetarily be it ramped up currency creation, globally be it trade war trepidation, politically be it private assets confiscation -- races to the fore. Forecast already by Goldman Sachs is Gold 1600 come January. More broadly, Bank of America Merrill Lynch muses that within two years we'll see Gold 2000, which we deem conservative (both the time-line and the 2000).
Indeed at the (albeit above-average) linear rate up at which Gold has raced this year-to-date, price in the regression vacuum would reach 1600 this 19 December. And from the extrapolated percentage growth rate of this year-to-date, Gold would eclipse 2000 precisely on 31 December 2020: "Happy New Year!" That's just 15 months from now.
Yet, with all the Gold positives working toward inflating the 3Ds of Debasement, Debt and Derivatives, the price of 1526 as our "aggressive" high selected this past New Year is now at the very least appearing as a pause en route to still higher levels, (should that area not turn out to have been the top). Technically 'tis especially so as we turn to Gold's weekly bars wherein -- as herein discerned a week ago -- the parabolic Long trend now sits on the precipice of flipping to Short. With price today at 1496, a trade sub-1492 -- just four li'l ole points from here -- bodes for lower levels f0r which we see structural support as found 'round 1454 down toward our "conservative" high at 1434 as met this past 25 June:
'Course in the midst of all this comes next Wednesday's (18 September) Federal Open Market Committee Policy Statement and Powell Presser toward justifying the voting to have cut their Bank's FedFunds rate by 0.25% from the present 2.00%-2.25% target range to that of 1.75%-2.00%. Now if you follow the trade of the FedFunds futures, you'll have noted a more aggressive expectation back 'round August's end for a 0.50% cut, trading having since wafted back to instead suggest the 0.25% cut. And the FOMC knows never to surprise Ms. Marché, so a 0.25% cut 'twill be. But in turning to our Economic Barometer, one wonders if they ought be cutting the rate at all, (not our first mention of such notion). Just because the European Central Bank has embarked on a stimulus spree in these final days of Prez Draghi doesn't have to translate into what we see. That noted, our Treasury Department's year-to-date deficit has just surpassed the $1 trillion level for the first time since 2012. Bit of an "uh-oh" there; but then again, "been there."
Still, as the balance of the world may be grasping for economic grip, the StateSide Economic Barometer, which just a week ago we depicted as bottoming, now is turning upward -- not perhaps at an overly convincing rate -- but up nonetheless is up. In fact month-over-month, the Econ Baro's August-September performance marks its best gain since June-July of 2018. And metrics coming into the Baro this past week included the University of Michigan's preliminary September Sentiment read leaping from August's 89.8 to 92.0. Retail Sales in August slowed from July's +0.7% pace to +0.4%: but that doubled the consensus expectation of +0.2%. August also found core inflation improving up to +0.3% at the wholesale level, that pace also maintained at the retail level. However, those positives noted, there was bloating in both Wholesale and Business Inventories levels for July. But bring it all into the Econ Baro and we see for the present an upswing. Still, the great mystery therein remains: when shall the S&P 500 (red line) race down -- as is its historical wont -- to meet the graphed level of the Baro? Can the perceived pre-2020-presidential election pump continue? A very vast gorge to bridge there, yet as we all know: markets can defy logic (the ongoing case being lack of earnings support for the S&P) far longer than can the contra-trend trader remain solvent. Here's the picture:
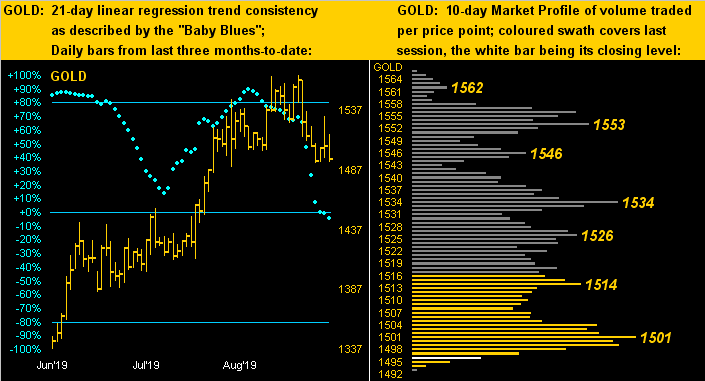
Meanwhile by our technical tool kit, the most telling component with respect to Gold's recent selling is (no surprise) the "Baby Blues" measuring of linear regression consistency having settled below their +80% axis back on 23 August, price then 1537. Now Gold is 41 points lower as below shown in the two-panel graphic of the daily bars from three months ago-to-date on the left with price all but at the bottom of the 10-day Market Profile on the right. You know our old rhyme: "Don't trade the news, just follow the Blues, else lose yer shoes":
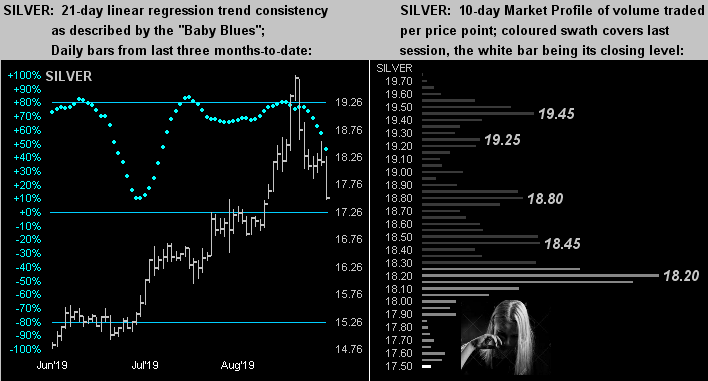
The same graphical construct applies to Silver: her "Baby Blues" (below left) having dropped below their +80% axis on 03 September when price was 19.365 versus today's level of 17.505, which in turn we find at the very bottom of her Profile (below right). Singin' the blues indeed is our Sister Silver:
So as to stack it all up for Gold, here indeed is the Gold Stack:
The Gold Stack
Gold's Value per Dollar Debasement, (from our opening "Scoreboard"): 2946
Gold’s All-Time High: 1923 (06 September 2011)
The Gateway to 2000: 1900+
Gold’s All-Time Closing High: 1900 (22 August 2011)
The Final Frontier: 1800-1900
The Northern Front: 1750-1800
On Maneuvers: 1579-1750
2019's High: 1566 (04 September)
10-Session “volume-weighted” average price magnet: 1525
Trading Resistance: 1501 / 1514 / 1526 / 1534 / 1546 / 1553 / 1562
Gold Currently: 1496, (expected daily trading range ["EDTR"]: 24 points)
10-Session directional range: down to 1492 (from 1566) = -74 points or -4.7%
The Weekly Parabolic Price to flip Short: 1492
Trading Support: none (per the Market Profile)
The Floor: 1466-1579
Le Sous-sol: Sub-1466
Base Camp: 1377
The 1360s Double-Top: (1362 in Sep '17 and 1369 in Apr '18)
Neverland: The Whiny 1290s
The 300-Day Moving Average: 1303 and rising
The Box: 1280-1240
2019's Low: 1267 (02 May)
As we glide into next week, 'tis of course all about the Fed Follies come Wednesday. Specific to Gold, as noted we expect the weekly parabolic trend to flip from Long to Short, but with the downside limited only to the aforementioned 1454-1434 zone, if even that low at all. Gold remains in bullish play and price simply sub-the Big Round Number of 1500 ought keep the bargain hunters a-buyin', thus furthering Gold's Centerpiece Price of 1526 to be revisited in due course this year.
We close with a thought a prayer for the Mighty Bob Moriarty on the sudden passing of his wife Barbara this past week. Bob credits her as "the genius of 321gold" which monumentally initiated the global readership we so value today. RIP Lady Barbara.
www.deMeadville.com
www.TheGoldUpdate.com
********

Mark Mead Baillie has had an extensive business career beginning in banking and financial services for two years with Banque Nationale de Paris to corporate research for three years at Barclays Bank and then for six years as an analyst and corporate lender with Société Générale.
For the last 22 years he has expanded his financial expertise by creating his own financial services company, de Meadville International, which comprehensively follows his BEGOS complex of markets (Bond/Euro/Gold/Oil/S&P) and the trading of the futures therein. He is recognized within the financial community of demonstrating creative technical skills that surpass industry standards toward making highly informed market assessments and his work is featured in Merrill Lynch Wealth Management client presentations. He has adapted such skills into becoming the popular author each week of the prolific “The Gold Update” and is known in the financial website community as “mmb” and “deMeadville”.
Mr. Baillie holds a BS in Business from the University of Southern California and an MBA in Finance from Golden Gate University.


