Up 300% Since December 2015


That’s the AVERAGE gain for the 50 penny stocks in the Merv’s Penny Arcade Index (see below). If history is to repeat, then there is still another 300-500% gain ahead. One sign that speculators are comfortable with a bull market is their gravitation to the more risky stocks…the cats and dogs if you will. That may be what is happening here. The “penny” gold and silver stocks seem to be in vogue. Before we get into that, let’s do our weekly look at gold itself.
In my charts and discussions of gold price, I use the data for the futures contracts with the most active trading volume. For the past week gold advanced $33 or 2.66%. How does this compare with the performance of gold stocks? Well, the most popular gold Index is probably the PHLX Gold/Silver Sector Index which advanced only 1.49% on the week. The next most common is probably the NYSE Arca Gold BUGS Index (known as the XAU), which advanced 1.90%...albeit a good advance but still less than gold itself. These Indices are calculated by attaching greater weight to the big stocks in the Index, but far lesser weight to the smaller stocks in their Indices. The Merv’s Indices give EQUAL weight to each and every stock in the respective Index. The 100 largest stocks trading on the North American markets as represented in the Merv’s Gold & Silver 100 Index had an AVERAGE gain of 4.19% on the week, while the Merv’s Penny Arcade Index of 50 “penny” gold and silver stocks had a gain of 9.67%. Speculative or gambling sentiment is still very much in vogue. Speculators who have enough money to move stock prices are still willing to take the extra risk in the more speculative side of the market.
Long-Term
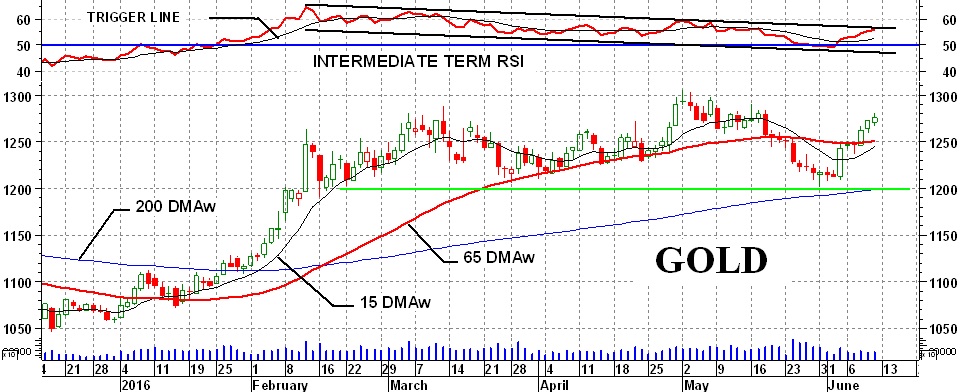
Change happens here very slowly and most of the time there is no change in the long-term position of gold. On the long-term gold remains above its positive sloping long-term moving average line. The long-term momentum indicator (long-term RSI) remains in its positive zone and above its trigger line, which turned back to the up side this week. So, the only rating possible on the long-term is BULLISH at the Friday close.
With the BULL/BEAR rating for the Merv’s 100 stocks at a very high positive level as indicated last week it was obvious that there was next to no room for improvement. Although the Index moved higher the rating very slightly decreased. There were 92% of the stocks with a positive rating (last week was 93%) and 4% of the stocks with negative ratings (last week was 3%). A very minor decrease in performance but it could be just the start of a reversal of fortunes, we’ll have to watch and wait.
Intermediate-Term
As we see on the chart all intermediate-term indicators are now back in sync, on the up side. The price closed above its moving average line and the line has once more turned upwards. The intermediate-term momentum indicator remains in its positive zone above its trigger line. The trigger line has also turned back to the up side. The intermediate-term rating is therefore BULLISH at the Friday close.
The BULL/BEAR ratings have changed very little during the week. The positive ratings of the 100 stocks remains at 67% while the negative ratings decreased to 16% from 18% last week.
Looking at the chart there is very little obvious chart patterns to focus on except the support at the $1200 level and the long gently downward sloping channel in the momentum indicator. This channel is interesting but I would not place too much emphasis on it from the standpoint of predicting anything.
There are two cautionary indicators that need watching. The short-term moving average line has not yet closed above the intermediate-term moving average line but this could change in a day or two. This past week, although a positive week, was not so as far as volume activity was concerned. There was no real rush to buy gold and the volume was quite weak. This is a concern and one should be prepared for a change in direction in the price.
Short-Term
All has once more turned fully positive in the indicators this week. The price closed above its short-term moving average line and the line is pointing upwards. The momentum indicator is in its positive zone above a positive sloping trigger line. The short-term rating can only be BULLISH at the Friday close. The BULL/BEAR ratings turned positive this past week. We had 56% with positive ratings and 14% with negative ratings. By the end of the week we had 73 stocks closing on the up side and 23 on the down side with 4 unchanged.
Merv’s Penny Arcade Index

Long-term readers to my previous Technical Talk with Wil-Arm and Technically Precious with Merv commentaries will remember my Merv’s Penny Arcade Index. It was developed at the start of 2007 with a value of 1000 and unfortunately almost immediately plunged some 85% in value. It then recovered very nicely for a run of about 2140%. Since then we have had many ups and downs. Since its December low the Index had gained 300% (over 600% from the 2013 low) and if we take the period of 2009-2010 as an example we still have many more 100% moves to go.
To qualify for inclusion into this Index, a stock must have at least a full year of relatively active trading. In addition, I look for stocks primarily in the $0.05 to $0.25 range at the time of inclusion. Stocks whose price advances beyond the $2.00 level (mostly between $1 and $2) are replaced with another penny stock to keep this a “penny” Index.
Up to a few years ago I would let the stocks climb or fall as they will. Over the past few years I have tried to weed out the losers as quick as I can before they plunge to zero. That is probably why you see the Index moving in a lateral fashion these past few years rather than further plunging as most Indices have done. For comparison, see the Merv’s Gold & Silver 100 Index (to follow).
Although I am relatively new to Facebook and still not too sure of myself on that media, I will try over the next few days to post a copy of my Merv’s Penny Arcade Index Table (no promises, however). There you will find all the stocks in this Index, at this time, as well as their performances ratings.
Merv’s Gold & Silver 100 Index
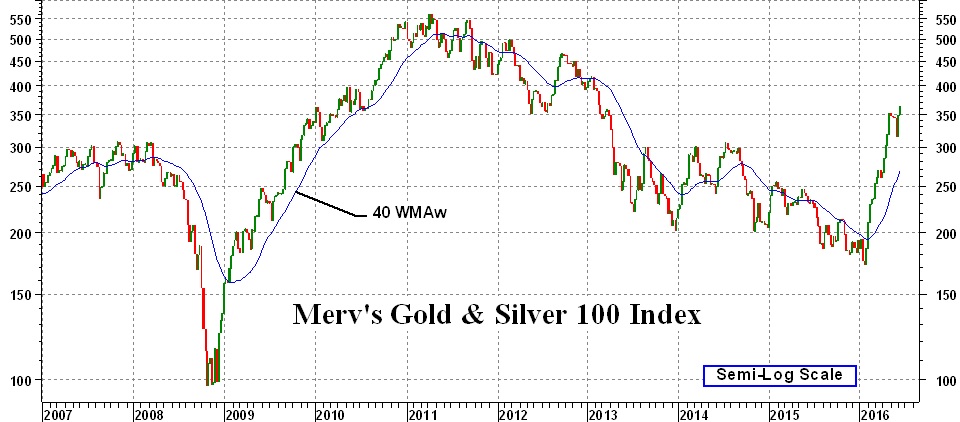
The Merv’s Gold & Silver 100 Index was developed way back in 1993 with a starting value of 9.101. It gained 240% over the next few years and then dropped 64% until reaching the value of 10.0 in late 1998. The 100 stocks started their great bull market from that point while it took the main Indices (like the PHLX Gold/Silver Sector Index…aka XAU) another two years before they started their bull move. The Merv’s 100 bull move ended in late 2007/early 2008 after a 2900% move. Then followed a plunge of about 68% before the next bull move of around 460%. Another bear of about 68% ended in early Jan 2016. It is now 111% above that Jan low.
There are short periods when the big “quality” gold stocks might out-perform the smaller stocks but what the Merv’s 100 Index shows, if compared to the XAU Index or other main Indices, the smaller stocks are indeed producing the better action.
I showed the Merv’s 100 Index starting in 2007 for direct comparison with the Penny Arcade Index.
Readers are invited to view my Facebook page at https://facebook.com/merv.burak where I will be slowly posting commentaries explaining in more detail my various indicators and techniques. I also present from time to time some individual stocks that look as if they may be good speculations. However, nothing I post is meant to be a recommendation to buy or sell. One should check with their broker or investment advisor before acting.
 Merv is a retired Aerospace Engineering consultant. He is also a retired market technician with over 40 years of market experience and research. Merv received his certification as a Chartered Market Technician (CMT) in 1992. Developer of many technical techniques and programs which he has been using in his previous Technically Speaking with Wil-Arm and Technically Precious with Merv commentaries posted throughout the globe. Developer of several gold and silver Indices, Merv continues to update his Merv’s Gold & Silver 100 Index and Merv’s Penny Arcade 50 Index and reviews them during his periodic on-going Technically Precious commentaries.


