The ABCs Of Gold Prices


 GOLD PRICES - A HISTORY
The chart below is a history of gold prices since 1980...
History Of Gold Prices 1980-2023
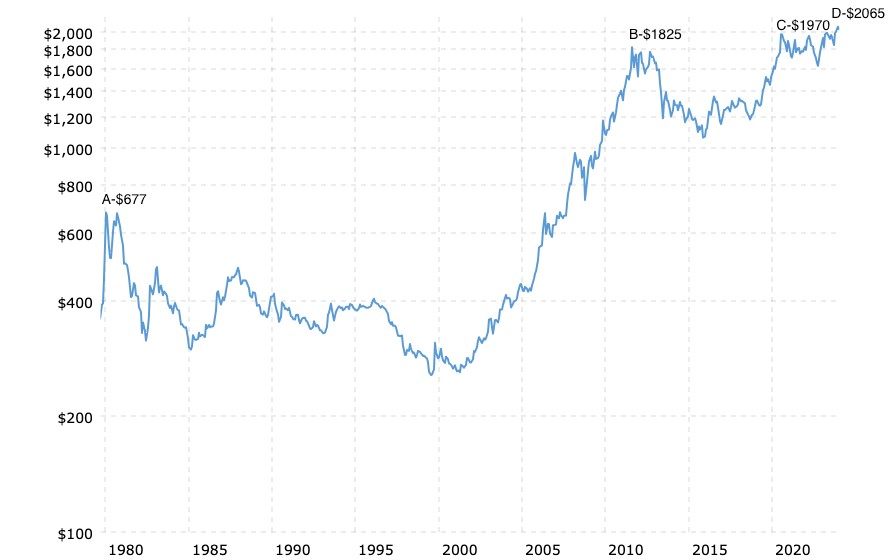
There are four peaks/points noted on the chart above which are designated by the letters A, B, C, and D. The letters correspond in sequence to the dates: January 1980 (A); August 2011 (B); August 2020 (C); and December 2023 (D).
The prices are average closing prices for the respective months. In other words, in January 1980 (A), the average closing price for gold was $677 oz. Yes, the gold price did peak on an intraday basis that same month at $843 oz.. but using monthly average closing prices is more representative of the ongoing price action and smooths out some of the more extreme short-lived activity. The other dates and corresponding prices are as follows: August 2011 (B) - $1825; August 2020 (C) - $1970; and December 2023 (D) - $2065.
The price of gold tripled between January 1980 (A) and August 2011 (B), but it took almost thirty-two years. The next peak in succession came in August 2020 (C), a decade later, but the gains were marginal ($1825 - $1970). Finally, the most recent peak ($2065) came last month after three years. Again, the gains were quite small.
GOLD PRICES (INFLATION-ADJUSTED)
Now, let's look at a second chart. This one is also a history of gold prices from 1980-2023. In fact, it is the same history. The prices shown on the chart below are the same as those shown on the first chart above except that they have been adjusted for inflation...
History Of Gold Prices (inflation-adjusted) 1980-2023
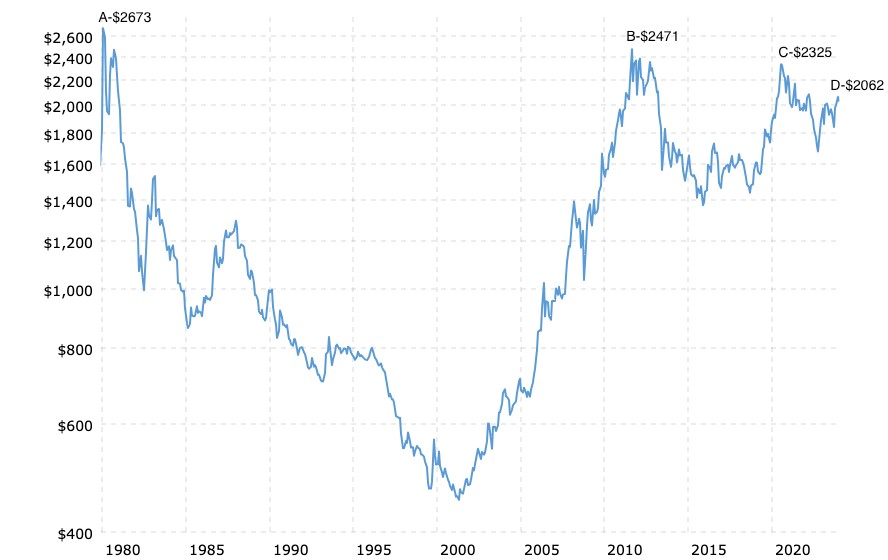
The peaks on the second chart immediately above correspond exactly to the peaks on the first chart. The different prices are due to adjustments for the effects of inflation, i.e., inflation-adjusted prices.
Therefore, the 1980 price peak of $677 (A) is now $2673 (A) as shown on the second chart; the 2011 price peak of $1825 (B) is now $2471, and so on.
As the dollar continues to lose purchasing power over time, the price of gold continues to rise reflecting that loss of USD purchasing power. This is seen in the first chart above. Now, however, by viewing gold's price action with adjustments for the effects of inflation in the second chart, we can see the gold price action with additional clarifying perspective.
What is important to focus on is that the gold price comes back each time to near its previous inflation-adjusted peak. At each of those successive peaks, the gold price at that time reflects the actual loss of U.S. dollar purchasing power that has occurred since the previous peak.
For example, when gold peaked in 1980 (A) at $677 oz., it reflected the effects of inflation that had occurred over the previous several decades. The increase in gold’s price from $677 (A) to $1825 (B) accounted for the additional inflation effects after 1980 and up to 2011 (B).
(Owning gold preserves wealth over long periods of time.)
THE ABCs OF GOLD PRICES
- The price of gold continues to rise over time to reflect the actual loss of U.S. dollar purchasing power. This creates the perception that gold is gaining in value as its price rises when what is really happening is that the U.S. dollar is losing purchasing power and more dollars are needed to buy the same ounce of gold as before.
- Gold's price is subject to significant declines after periods of peak action. This happened after 1980, 2011, and 2020. It also happened after geopolitical shocks such as the invasion of Ukraine in 2022 and Israel 2023.
C. Gold is real money and a long-term store of value. As the dollar loses value (purchasing power), gold gains in PRICE. Gold's recent peak price at $2060 oz. is one-hundred times higher than its original fixed price of $20.67 oz. and reflects a ninety-nine percent decline in U.S. dollar purchasing over the past century.
Kelsey Williams is the author of two books: INFLATION, WHAT IT IS, WHAT IT ISN'T, AND WHO'S RESPONSIBLE FOR IT and ALL HAIL THE FED!
*********
More from Gold-Eagle


