Antics On Wall Street


Last week we looked at monthly exponential charts of gold and silver and found that these charts also show remarkable patterns. Given all the excitement that Wall Street experienced late last week, it seemed a good idea to do a similar analysis. As it happens, there is long history available, but only monthly averages. Starting with the SP500, interesting results were found. The other action of note last week is that gold has started a move in both dollar in euro terms. Finally, after trying for some time to break higher from its steep bear channel, the dollar index has turned bearish again.
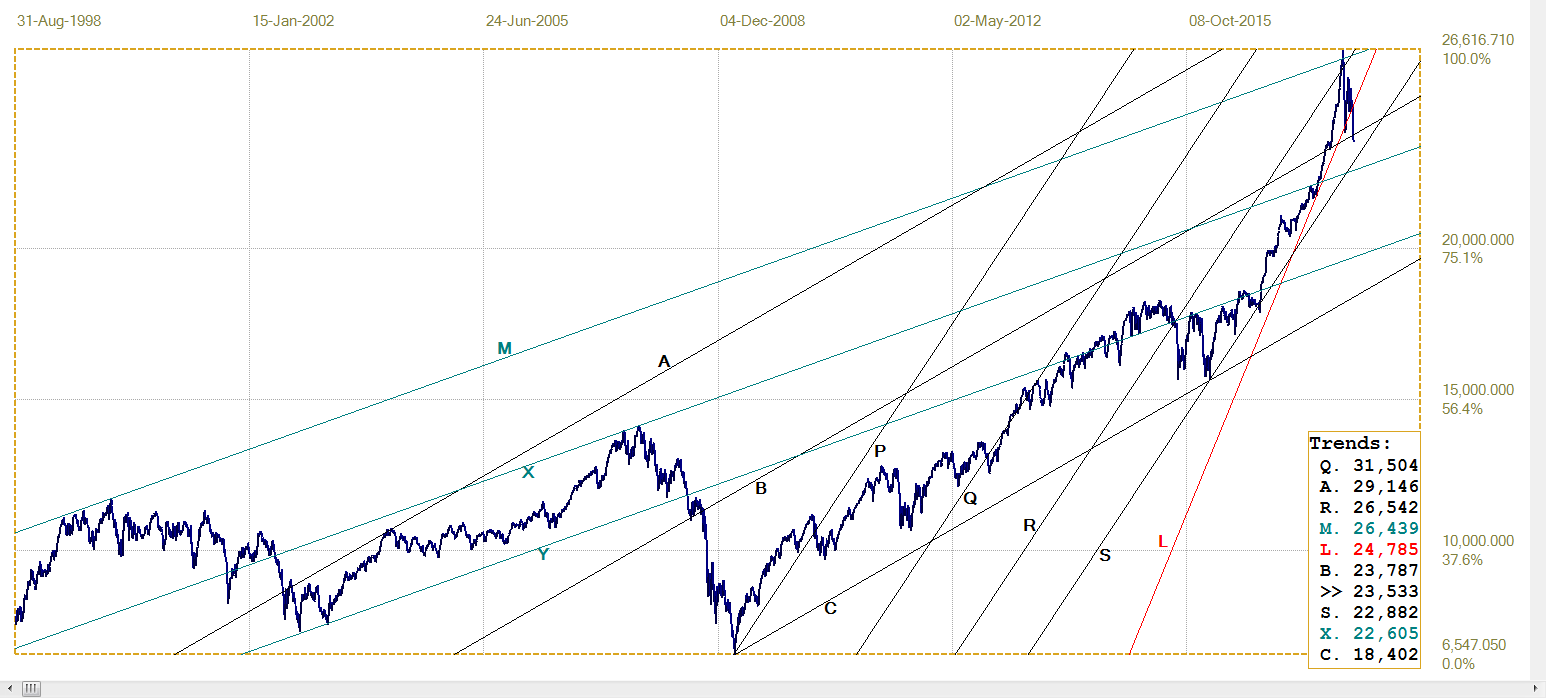
The chart below shows the log chart of the monthly averages of the SP500 since 1933 fits well within an evenly split channel. The new break into the upper channel reached a high for the month of January 2018 and has since turned lower. Lines F and G meet in January – as shown in the Table of the line values at the time of the All Time High – marginally above the value of the chart. Of course, trend lines show possibilities only, they are not impenetrable barriers. The chart only indicates the high in January at important long term resistance; time will tell whether it will hold.
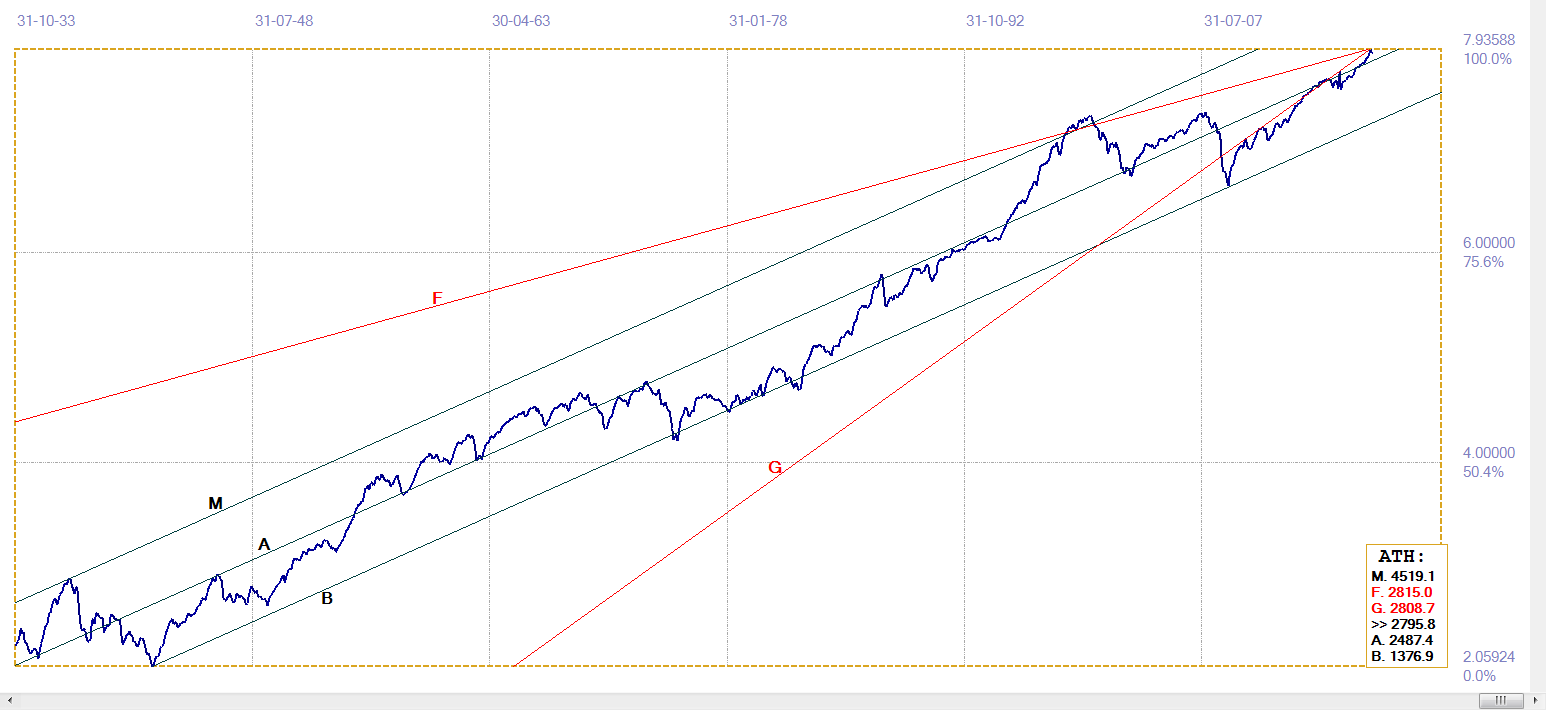
SP500 Monthly average exponential chart
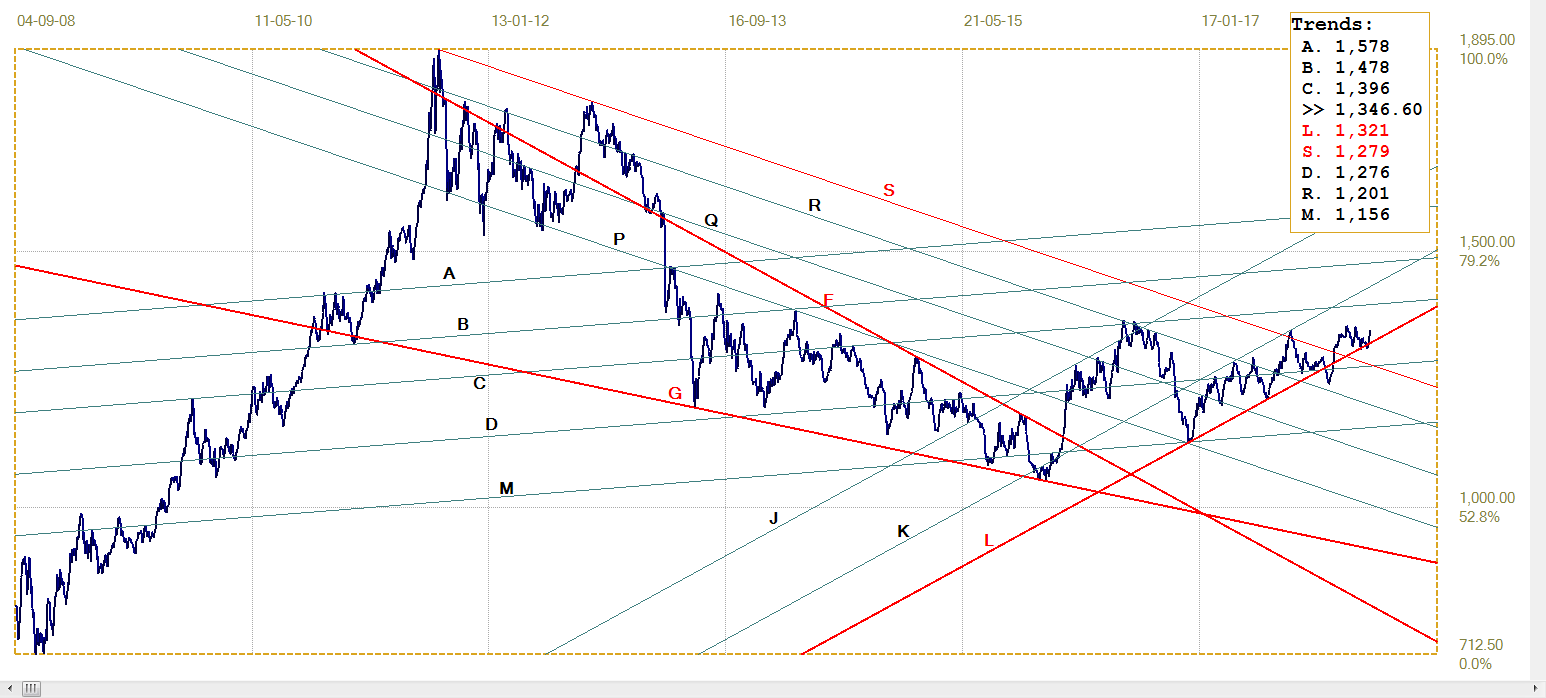
The US dollar has been in bearish mode since the end of 2016 and the dollar index has held quite well to the steep bear channel VW in the chart below. For a number of weeks the recent rally off the support at line B, holding above line L, has sat very close to the resistance of line W, slipping lower just enough in time to hold below its resistance. Last week the dollar finally gave up and broke below line L to give a bearish signal that still has to be confirmed at the support of line B.
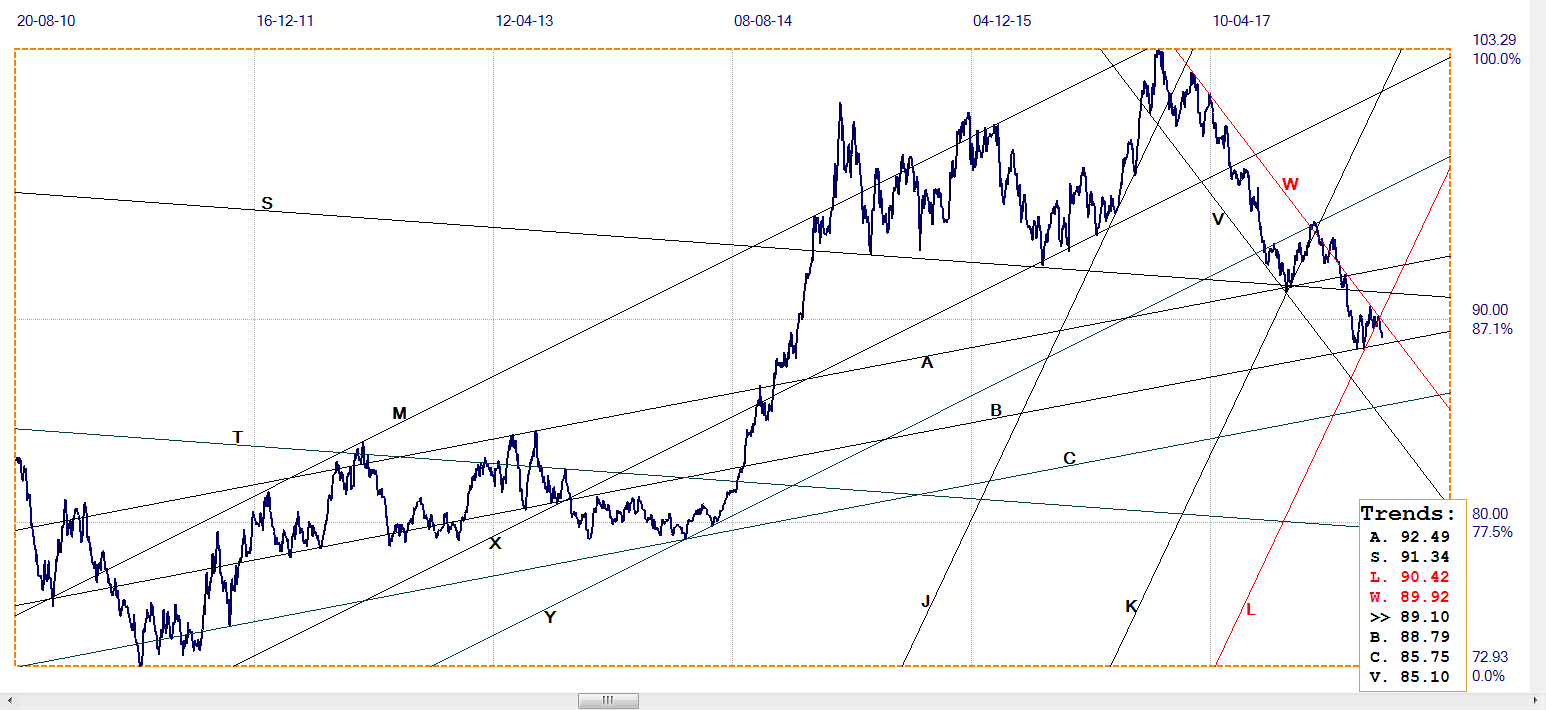
Dollar Index last = 89.10
Thursday saw a 700+ point fall for the DJIA. Ever since the Panic of 1987 there has been an awareness that weakness on a Thursday followed by even more weakness on the Friday sets the stage for a Monday sell-off of magnificent proportions. Apart from that bull markets hate two-day selloff, everyone who supports Wall Street come what may must have been aware of the risk that a Friday sell-off holds for Monday.
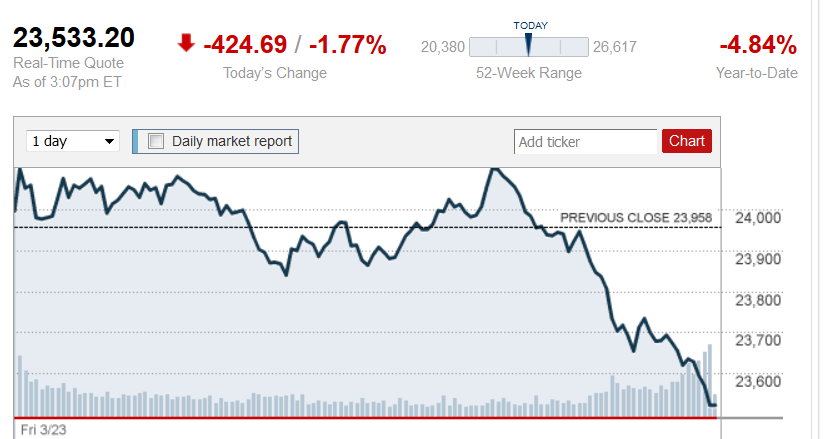
Generally, highest trading volume of the day is at the open and again to much lesser extent at the close, when traders settle their books for the day. On Friday, the DJIA briefly tested its early high for the day then turned very bearish.
Soon trading volume shot higher to challenge and exceed the turnover at the open. Panic stations!
DJIA intra-day chart Friday 23 March
This frenetic buying may have prevented a similar sell-off to Thursday, but the DJIA closed at its low for the day, losing ‘only’ 425 points. There has to be uneasiness in many minds over the weekend, to put it mildly. Friday’s close is already more than 3000 (11.5%) down from the high late in January and the trend following EFT’s and fund managers who are heavily invested in the FAANGs must be most concerned.
While most of the stock market since the all-time high spent much time in a volatile sideways band well below the high, the FAANGs had set a new high late in February as buyers chased the momentum stocks. The question is what they will do should the sell-off continue on Monday – or even trigger a sell-off. The early sellers out of the door might avoid the stampede when investors try to close a FAANG position in a market where prospective buyers have become observers and not participants.
Gold in dollar and euro has spent some weeks now barely clinging to key support that seemed ready to give way with gold closing in on $1300 and the dollar having its rally across the bear channel discussed earlier. Last week saw a positive change for the metal as the price rallied away from the $1300 level to almost hold $1350. A firmer gold price while the dollar broke below support on the dollar index chart, also had the euro price of gold finally bouncing away from the support. Silver snuck a little higher in the wake of the improving gold price, but still has much ground to make up this week to reach $16.90 or better to hold long term support discussed as discussed last week. Little else of real interest.
Euro-Dollar
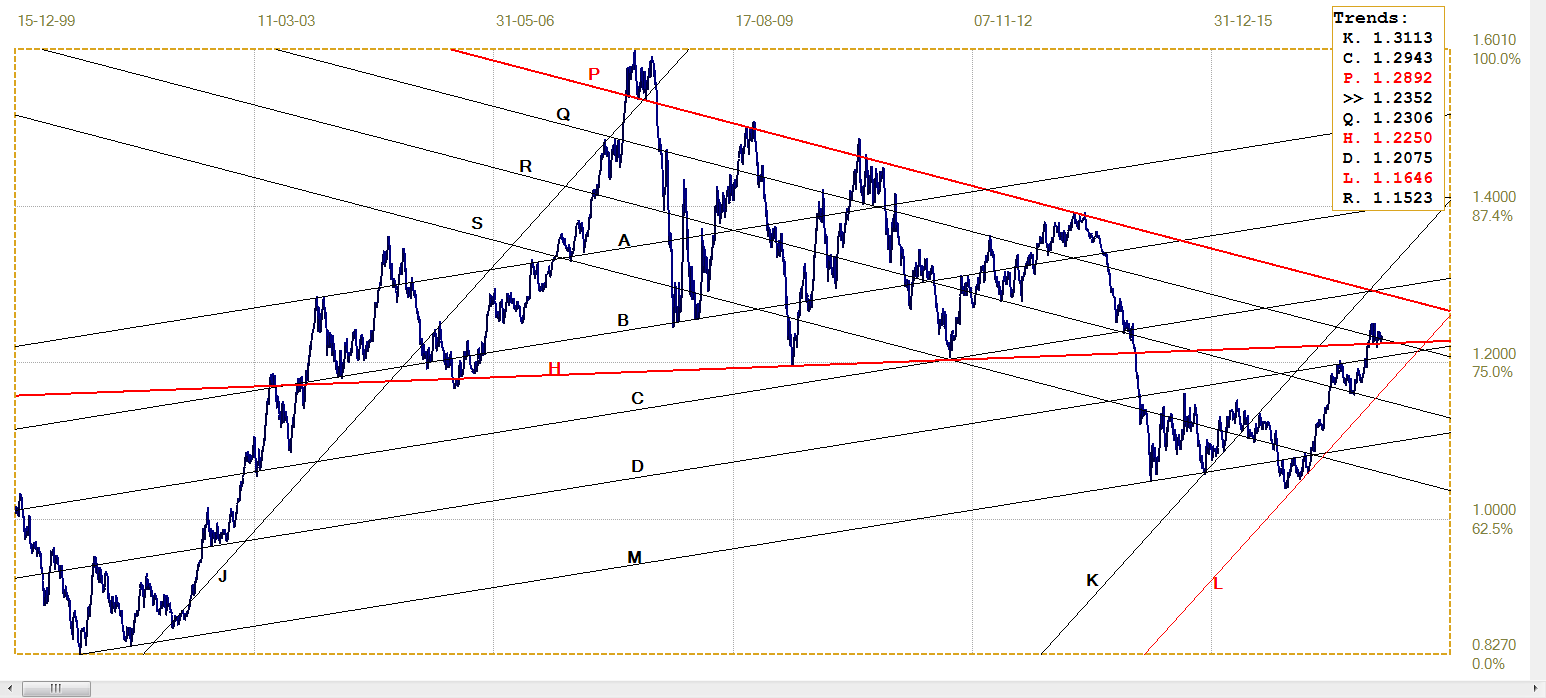
Euro-dollar, last = $1.2352 (www.investing.com)
The weaker dollar index has more to do with the stronger yen with than a firm euro that remains tightly range bound just above the support of line H ($1.2250), while holding around line Q ($1.2306). The euro continues to have a bullish outlook as long as support at line H holds, which given the recent dollar weakness is expected.
DJIA
Thursday and Friday saw the DJIA lose more than a 1000 points to break below the recent volatile consolidation range and exceed the low reached on the initial major sell-off. The DJIA now has a definite break below line L (24 785) to depart from its post 2016 bull channel and then also break below the support of line B (23 787). A recovery back above line B on Monday little more than 150 points, but it could be a real challenge for those people keen to support Wall Street whenever it comes even under slight selling pressure and result in multiple V-lows on the intra-day charts.
DJIA, last = 23533.20 (money.cnn.com)
Gold PM fix - Dollars
Friday’s PM fix sets the month end price for the monthly chart shown last week and it has to be clear of $1320 to avoid a break lower. The improvement in the price of gold last week should hold through the week, although futures expirations through the week is expected – if history holds true – to result in more price suppression. It would be a pleasant change if gold continues its rising trend despite more selling.
Gold price – London PM fix, last = $1346,60 (www.kitco.com )
Euro-gold PM fix
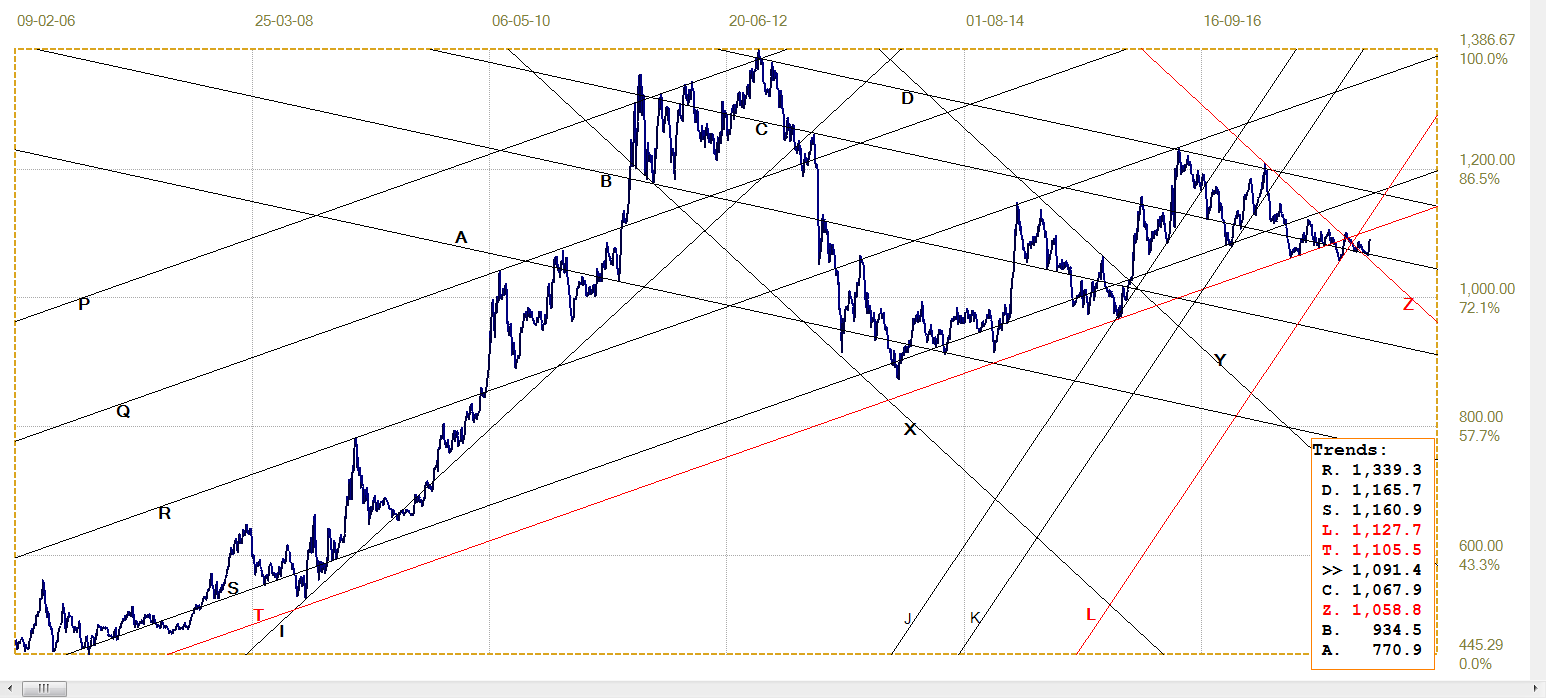
Euro gold price – PM fix in Euro, last = €1091.4 (www.kitco.com)
As mentioned earlier, recent experience where the dollar price of gold was under pressure and the euro was going nowhere to keep the euro price of gold sideways at best, now seems to be over. The euro improved a little, but not enough to break out of its tight trading range and so the improved dollar price of gold could have full effect on the euro price.
After breaking above bear channel YZ (€1059) the euro price could barely hold to its support at line C (€1068), until last week. The price is still holding below its bull channel and it has to improve to above €1106 for a break above line T and resume a rising trend.
Silver Daily London Fix

Silver daily London fix, last = $16.53 (www.kitco.com)
Despite the near continuous buying that is sending the open interest on Comex into range of its all time highs – thereby keeping the continuous selling from holding the price near $16 – the price of solver is lagging the improvement in the price of gold. It is a really long time since the roles were last reversed, when silver was leading the way higher.
After the break below bull channel KL ($17.81) the silver price has kept to a very tight range, possibly because of the bull-bear battle going, perhaps also with the sellers content with containment of the price. It could be that they realise a much lower price could trigger even more determined buying in the hope that reserves of silver could run out in the near future to release the price to turn more bullish.
U.S. 10-year Treasury Note
Following the last leg of the bear trend that broke above line R (2.822%) and then failed to extend higher, this is the third rally that barely made to back to line R only to reverse higher again after the first two occasions. This third attempt made it a little lower than the previous two occasions, even breaking marginally below line C (2.816%) and ending there on Friday.
The interest rate hike on Wednesday had little lasting effect on the bond market as if the expectation had been fully priced in much earlier. With US bonds having been sold off to new high yields, any further weakness on Wall Street may well result in the usual switch out of equities into bonds – at least until bonds resume their bear trend as rates seem set to be hiked multiple more times during 2018.
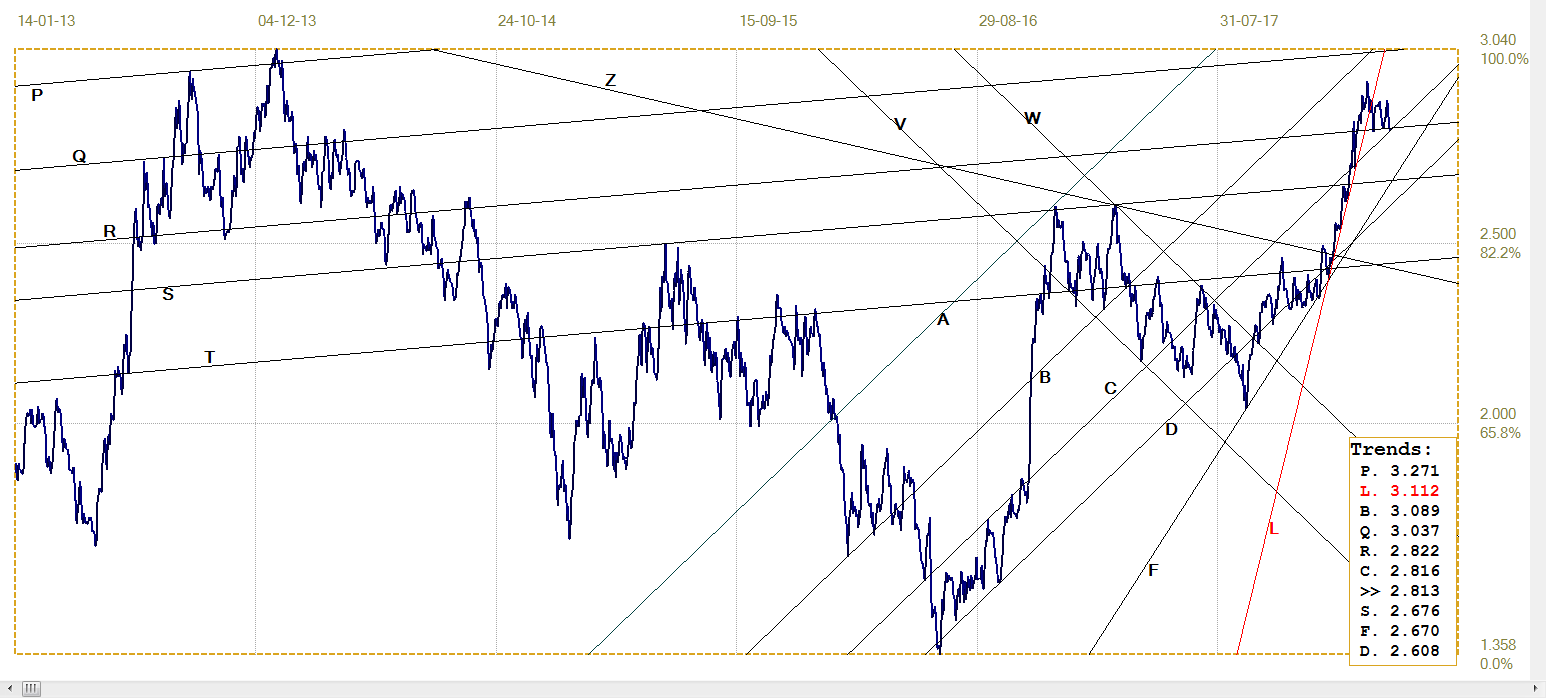
U.S. 10-year Treasury note, last = 2.813% (www.investing.com )
West Texas Intermediate crude. Daily close
The price of crude so far has avoided the volatility of the stock market. If the sell off on Wall Street is to continue and settle in a bear market, fears for the economy – and the effect of pension and other funds over-exposed to equities – may well see the price falling again as demand for crude fall below supply.
For the time being and until at least the situation on Wall Street – and perhaps also the trade for oil in yuan expected to commence on Monday – is clarified, there is no clear direction to anticipate. Line L ($59.85) remains the signpost that will warn if and when the bear has returned to the market for crude.
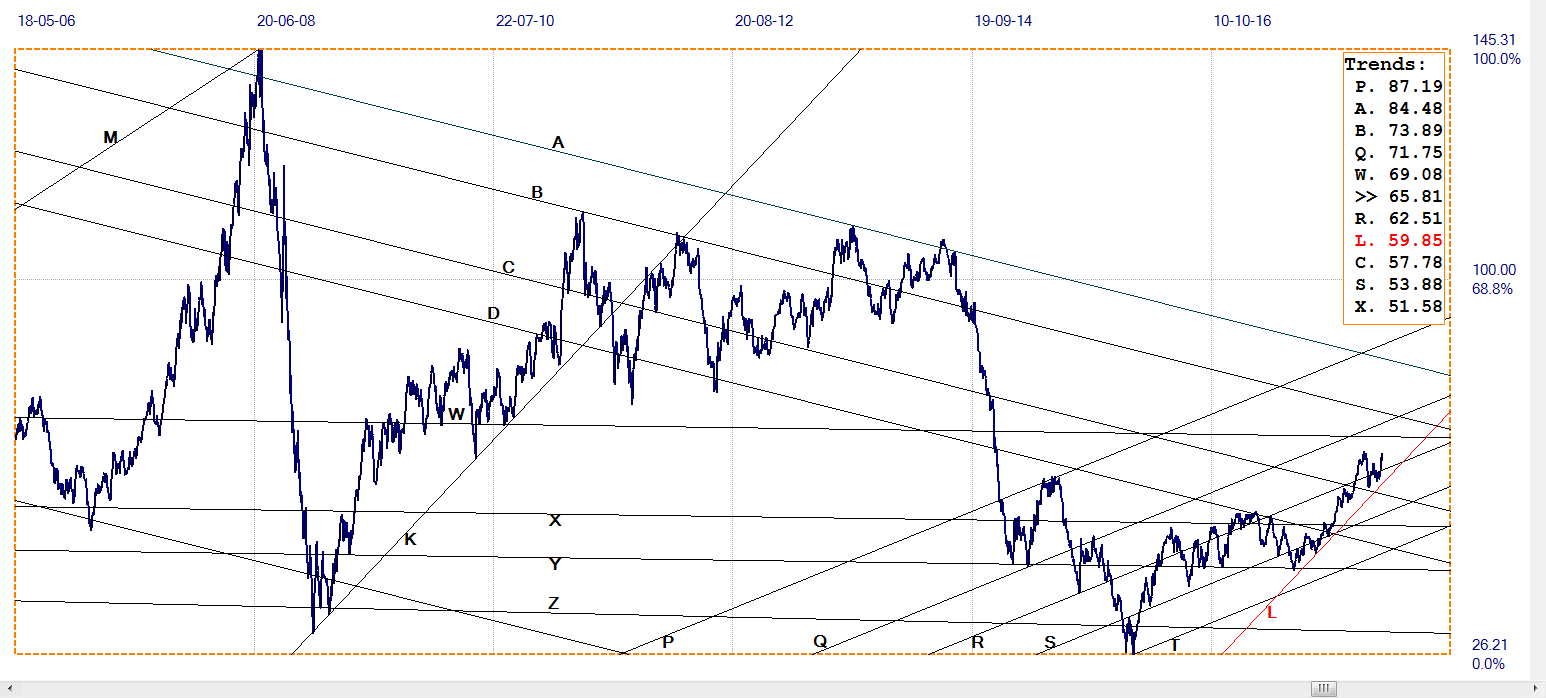
WTI crude – Daily close, last = $65.81 (www.investing.com )
¬2018 daan joubert, Rights Reserved chartsym (at) gmail(dot)com
********


