Big Things Happening In The Markets
 share
share
 share
share
 share
share
 share
share
 share
share
This was a big week in the market; lots of big events happening in the world with the potential to impact the markets.
Below is the best investment advice I can give my readers this week. Having a good relationship with God in times like this is a real comfort.
Let’s now go to the Dow Jones BEV chart below. I’m going to stop being short-term bullish, as there is just too much bad stuff happening in the world from Canada to Ukraine. What’s next? It’s getting harder and harder believing it will be a new all-time high for the Dow Jones. So, from the Dow Jones’ last BEV Zero below, from January 4th, the Dow Jones apparently has begun to slide down into a new bear market. Though so far, only 7.39% of its coming decline.
And it’s not just the Dow Jones. In my table of major market indexes BEV values below, it’s been free of BEV Zeros for weeks now, and this week closed with only one index in scoring position, and just barely at that (#1 NASDAQ Insurance).
One trend on the rise in the table below are major indexes deflating by double-digit BEV values from their last all-time highs. We may see some of these indexes bounce back to above their BEV -10% levels. But I fear it would only be a pause in their current declines, far from where they are ultimately fated to decline.
I’m out of the market prediction business. Still, we must realize the corporations that fill the ranks of these indexes are in the main carrying more debt than was prudent for them to assume. And since March 2009, they’ve taken on this debt to artificially “stimulate” the economy, and fund their share buyback and dividend programs. Their balance sheets have been thoroughly trashed. In other words, as a group they’ve wasted trillions of dollars they can never payback, and at some point, this fact will be priced into their share prices.
I don’t know exactly what is wrong with Moderna, but this provider of mRNA gene therapy, they sell to dupes as a vaccine for covid is down by 70% since last August. Obviously Moderna’s CEO thinks more deflation is coming and he’s GOTTEN OUT.
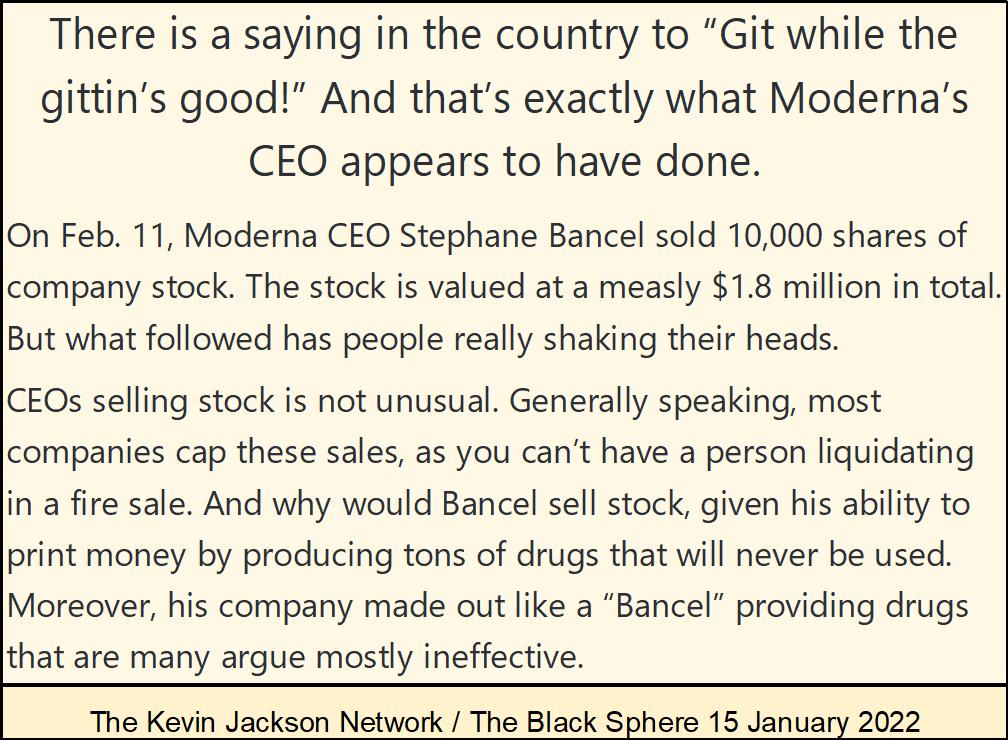
https://theblacksphere.net/2022/02/moderna-ceo-sells-stock/
Expect to see more of the above as 2022 moves towards 2023; company insiders Getting out, while the Getting is good.
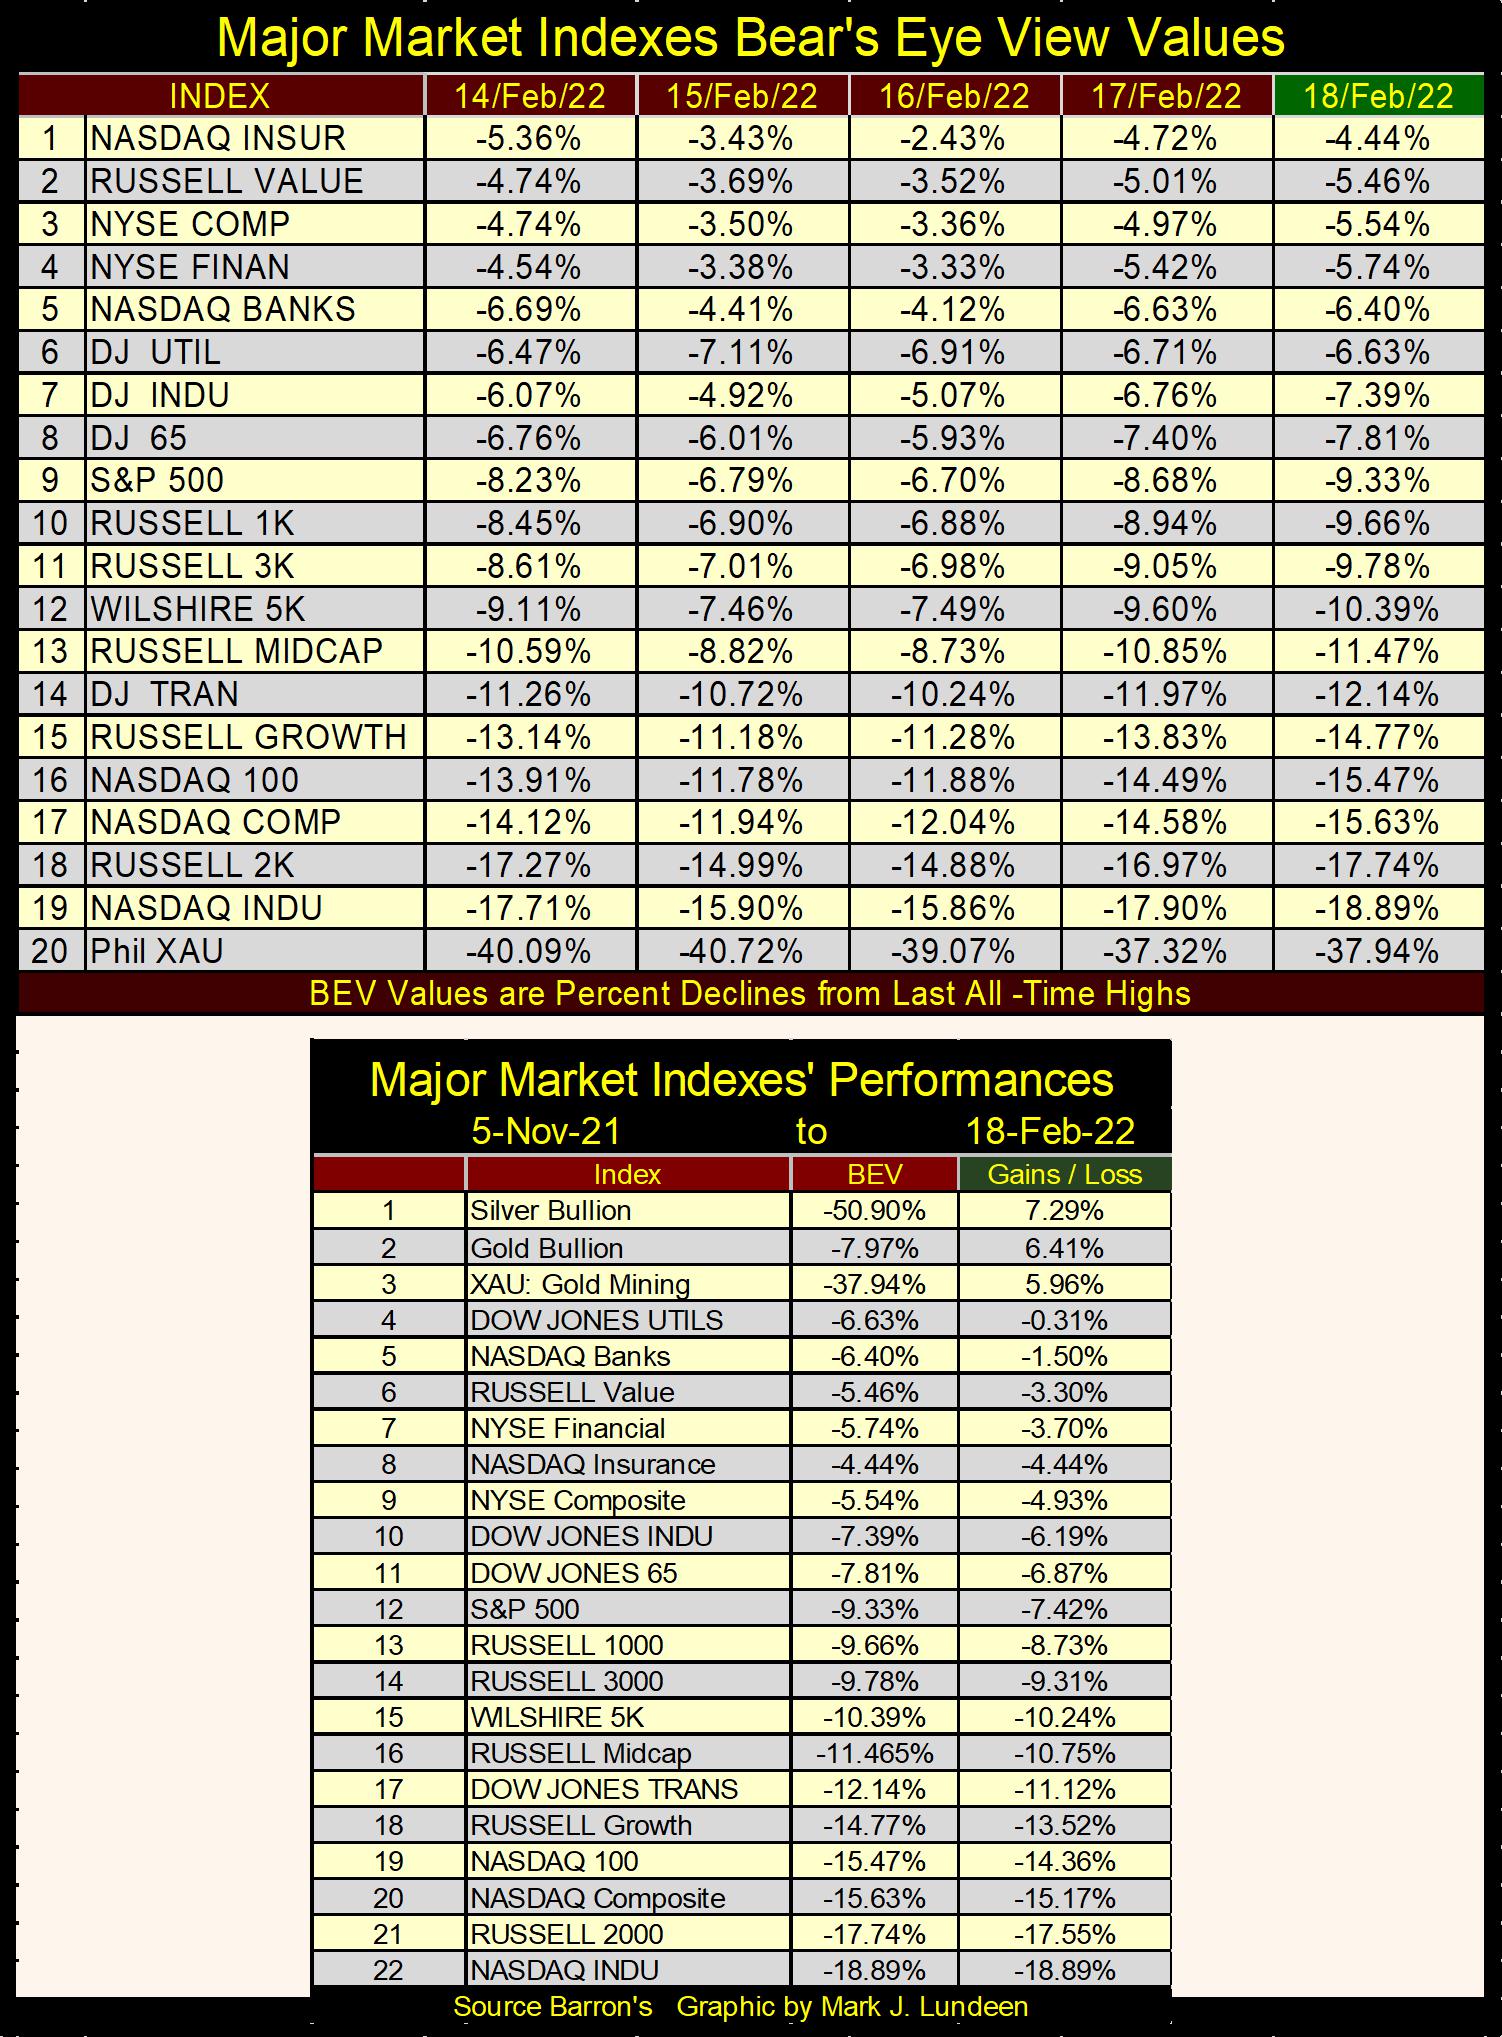
Looking at these indexes’ performance since November 5th, (table above) a week when 17 of these 22 indexes were making new all-time highs. Now today, except for precious metal assets (#1-3), no one has been making money in the broad stock market for the past three and a half months. Sad but true.
We can expect some good days, weeks and months to come. But I really believe what we are seeing above is the new primary market trend; one of price deflation.
Below is the Dow Jones in daily bars. The Dow Jones is having a tough time with its 35,250 level. I don’t know what will come in the weeks that follow, but should the Dow Jones close below its 33,250 level, that would be bad. Of course, the Dow Jones could always close above its 35,250 line, and then move towards a new all-time high. What one expects for the stock market in the weeks and months to come depends on whether they are a glass half empty or glass half full type of people.
I don’t enjoy being a big bear. It’s much more fun being a raging bull. But right now, I’m a glass half empty guy when it comes to the stock market. Thank God there is gold and silver, and the precious metal mining stocks. This is exactly the type of market where they will do their thing. For what’s it’s worth, if you’re looking for some bullish entertainment in the financial markets for 2022; get some exposure to the precious metals and their miners.

Here is a chart I haven’t posted for a while, on the NYSE A-D ratio going back to 1926. I take daily NYSE Advance & Decline data, but convert it into a ratio.
Advance – Decline / Total Shares Traded that Day.
I do this to normalize the daily data over the decades, as in 1926 there were only about 600 companies trading daily at the NYSE, while today there are about 3,500. Using a ratio gives each day’s Advance – Decline data equal weight, be it in the 1920s or 2022 in the plot below.
There is a lot of history plotted below. The Roaring 1920s Bull Market, and the Great Depression Crash. The 1942 to 1966 bull market. From 1966 to 1981, as bond yields increased to over 10%, and bond prices declined in massive bear market, the Dow Jones attempted to break above 1000, and failed to stay above 1000 five times as this ratio declined.
There is the 1982 to 2000 bull market, where the Dow Jones advanced 1408% in eighteen years. It’s amazing how little the NYSE A-D Ratio advanced during this massive bull market.
But what’s really interesting about this chart is what has happened since the bottom of the 2000 to 2002 high-tech bear market. The ratio increased from -25 to over 150 in the past 20 years, an advance interrupted only by the sub-prime mortgage bear market. Yet for all those daily advances at the NYSE, the Dow Jones is up by only 405% from its lows of October 2002.
What in the heck is going on here? Well, understand I’m only a market enthusiast. My professional training was on shipboard electrical systems on US Naval Ships. And in my professional life, every now and then I’d connect an item of test equipment to a system that was not doing what everyone expected it to do, and I’d have what can best be called a Whiskey-Tango-Foxtrot (WTF) moment.
That uninterrupted advance in the NYSE A-D Ratio, from 2002 to 2022 seen above reminds me of one of those WTF moments, where I’d realize that something really odd was going on.
And what could that possibly be? That since October 2002, this bull market on Wall Street has been completely contrived. A bullshit-bull market, funded by monetary inflation flowing from the Federal Reserve to keep the voter’s retirement accounts inflated, and keep Washington’s entrenched political and bureaucratic classes entrenched.
This is not good, as this bull market is only going to last for as long as the idiot savants at the FOMC allow it to go on. They can pull the plug at any time it’s convenient for them to do so. If they can place the responsibility of the crash on Putin, sometime before November 2022 may be good for them.
Here’s a chart I used last week on the Dow Jones dividend yield. But, as it goes a long way supporting the chart above on the NYSE A-D Ratio, I’m publishing it again this week. Since Alan Greenspan became Fed Chairman in August 1987, the Federal Reserve has refused to allow the Dow Jones to complete a bear market by seeing it yield something over 6%. That is just a historic fact published weekly in Barron’s.
But this is something I missed last week; this insight only came after I published this chart last week. The FOMC so far has seen only two episodes of Quantitative Easings. The first by Doctor Bernanke with his QE 1-3 when the Dow Jones dividend yield increased above 4% in early 2009. And the second, the Not QE#4 by Fed Chairman Powell when in March 2020, the Dow Jones dividend almost broke above 4%.
So, its official “policy”; while the “policy makers” are manhandling market valuations ever higher, the Dow Jones is not allowed to yield over 3%. And when it does, the FOMC will flood the market with as many billions or trillions of dollars as needed to bring the Dow Jones dividend back below 3%.
Look at these charts above and below. Are you also having a Whiskey – Tango – Foxtrot moment?
This is what a fake bull market looks like. Which may be okay for most people, for as long as it continues going up. But the day is coming when the idiots are going to allow market valuations to deflate. Soon thereafter, I expect seeing the Dow Jones dividend to yield something above 6% for the first time since the early 1980s.
With the current dividend payout of $698, a 6% yield for the Dow Jones would see the Dow Jones deflate to 11,643. That would be a market decline of 70% from its last all-time high, but I don’t believe Mr Bear will be happy with only that.
Another thing bothering me about the stock market is how well gold and silver are now trading. On February 1st gold closed at $1798. Thirteen trading days later (February 17th) gold closed at $1897. There is real movement into gold (and silver), and I expect this is because the smart money can see what is coming their way, and so are moving into assets with zero counterparty risks.
Here is gold’s BEV chart. Just taking in the past two years or so seen below, gold is looking pretty comfortable with its BEV value single digit / less than 10%. That’s fine with me.
Next stop? Gold’s BEV -5% line. As per the table in the chart, that would be gold closing over $1,958. That’s only about $60 from today’s closing price. Will the COMEX goons allow such a thing to happen? You and me will both discover if they will or won’t in the next few weeks.
Here’s gold and its step sum below. For the past eleven years gold has been forming a bowl in the chart below, or “tea cup” as per Jim Sinclair. And for the past two years forming a beautiful handle for the tea cup. If something stunningly bullish was to happen in the next year or so, it seems appropriate that it would spring from a beautiful technical formation as seen below.
As for gold, I’m feeling pretty good about what 2022 has planned for the old monetary metals. Possibly some violent action to the upside for gold and silver as the financial markets meltdown, possibility later this year.
That’s not a prediction on my part, just a little daydreaming from a long-suffering gold bull. But something like that is going to happen, as it has to after the many decades of market manipulation via monetary inflation from the FOMC.

Alfred below remains confident that the only way for the Dow Jones to go is to the upside. But not me. Look at what is happening in the red circle. The Dow Jones step sum (Red Plot) is turning down, telling us market sentiment for the stock market is turning sour. Then the Dow Jones itself (Blue Plot) has a nasty head and shoulders formation.
Just looking at the chart below, a Dow Jones close below 34,000 would be very bearish. Where did the Dow Jones close this week? On Friday’s close the Dow Jones closed with 34,079, only seventy-nine points above 34,000.
I realize that at any moment, a couple of idiots from the FOMC could “inject” sufficient “liquidity” into the stock market to “stabilize market valuations.” Then again, maybe this time they won’t do that. They don’t have to. I think the chart below for the Dow Jones may be the most interesting chart to follow in the weeks to come.
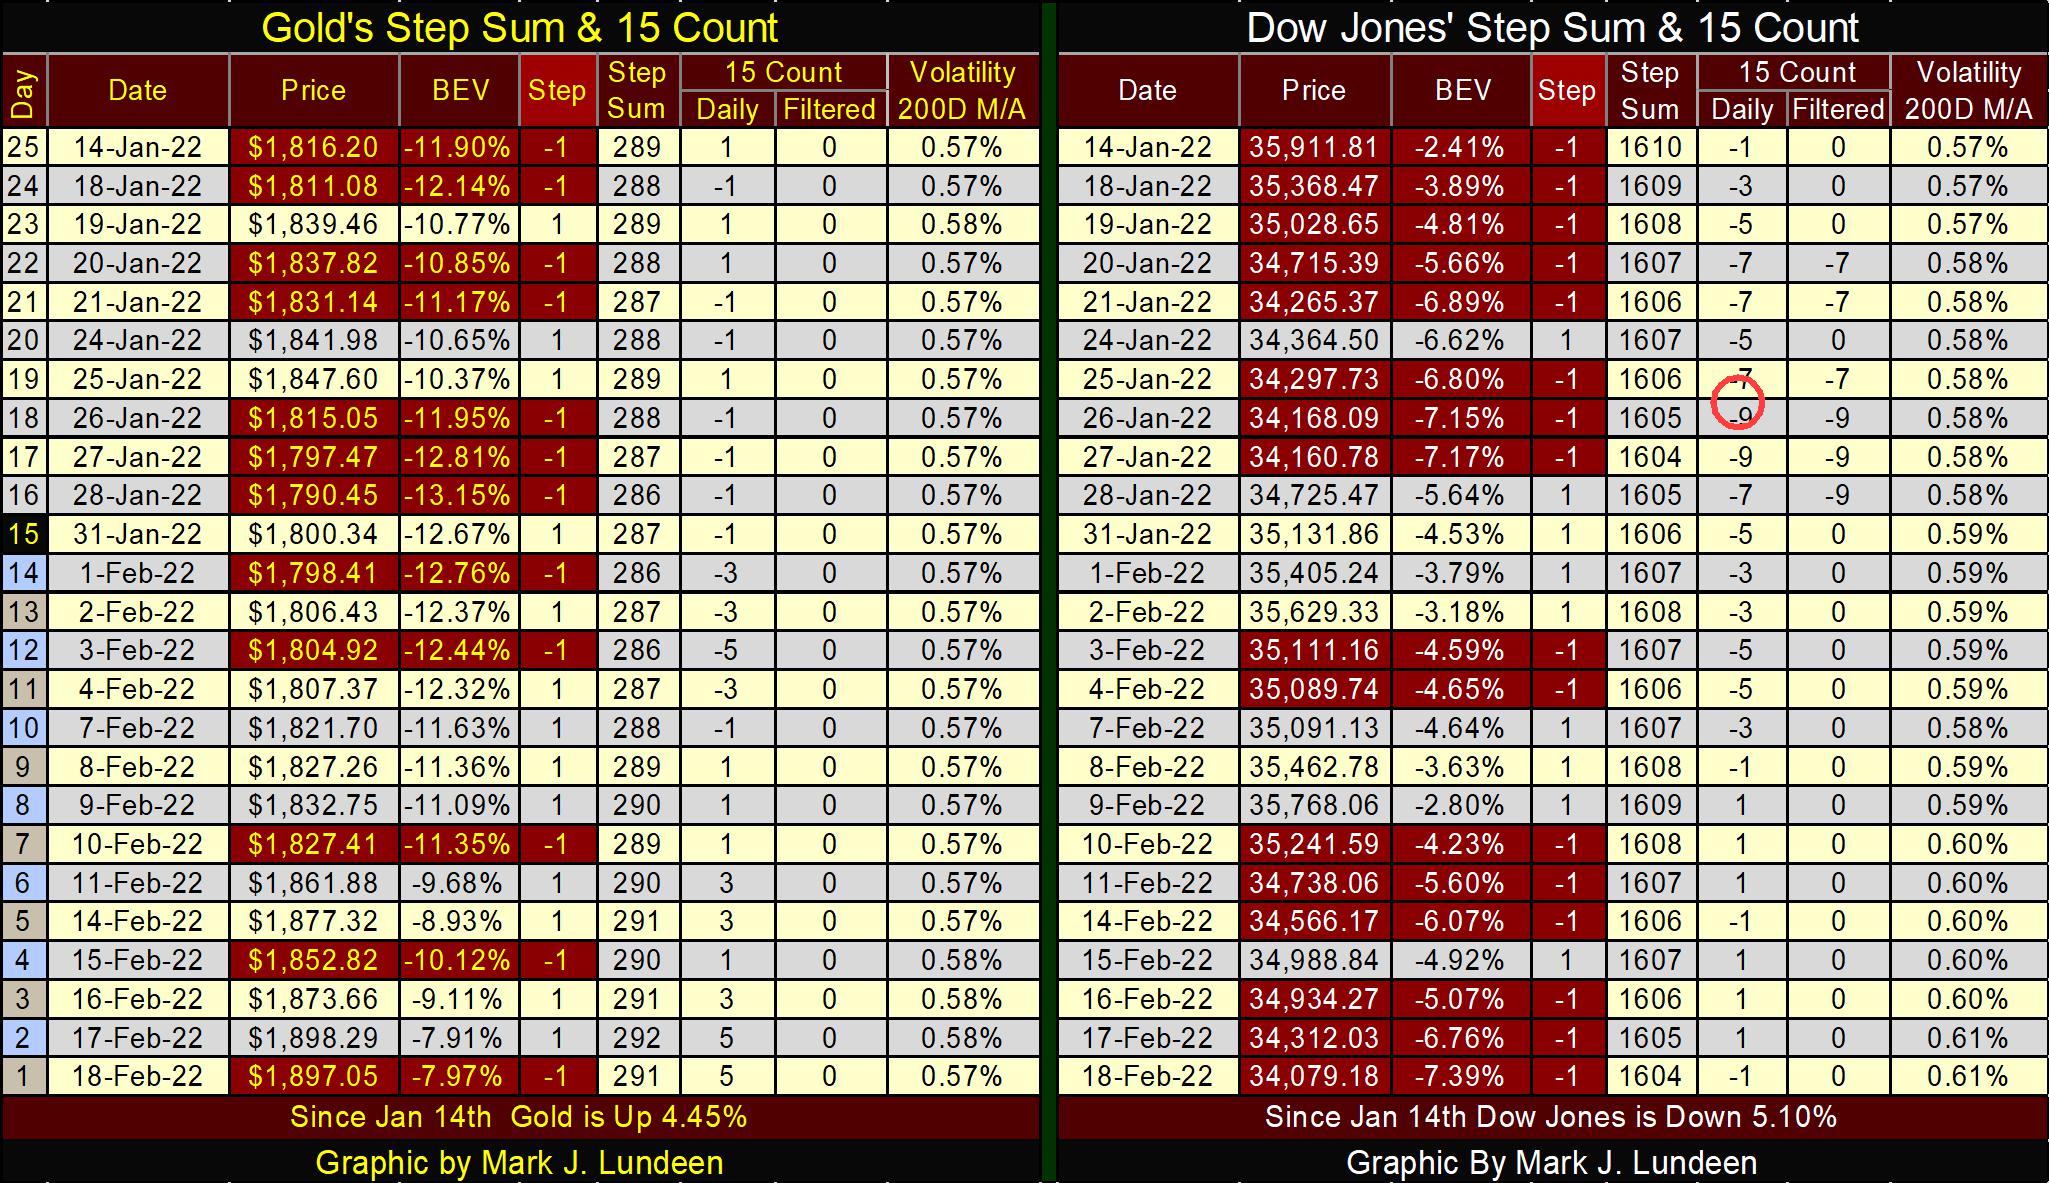
Moving on to gold and the Dow Jones’ step sum tables below, I note gold’s 15-count went from a -5 on February 3rd to a +5 late this week. That’s a big pick up in advancing days for gold. And gold has made good use of them too, picking up just under $100 in the past twelve trading days.
On February 3rd, the Dow Jones also had a 15-count of -5. But in the past twelve trading days, the Dow Jones hasn’t seen the same flows of funds into it as has gold. At the close of the week the Dow Jones may have seen its 15-count increase to a -1, but it also deflated by 1032 points as it did. This is a weak market.
That’s about it for this week. No doubt I’ll have more to say a week from today.
Mark J. Lundeen
********
share
share
share
share
share


