Black Gold Update
With world leaders having "nailed their colors to the mast" in the recent past by going for massive increases in money supply coupled with extremely low interest rates, it is clear that they are going to go all out to inflate and liquify their way out of the finanacial crisis, which given the conditions of debt saturation that currently prevail, means massive inflation and very possibly hyperinflation. This will rapidly reverse the deflation mindset that has resulted in huge losses in commodities and stocks, especially oil. Now that the writing is on wall it looks unlikely that oil will drop as far as our downside target in the low to mid $50's for this decline, and could instead reverse to the upside very soon now if not immediately. That said, if the dollar should continue higher to our provisional target at 92 on its index before topping out, which will be shown on the next Gold Market update, oil could yet drop towards our low $50's target.
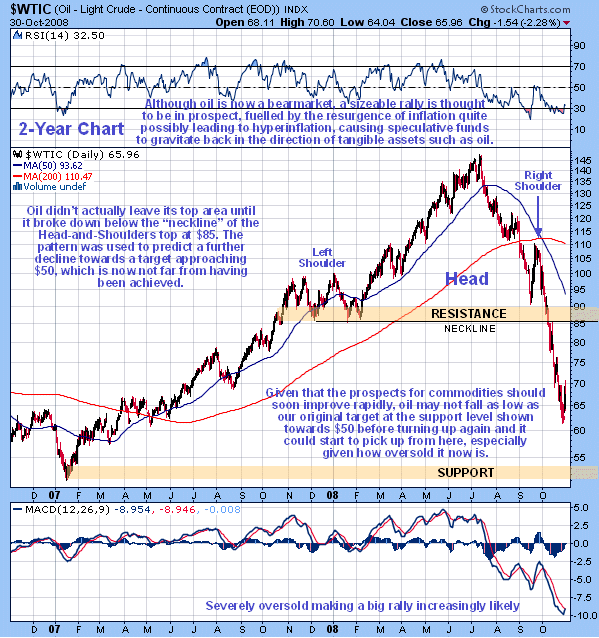
In the last update, posted on 12th October with the price of Light Crude over $77 a barrel, we had expected continued severe decline, despite the oversold condition already existing at that time, because oil had just broken down from a Head-and-Shoulders top that projected a downside target towards $50, and because of the negative situation for commodities generally. Oil has continued to drop as can be seen on the 2-year chart for Light Crude, and fell as low as $62 a few days back, resulting in becoming extremely oversold, hence the bounce of recent days. The fall from the July high at about $147 to the low of a few days back is a massive $85 and on this basis alone we would expect a significant bounce shortly. However, if we also factor in that it is not far above our Head-and-Shoulders downside target, and also the seismic shift in the fundamental backdrop of the past week or two already mentioned, with world leaders opting for unlimited monetary growth to alleviate the financial crisis, we can readily see why the oil price could turn higher again and start a new uptrend soon.

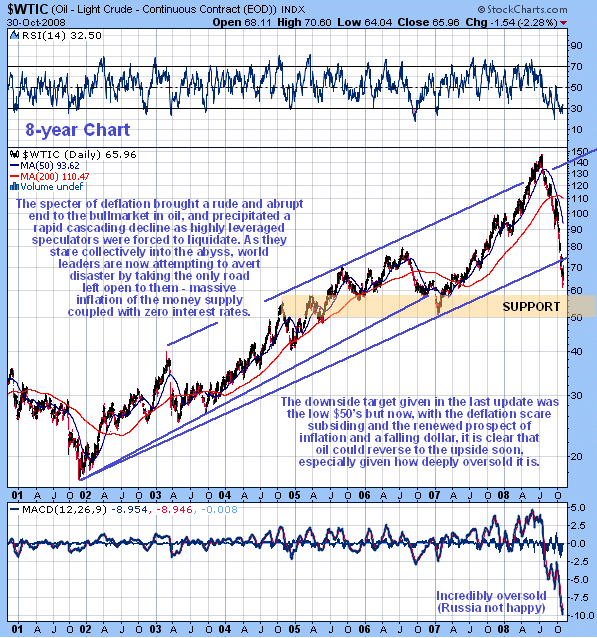
With the price of oil having dropped by over 60% in the space of a few months and its long-term moving averages turning down it hard to avoid calling it a bearmarket, and that is what most market participants would label it. However, despite the magnitude of the recent decline it looks nowhere near so bad on its long-term charts. On its 8-year chart we can see that although it has broken down from its long-term uptrend, it did the same thing early in 2007, breaking down from the long-term uptrend operative at that time, after which it went on to enter a vigorous uptrend. While at this juncture it may seem hard to imagine it attaining new highs, or even equalling July's highs, we can certainly see that an eventual easing of the recessionary conditions that are now making themselves apparent coupled with a highly inflationary environment resulting from a ramping up of the money supply would greatly improve the outlook for oil prices. Thus, for contrarians who like to buy things before or as the tide turns, oil is clearly looking very attractive here.

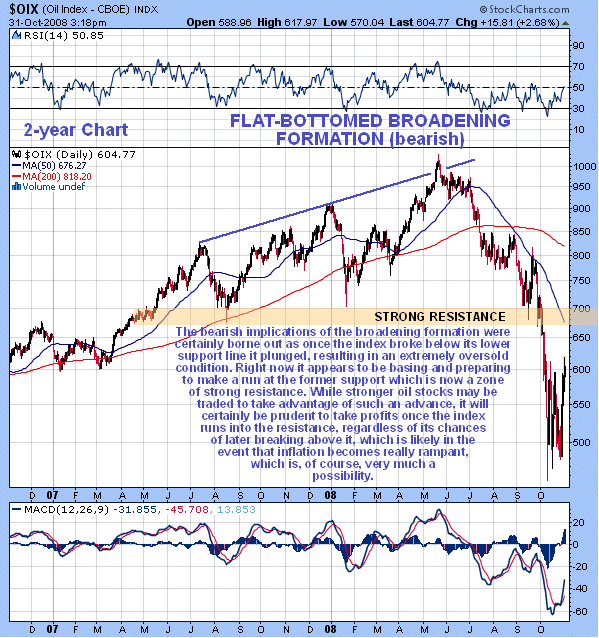
As we know from experience, oil stocks tend to anticipate movements in the price of oil itself, which is why they topped out well ahead of oil back in the Summer, which was a factor behind us turning bearish on oil just before it peaked. Thus it is interesting to observe that oil stocks are starting to look perky again, after having formed what may prove to be an intermediate base area over the past couple of weeks. On the 2-year chart for the OIX oil index we can see how oil stocks plunged upon breaking down from the large, bearish Flat-bottomed Broadening Formation, which only happened early in October. Overall however this remains a bearish picture at this point with a lot of overhead resistance and bearishly aligned moving averages. So should the index make a run at the strong resistance level shown in the near future, as looks likely, the rally can be sold and it would probably be a good time to buy Put options in big oil stocks, as a first attempt to break above this resistance is very likely to fail and be followed by a significant reaction.

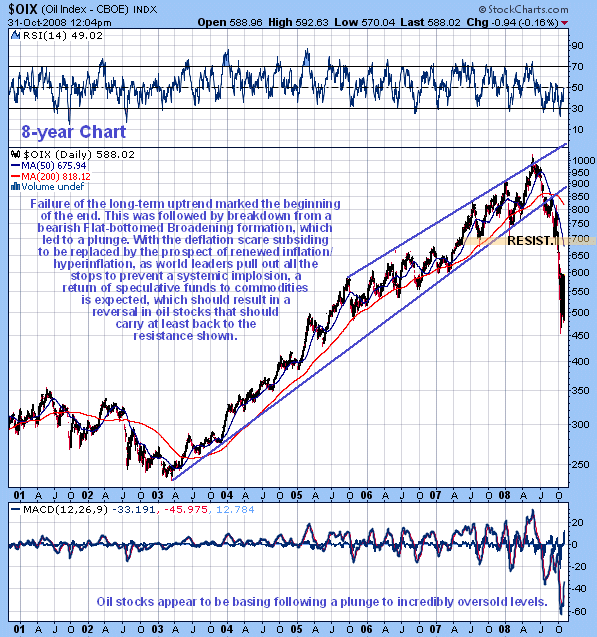
On the 8-year chart for the OIX oil stocks index we can see how oil stocks really "fell out of bed" once they broke below the support at about 670 - 680 at the bottom of the Flat-bottomed Broadening formation, and it is clear that it will take time for sentiment to recover sufficiently to support a significant advance. For this reason we are likely to see more base building before a meaningful uptrend can get underway. This also suggests that any near-term run at the resistance towards 700 will be turned back.

Clive Maund, Diploma Technical Analysis
[email protected]
www.clivemaund.com
Copiapo, Chile


