Brace, Gold Bulls - The Fed Is Going to Keep Its Hawkish Word


With the US economy still on fire and inflation galloping, the Fed has to react firmly. What will happen to gold after the dovish stance changes?
It’s a decision day for the Fed, as a 50 basis point rate hike is likely a done deal. Moreover, while the PMs may record a short-term relief rally, their medium-term fundamentals continue to deteriorate.
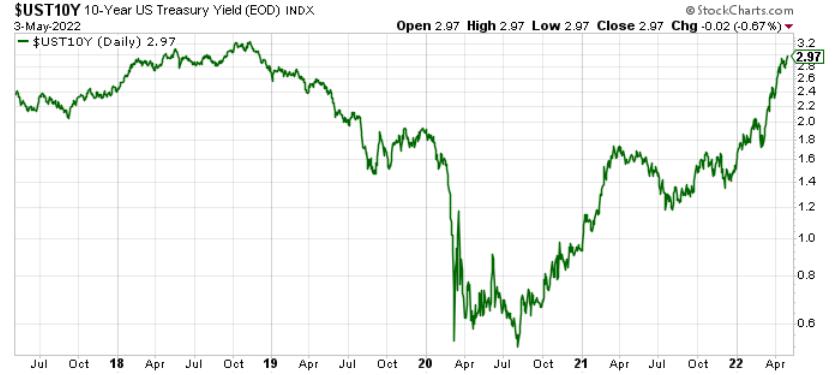
For example, I’ve been warning for some time that higher interest rates would manifest amid rampant inflation, and – surprise, surprise – the U.S. 10-Year Treasury yield has continued its ascent. Furthermore, while the Treasury benchmark eclipsed 3% intraday on May 3, a close above the key psychological level should occur sooner rather than later.
Please see below:
To explain why, I wrote on Apr. 20:
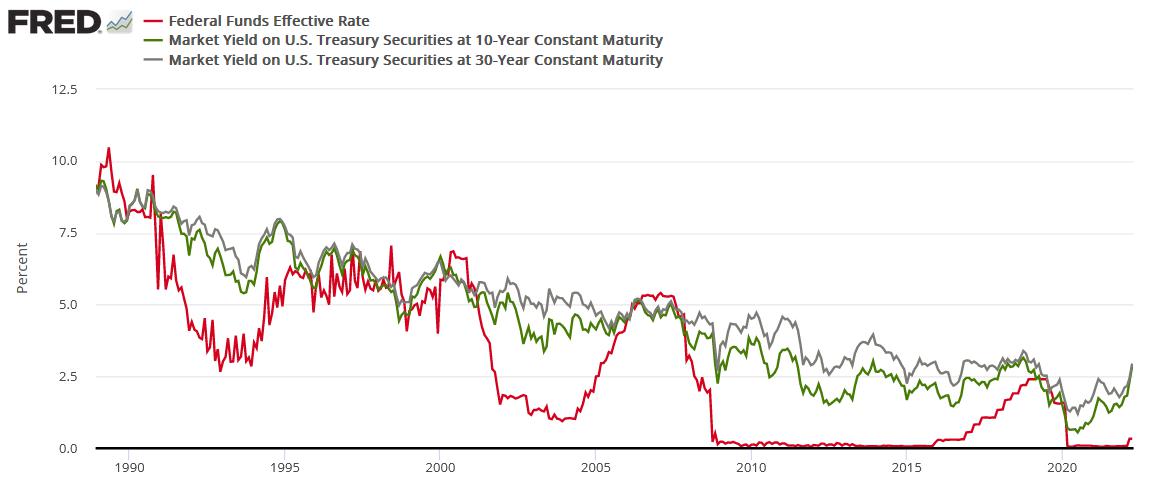
The red line above tracks the U.S. federal funds rate, while the green and gray lines above track the U.S. 10-Year and 30-Year Treasury yields. If you analyze the connection, you can see that the latter two often take their orders from the former. In a nutshell: when the Fed raises interest rates, it takes several hikes of 0.25% before long-term yields rollover. For example:
In 2018, the U.S. 10-Year Treasury yield peaked after ~9 rate hikes.
In 2006, the U.S. 10-Year Treasury yield peaked after ~17 rate hikes.
In 2000, the U.S. 10-Year Treasury yield peaked after ~7 rate hikes.
In 1994, the U.S. 10-Year Treasury yield peaked after ~12 rate hikes.
Thus, with modern history showcasing that the U.S. 10-Year Treasury yield doesn't peak until the Fed is well within its rate hike cycle, please remember that the Fed has only hiked once. Therefore, with seven rate hikes as the minimum to elicit a peak over the last ~28 years, the U.S. 10-Year Treasury yield should have room to run, and this is bullish for real yields and bearish for gold.
Speaking of real yields, with nominal interest rates rising and breakeven inflation rates falling, the U.S. 10-Year real yield closed at 0.18% on May 2 and 0.15% on May 3. As a result, the PMs confront a fundamental time bomb that should blow up their performance over the next few months.
Please see below:
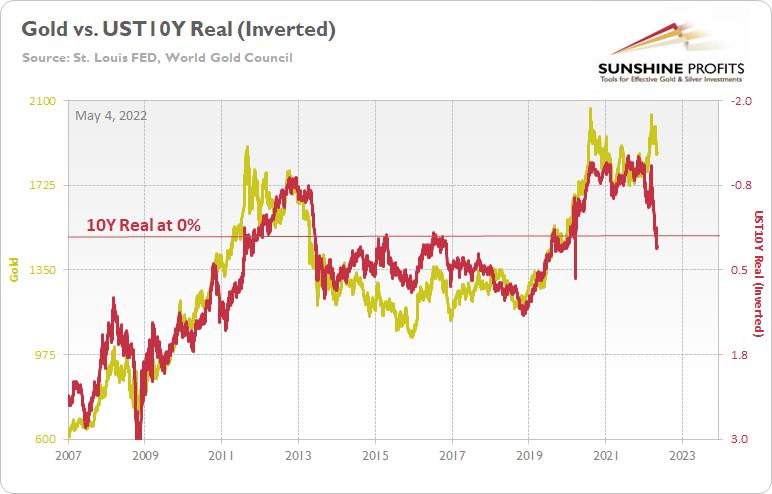
To explain, the gold line above tracks the price tallied by the World Gold Council, while the red line above tracks the inverted U.S. 10-Year real yield. For context, inverted means that the latter's scale is flipped upside down and that a rising red line represents a falling U.S. 10-Year real yield, while a falling red line represents a rising U.S. 10-Year real yield.
For more context, I wrote on Apr. 11:
If you analyze the left side of the chart, you can see that the U.S. 10-Year real yield soared and gold plunged during the global financial crisis (GFC). However, when the Fed launched QE and the U.S. 10-Year real yield sank to an all-time low, gold hit a new all-time high along the way.
Furthermore, the current situation is a spitting image. When Fed Chairman Jerome Powell performed a dovish pivot in late 2018, the U.S. 10-Year real yield suffered. Then, when the Fed fired its liquidity bazooka in March 2020, it pushed the metric to another all-time low. And surprise, surprise, gold hit another all-time high.
However, with the Fed normalizing policy, the U.S. 10-Year real yield has surged in recent weeks. Moreover, the Fed needs to push the metric above 0% to curb inflation.
Thus, it's likely only a matter of time until the milestone is achieved. In addition, a U.S. 10-Year real yield of 0% implies a gold price of $1,500, and while the current narrative suggests otherwise, is this time really different?
To that point, while gold has suffered in recent days, the current price is still well above its medium-trend-based value. Likewise, since the GDXJ ETF is much more volatile than the yellow metal, and therefore, should decline even more, epic drawdowns should materialize if (once) the two lines reconnect (not necessarily in the immediate aftermath of the rate hike, as PMs could rally based on the move-on-the-rumor-reverse-on-the-fact tendency).
For example, while these events take time to unfold, history shows that the “this time is different” crowd ends up losing more than just their pride. I first highlighted the epic divergence between the U.S. 10-Year Treasury yield and the U.S. 10-Year breakeven inflation rate on May 11, 2021. I wrote:
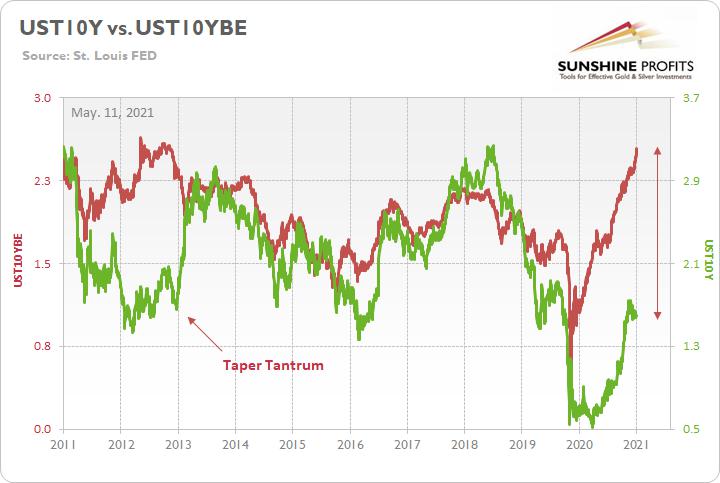
To explain, the green line above tracks the U.S. 10-Year Treasury yield, while the red line above tracks the U.S. 10-Year breakeven inflation rate. If you analyze the left side of the chart, you can see that when the bond market finally snapped in 2013, the U.S. 10-Year Treasury yield’s surge was fast and furious. More importantly, though, if you analyze the right side of the chart, you can see that today’s gap makes 2013 look like an appetizer. As a result, with material divergences often reversing in violent fashion, it’s only a matter of time until the next earthquake erupts.
Therefore, while the fundamental thesis didn’t materialize overnight, the two lines eventually reconnected; the U.S. 10-Year Treasury yield surpassed the U.S. 10-Year breakeven inflation rate, and the U.S. 10-Year real yield turned positive.
However, now it’s the gap between gold and the U.S. 10-Year real yield that makes 2011 look like an appetizer, and the same outcome should occur. As a result, the prospect is profoundly bearish for the PMs.
From Negative to Positive
Conversely, with bonds oversold and the stock market nearing a breaking point, investors continue to ask: “Where is the Fed put?” For context, put options are like insurance contracts, and they protect investors when drawdowns occur. In a nutshell: investors expect the Fed to step in, turn dovish, and save stock market investors from their poor valuation decisions.
However, the prospect is far-fetched, and here is why. Following the global financial crisis (GFC), the Fed ran to the rescue whenever the stock market threw a tantrum. As such, investors with short memories assume that the post-GFC script is the right analog. Yet, they fail to realize that the year-over-year (YoY) percentage change in the headline Consumer Price Index (CPI) peaked at 3.81% in September 2011. Thus, the Fed could ease without worrying about stoking inflation.
Conversely, with the headline CPI at ~8.6% YoY now, the game has completely changed.
Please see below:

Second, the other half of the Fed’s dual mandate is maximum employment. With U.S. job openings hitting an all-time high of 11.549 million on May 3 (March results), the data is extremely bullish for Fed policy. For context, the consensus estimate was 11 million.
Source: Investing.com
More importantly, though, another resilient report means that there are now 5.597 million more job openings in the U.S. than citizens unemployed, also an all-time high.
Please see below:
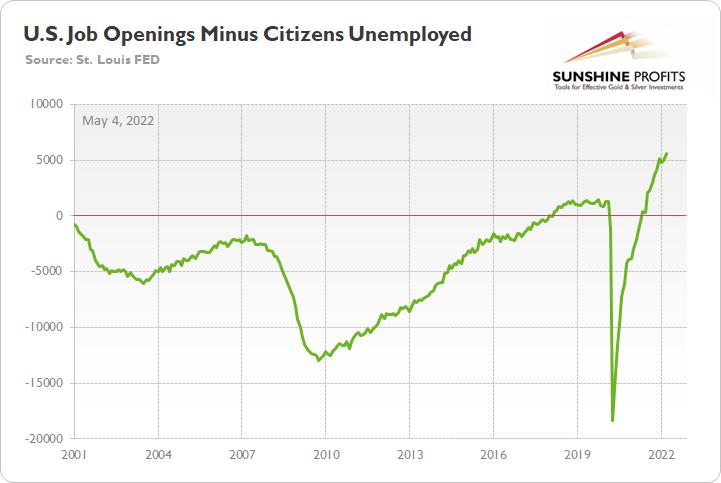
To explain, the green line above subtracts the number of unemployed U.S. citizens from the number of U.S. job openings. If you analyze the right side of the chart, you can see that the epic collapse has completely reversed and the green line is at a record high. Thus, with more jobs available than people looking for work, the economic environment supports normalization by the Fed.
Again, please consider the CPI data above with the job openings spread post-GFC. The period had well-anchored inflation and unemployed citizens outnumbered job openings until 2018. That’s nothing like the current environment. Furthermore, can you notice how the spread’s outperformance helped spur the Fed’s most recent rate hike cycle?

To explain, the green line above tracks the job openings spread, while the red line above tracks the U.S. federal funds rate. If you analyze the relationship, you can see that the spread’s move toward neutral was a hawkish indicator.
Likewise, with the spread positive and at an all-time high, the data alone justifies several rate hikes. However, as mentioned, we also have a YoY headline CPI that’s at its highest level since the 1980s. Thus, if investors assume the Fed lacks the ammunition to follow through with its hawkish promises, they should suffer the same fate as the “transitory” camp did in 2021/2022.
Finally, S&P Global released its U.S. Manufacturing PMI on May 2. The report revealed:
“Operating conditions improved markedly across the U.S. manufacturing sector, according to April PMI data from S&P Global…. New orders increased at a marked pace at the start of the second quarter, and at a rate broadly in line with that seen in March. Companies reported stronger demand conditions, with some noting that new sales expanded despite
substantial rises in prices. Meanwhile, new export orders grew at the fastest rate for
almost a year.”
Also noteworthy:
“Manufacturers recorded a solid rise in employment in April. Workforce numbers grew following greater production requirements and in response to staff leaving voluntarily. Some firms also stated that job creation was linked to the filling of long-held vacancies. Labor
shortages continued to be mentioned as a weight on growth, however.”
More importantly, though:
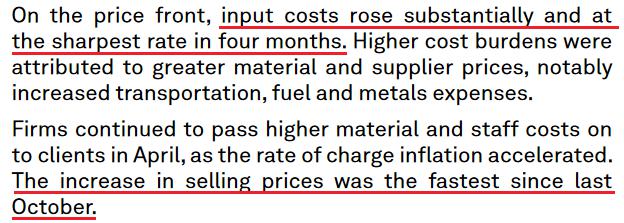
Source: S&P Global
The bottom line? While investors continue to pray for a dovish pivot, they’re likely in for a rude awakening. The U.S. labor market remains abnormally hot, and the latest PMI data shows that inflation is still accelerating. Moreover, while real yields have turned positive, they have done little to cool a U.S. economy that’s flooded with too much stimulus. As a result, with a hawkish Fed poised to push the U.S. 10-Year real yield even higher over the medium term, the PMs should suffer mightily as the drama unfolds.
In conclusion, the PMs rallied on May 3, as sentiment doesn’t die easily. However, while the technical backdrop could support a short-term rally, the PMs’ medium-term technicals and fundamentals are profoundly bearish. Therefore, investors’ optimism should turn to pessimism over the next few months.
Thank you for reading our free analysis today. Please note that the above is just a small fraction of today’s all-encompassing Gold & Silver Trading Alert. The latter includes multiple premium details such as the targets for gold and mining stocks that could be reached in the next few weeks. If you’d like to read those premium details, we have good news for you. As soon as you sign up for our free gold newsletter, you’ll get a free 7-day no-obligation trial access to our premium Gold & Silver Trading Alerts. It’s really free – sign up today.
Przemyslaw Radomski, CFA
Founder, Editor-in-chief
Sunshine Profits: Effective Investment through Diligence & Care
* * * * *
All essays, research and information found above represent analyses and opinions of Przemyslaw Radomski, CFA and Sunshine Profits' associates only. As such, it may prove wrong and be subject to change without notice. Opinions and analyses are based on data available to authors of respective essays at the time of writing. Although the information provided above is based on careful research and sources that are deemed to be accurate, Przemyslaw Radomski, CFA and his associates do not guarantee the accuracy or thoroughness of the data or information reported. The opinions published above are neither an offer nor a recommendation to purchase or sell any securities. Mr. Radomski is not a Registered Securities Advisor. By reading Przemyslaw Radomski's, CFA reports you fully agree that he will not be held responsible or liable for any decisions you make regarding any information provided in these reports. Investing, trading and speculation in any financial markets may involve high risk of loss. Przemyslaw Radomski, CFA, Sunshine Profits' employees and affiliates as well as members of their families may have a short or long position in any securities, including those mentioned in any of the reports or essays, and may make additional purchases and/or sales of those securities without notice.
********
 Przemyslaw Radomski, CFA, is the founder, owner and the main editor of SunshineProfits.com. You can reach Przemyslaw at: http://www.sunshineprofits.com/help/contact-us/.


