Canadian Gold Mining Outlook, Part 2
 share
share
 share
share
 share
share
 share
share
 share
share
Canadians, much more so than Americans, are inveterate goldbugs. They are especially fond of gold mining stocks and exploration companies—as well they should be since so much of Canada's economy depends on the market condition of the yellow metal. So it comes as no surprise that many Canadians are beginning to feel a lot more optimistic (and even a bit euphoric) over the drastically improved outlook for the country's gold mining sector.
We wrote in last month's Canadian gold mining outlook commentary (see archive below for the original commentary) that the outlook for Canada's gold was beginning to look promising for the first time in years. While it may still be too early to make that prognosis with authority, it is indeed beginning to look better by the week and the technical picture of many Canadian gold mining companies is looking truly splendid.
What is most surprising to us is the large number of Canadian mining stocks that show chart patterns with a distinct "bottom" flavor (i.e., stocks that appear to have bottomed out and look ready for a fresh rise in share price). In fact, virtually every Canadian gold stock we have analyzed is either coming out of a bullish long-term "falling wedge" formation, a "saucer bottom" or some variation of the "head and shoulders" reversal formation. In sum, Canadian golds project a strong technical outlook in the near- to intermediate-term.
What follows is a technical analysis of potentially profitable gold mining companies—both "juniors" and "blue chips" alike—beginning with those companies who show the most promising outlook and followed by the more speculative plays. The charts from which we derived our analysis were provided by WIL-ARM (e-mail: [email protected]), the authority on Canada's gold mining stocks.
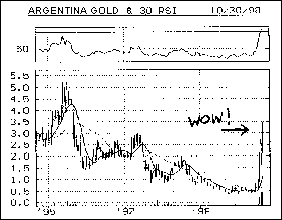
The big winner from last month's Canadian golds commentary was Argentina Gold, which advanced by approximately 400% from the time we recommended it. This can be seen quite clearly on its chart which shows a spectacular, almost straight-up advance from its "saucer bottom" support at 5 cents/share. It currently trades at $3.50/share. This meteoric rally was attended by a healthy increase in volume and a significant rise in its Relative Strength Indicator (RSI). For investors who missed this opportunity, we advise waiting to see what Argentina Gold's next move will be. Obviously, a correction (probably a fairly significant one) is in the offing based solely on its relentless runup. If $2.50-$3.00/share holds as a support and a bullish "flag" pattern begins forming, you will know it is time to climb back on this stock in anticipation of the next rise. And if a bullish flag does indeed form, a minimum price target of close to $6/share can be expected (based on the measuring implications of the "staff"). Our recommendation: investors who are profitably long this stock take partial profits and await further action. Investors who want to ride this stock further wait for a consolidation to form and slowly enter positions as long as $2.50/share holds as a support. Volume throughout this theoretical consolidation phase should be relatively light; if volume is heavy, exit this stock immediately as a crash in share price will probably ensue.
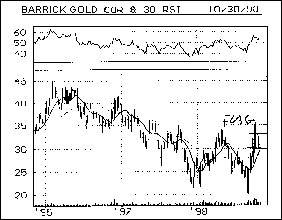
The bluest of the blue chips in the gold mining sector—Barrick Gold—has perhaps one of the healthiest of the charts of Canada's mining companies. We have been recommending this stock for several weeks now and readers who have taken our advice have seen nice profits as the stock rose by several percentage points since our recommendation. Barrick now looks to be consolidating its gains from its recent impressive runup and a bullish "flag" appears to be forming on its chart. Its RSI also looks positive and the stock is currently supported by its moving average. Investors should look for a noticeable pickup in volume and a strong breakout above the $35/share level before committing heavily to this stock. Based on the minimum measuring implications of its "mast," Barrick's share price could be going to $45/share before again meeting resistance (and this is exactly the area where ultimate resistance lies). Nearer-term resistance lies overhead at $40/share.
Another of the blue chips, Battle Mountain, is also showing a fairly bullish chart pattern that resembles the bullish flag pattern. Again, a high-volume pickup and subsequent breakthrough above the $7/share level will provide strong confirmation that a move to the $9/share level is underway, where, incidentally, overhead resistance lies. Momentum indicators currently look positive, but confirmation should be given before this stock is heavily purchased.
Goldcorp Inc. shows a bullish flag pattern forming on its chart confirmed by a positive RSI chart. The stock has strong support between the $2-$4/share levels and its moving average is currently pointing up. We suspect this stock will move to $12/share based on the measuring implications of the mast portion of its flag formation on the chart. Definitely a healthy-looking stock, short-term.
Holmer Gold is a thinly traded share with a less than two-year history and is technically classified a "penny stock" as its shares trade far below $1/share. We try to avoid stocks like this because of the inherent liquidity problems and large potential for profit loss associated with these stocks compared to a more widely traded and firmly established company. Still, its chart pattern looks quite bullish, and at approximately 20 cents a share it is a gambler's play with large profit potential over a short time frame. Its RSI is pointing firmly up and it recently broke (on increased volume) decisively above the 15 cent/share resistance level that had proven to be confining for this stock for several months. High-risk speculators may want to give this stock a look.
Iamgold International's chart shows a strong flag type formation—currently in consolidation—that could propel its stock price as high as $6.50/share (from its current $4.50/share) over the next few weeks. It seems to have bottomed near-term at just under $2.50/share and both is currently supported by its moving average. RSI looks fairly healthy and volume action has accompanied the latest significant moves in this stock, so keep a sharp watch for an increase in volume accompanied by a move above $5/share. This should provide all the confirmation needed that this stock is headed higher.
Perhaps the Candadian gold mining stock with the most impressive-looking chart is Macmillan Gold, a stock we recommended as a potential buy candidate a few weeks ago. It shows a clear and beautifully formed head and shoulders reversal formation on its chart and is currently etching out a miniature bullish flag. It is currently supported by its moving average and its RSI is starting to point higher. The "neckline" resistance is at 5 cents/share and any move above this level by at least 3 percent qualifies as a technical buy signal (a la Edwards & Magee). Definitely keep this stock on your list of potential buy candidates.
Another of the gold mining blue chips, Placer Dome, is showing quite clearly a bullish flag formation that portends an upside move to at least the $35/share level (its next major area of resistance). The RSI for this stock is looking particularly strong so a runup in share price could be imminent.
River Gold Mines also shows what could be interpreted as a bullish flag pattern in its chart and has a positive RSI at the moment. It appears to have strong support at the $3/share level and its next move will probably be a test of $4.50/share overhead resistance. It currently trades at $3.50/share.
Scintilore Exploration experienced an explosive move to 65 cents/share from 30 cents/share last month. This is extremely impressive but investors should proceed with equally extreme caution as it could be nothing more than a "blow-off" advance prior to a crash in share price. Potential investors in this stock should look for a stabilization of share price on diminishing volume that sees prices steady between the 55-65/share level. Technically, this would form a flag pattern and would point to a continuation of the recent bullish trend in this stock. Any violation of the 55/share level should be viewed as bearish. The next overhead resistance is at 70 cents/share, but a breakout from a flag formation could lead to an upside price target of at least 85 cents/share (this applies only if a flag begins forming on the chart). A speculative play for now.
Winspear Resources—a stock we recommended in our last Canada golds outlook—has performed quite bullishly as we anticipated and was the source of much profit for readers who took our advice. The chart for Winspear shows a bullish continuation flag pattern. However, we anticipate a consolidation period in this stock and investors should wait for a positive confirmation before committing heaviliy to this stock. Momentum indicators look healthy for Winspear, however, so we expect a continuation of the bull move in this stock after a temporary correction from its latest runup. Our near-term maximum target for this stock is at $4.50/share resistance (it currently trades at $2.50/share).
share
share
share
share
share
More from Gold-Eagle


