Changes Are Coming


We humans are supposed to be rational. Unless we have some disorder we do not, as a rule, do something weird, strange or unexpected on the spur of the moment. When an individual does break normal patterns of behavior it might be perceived as an instance of temporary aberration. Yet, now out of the blue we observe behaviour by, presumably, a large number of people, that is unexpected and appear not fully rational. What is happening speaks at least of spontaneous coordination if not being carefully premeditated. As it also involves large amounts of money, there has to be a reason behind the behavior, even if what it is may not be obvious to the observer. This reference is, of course, to the sudden, massive decrease in the open interest of mainly gold but also silver.
So, assuming the sellers of all the long positions and buyers who are closing their short positions are doing it because they consider these their best courses of action, respectively, what could be a reason that motivates their behavior from completely different market positions? Finding an answer to these questions is complicated by how the metal prices behaved during this period of rapid decline in open interest.
When there is an increase in activity because of a short squeeze that compels short sellers to buy at all costs, prices increase rapidly. Given a panic among the longs, then prices fall steeply as they run for cover. It does not make any sense that with such a steep decline in OI the prices hardly respond at all; surely a short squeeze on the shorts and panic among the longs cannot happen at the same time. It is also interesting that the preliminary Comex report on open interest is available, but the section on metals trading on Friday is left blank.
It baffles the mind that so many longs and the large shorts in the Cartel camp could just suddenly to meet in the middle and close a massive number of positions over a period of only a few days. As noted above, it is not the prospect of a sudden short squeeze, for whatever unknown reason, because then the longs would hold onto all their positions and be buying more. It is not an incipient panic among the longs, as the shorts would be sitting with a wide smile at much lower prices.
The only thing that remotely makes sense is the assumption that the long positions that are being closed are intended to reduce the open short positions as much as possible to cover an imminent bull trend in the metal prices. This can only happen in the real world when the price suppression halted and prices are free to find their natural level.
It also implies that the long positions that are being closed have been camouflage that originates in the camp of the shorts to maintain high daily trading volumes as pretense of an active market. That would explain the high daily volumes that have been noted by various commentators yet most of the time the price hardly budges.
Based on interpretations of various events or trends in the PM market, there have been many reports that in effect said, “A new bull is imminent!”, exactly like I did. It also has been said by others who find the steep drop in OI confounding. Yet it would seem this time around there is more substance to support expectations that the bull is really imminent than at any time in the past.
A conceivable market neutral – if only briefly – development that could trigger such closing of the (suspected) two sides of covert trades by the Cartel might be if they had received official warning that while suppressing prices by naked short selling is accepted by the authorities, they baulk at what amounts to organized ‘spoofing’ on a massive scale. This is not spoofing in the recognized meaning of making false bids or offers to influence the market, but completed trades kept open to confuse the market. After a JPM trader recently was slammed for spoofing, this is now a no-no.
Given we are at time of writing still blind to the metal trading statistics on Comex for Friday, there is no indication whether liquidation of positions might continue into this week. If it does continue – perhaps, who knows? – to levels of OI comparable to other commodities on Comex, such low OI would really release the cat among the pigeons! The trading reports will be closely watched and also the CoT on Friday.
It is not rational to entertain the possibility that such behavior, sustained for days and with great effect compared to historical precedent, can be a result of irrational motivation. There has to be a rational reason and no doubt time will reveal it.
Reports coming out about very large corporations being in deep trouble are scary. They appear to suffer from reduced liquidity under the massive loads of ‘buy back’, and other debt, taken on recklessly when interest rates were low, to provide top management with near term windfall profits on their stock options, but, as is clearly now happening, with a near disastrous delayed effect on the corporations. In some cases the ‘near’ might later have to be removed from the preceding sentence.
They say that stock markets look ahead and reflect where the economy is expected to be 12 to 18 months into the future. If the current level of Wall Street, which is seen as too high by many commentators who anticipate a deep sell-off, is correct in terms of what the future holds, the market anticipates the economy to boom. Even without the presence of a General Electric or General Motors. Perhaps in due course some others too, both large and small, when expected higher rates in December and later in 2019 eat away at what financial reserves they still retain.
If the widely expected sell-off does happen, it is not likely to stop and reverse half way, as it did in 2009 when the Fed pumped trillions into the financial system. This time – if there is one soon – the Fed will not have the scope to repeat that solution. It may happen, if they should try, that this time investors will ride all over them on the way down. There are just too many funds of all kinds that will do all they can at whatever price to get through the exit out of the stock market, narrow as it might be. So many are already actuarially insolvent that they will be under great pressure to save what they can of what remains.
We have been living in interesting times for practically all the time since 2000. It has now reached the stage where if any more interesting things were to happen, it would become an outright disaster.
A number of the charts have been substantially modified as they outgrew the older chart patterns of which some have served for longer than a year with no changes.
Euro–Dollar
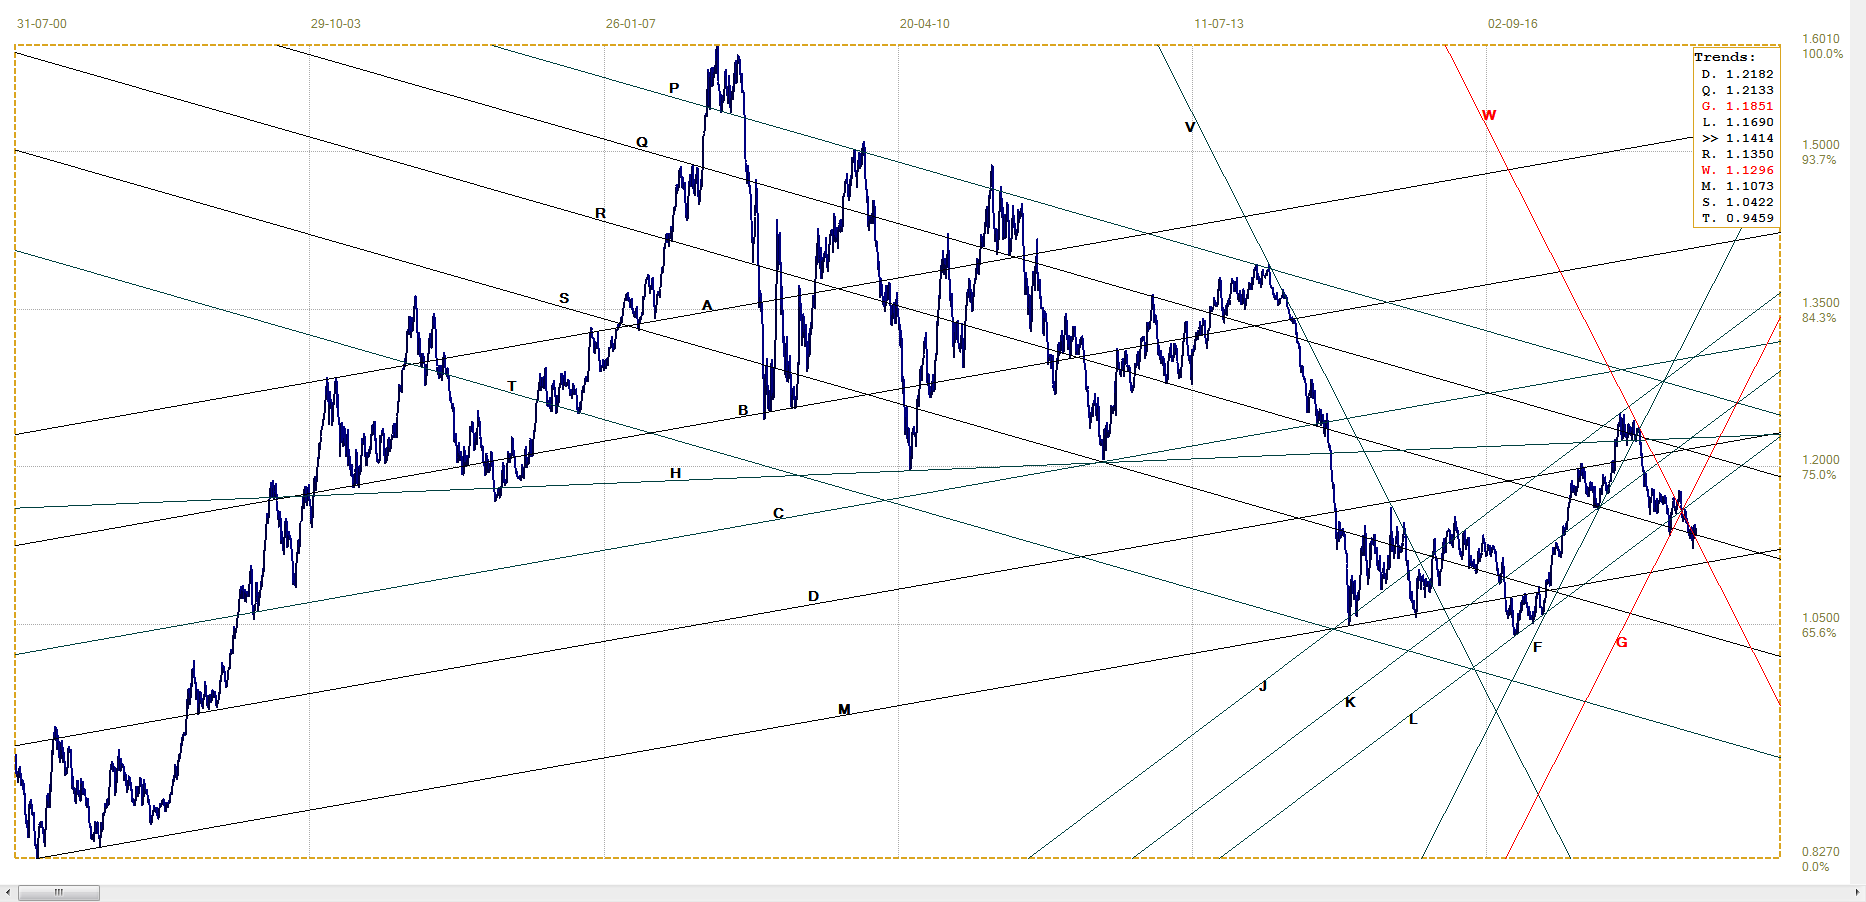
Euro– dollar, last = $1.1414 (www.investing.com )
Repeating the bear trend below steep bear channel VW, has carried the euro lower along line W ($1.1556), starting near the top of channel CDE and all the way down to line R ($1.1345), which it reached almost a month ago. As lines R and W move lower over time and the euro remain stuck in its tight consolidation, it drifted higher through their resistance to issue a minor bullish signal. For the signal to bear fruit, the euro has to begin a steady upwards move, of which there as yet no clear sign. A possibility that line R is a neck line of a head and shoulders formation that will be bearish on a clear new break below line R is something to keep in mind.
DJIA
Recent very high volatility has the DJIA oscillating between lines A (26 134) and Y (24 519), having just bounced off line B (24 286) after a minor break below line T. The rebound has so far only reached as far as line L (25 565), the bottom of bull channel JKL. That could be a goodbye kiss on the channel that might end the high volatility with a sustained trend lower, to break below lines B and Q (23 771). Yet, considering the degree of overt and probably strong covert support for Wall Street – from all vested interested intent on keeping Wall Street stable – the possibility of a break higher to test line A again cannot be excluded.,
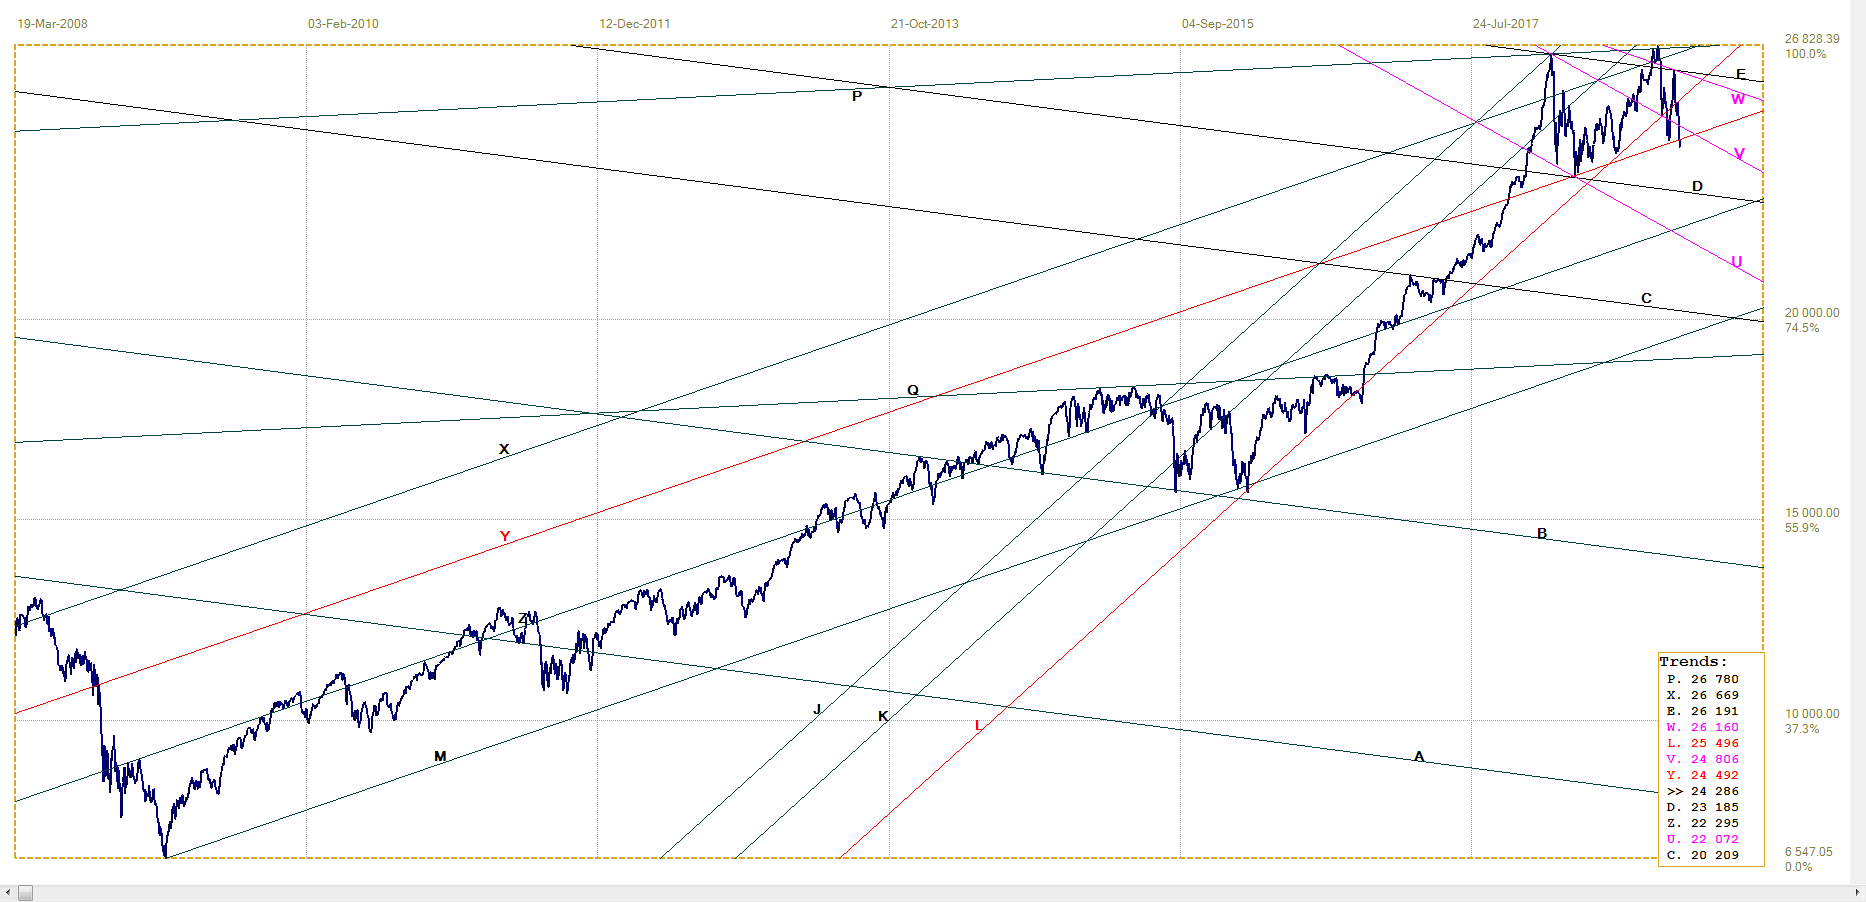
DJIA, last = 25413.22 (money.cnn.com)
Gold PM fix – Dollars
A new analysis has channel JKL ($1212) as a shallower bull channel than before and with a definite bullish break out of steep and broad bear channel VW ($1156) to return to the shallow bull channel ZM ($1214).
After breaking clear above line M, the price of gold returned to test the support along line M in what might become a goodbye kiss or two, as long as the support of channel KL holds. The price is precariously poised and it is anyone’s guess what this large scale capitulation of open interest on Comex is going to do to the price of gold over the next few days or weeks.
Perhaps the cause of that capitulation will be revealed soon, in which case, reason dictates, the odds favour a new bull trend more than a definite break clear below the nearby support.
Gold price – London PM fix, last = $1222.40 (www.kitco.com )
Euro–Gold PM Fix

Euro gold price – PM fix in Euro, last = €1071.92 (www.kitco.com)
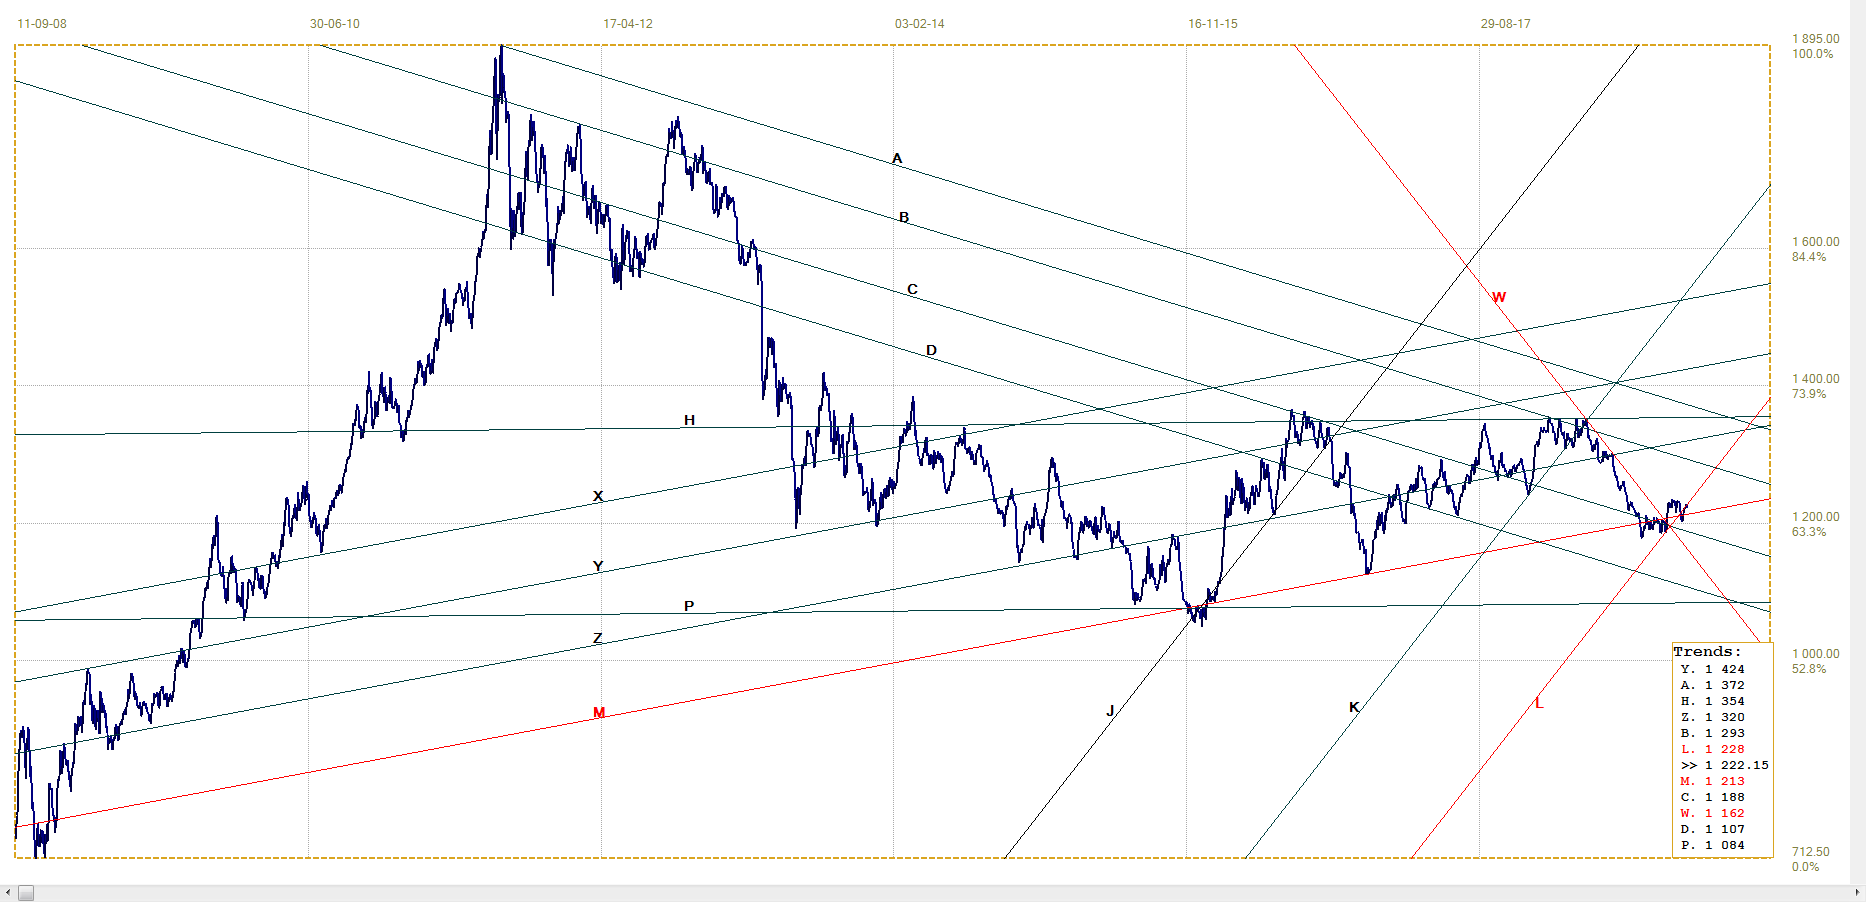
Bear channel PQRS (€1023) is new. It shows why the euro price of gold has been stuck sideways for the past week or two. Bull channel JKL (€1078) is also new and it shows why the past month or two the euro price of gold was bullish.
It now depends on which of these two channels is going to determine the euro price of gold for the near to perhaps medium term. Assuming that the OI situation resolves into a bull trend for gold, the forced break expected soon should be to remain in channel KL
Silver Daily London Fix
Another new analysis has silver having been dominated by the bear channel ADC ($15.82) and the very narrow and steep bear channel YZ from which the price had broken sideways. The break from channel YZ failed to extend above line R ($14.95) and then retreated for what could be a goodbye kiss on line Z and also a rebound off line B ($13.80) to hold in channel KL ($14.22).
Here too the resolution of the OI collapse should determine the next trend – with the odds favoring a good rally. Silver has lagged gold to a significant degree since 2011 when it feel steeper and further and now is slower to get off its lows. It is still expected to outperform gold when the bull market resumes.
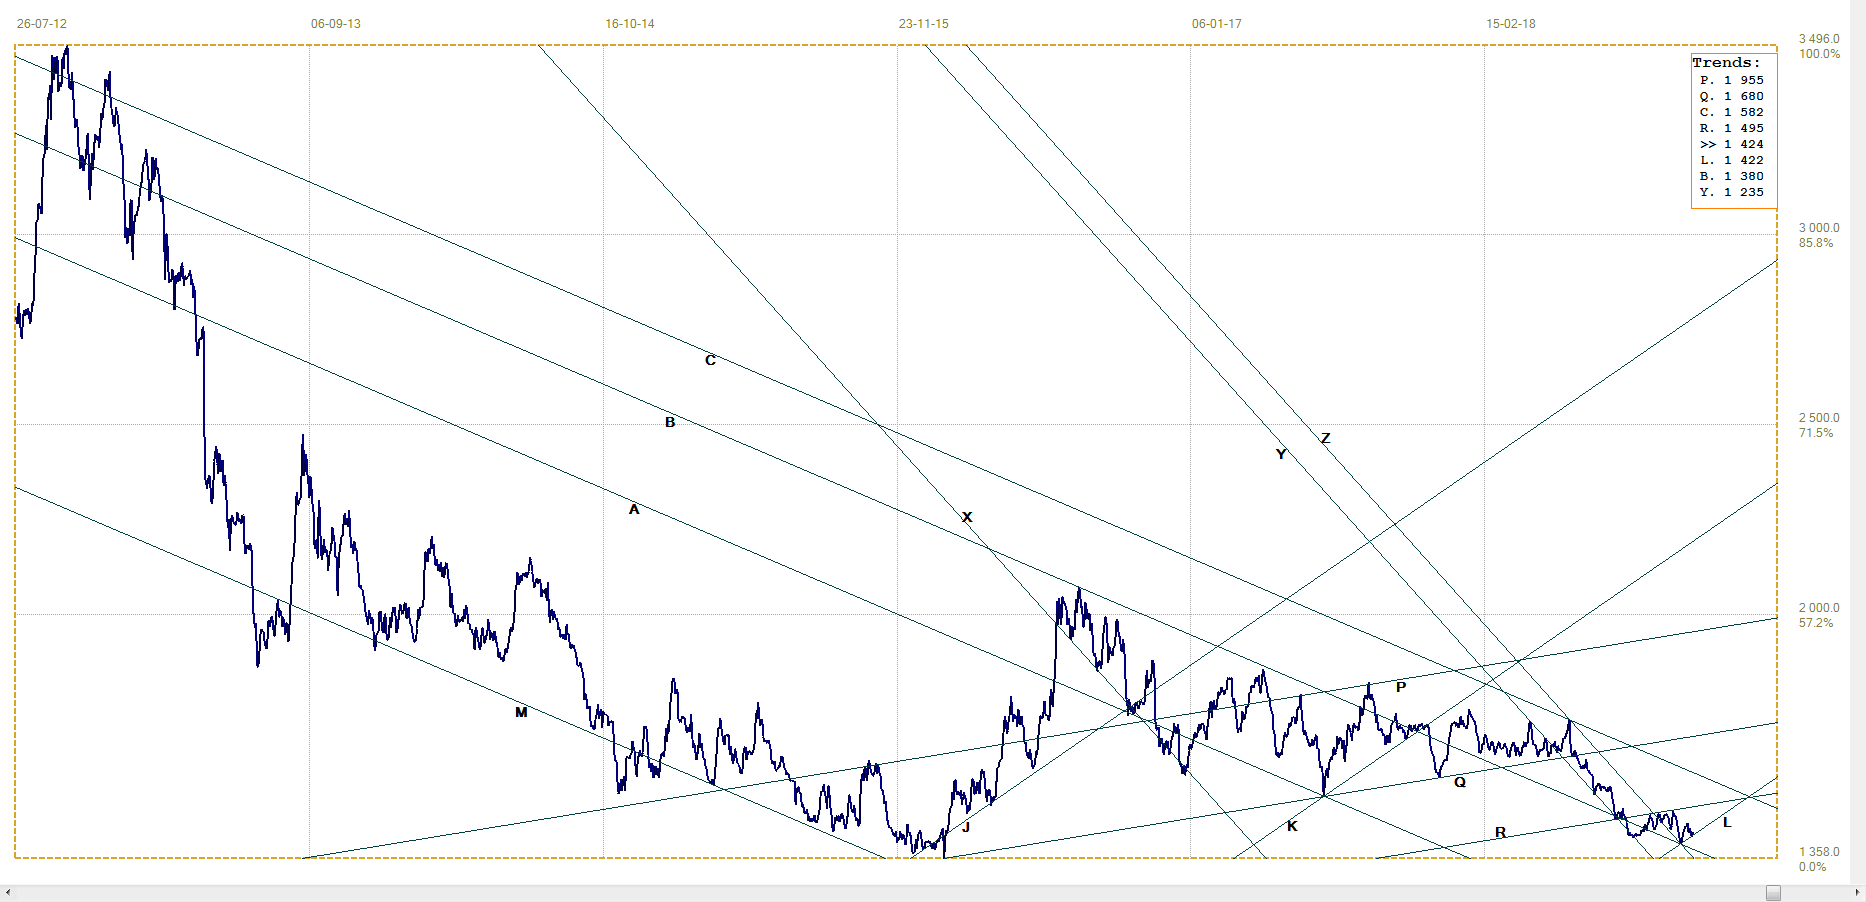
Silver daily London fix, last = $14.285 (www.kitco.com)
U.S. 10–year Treasury Note
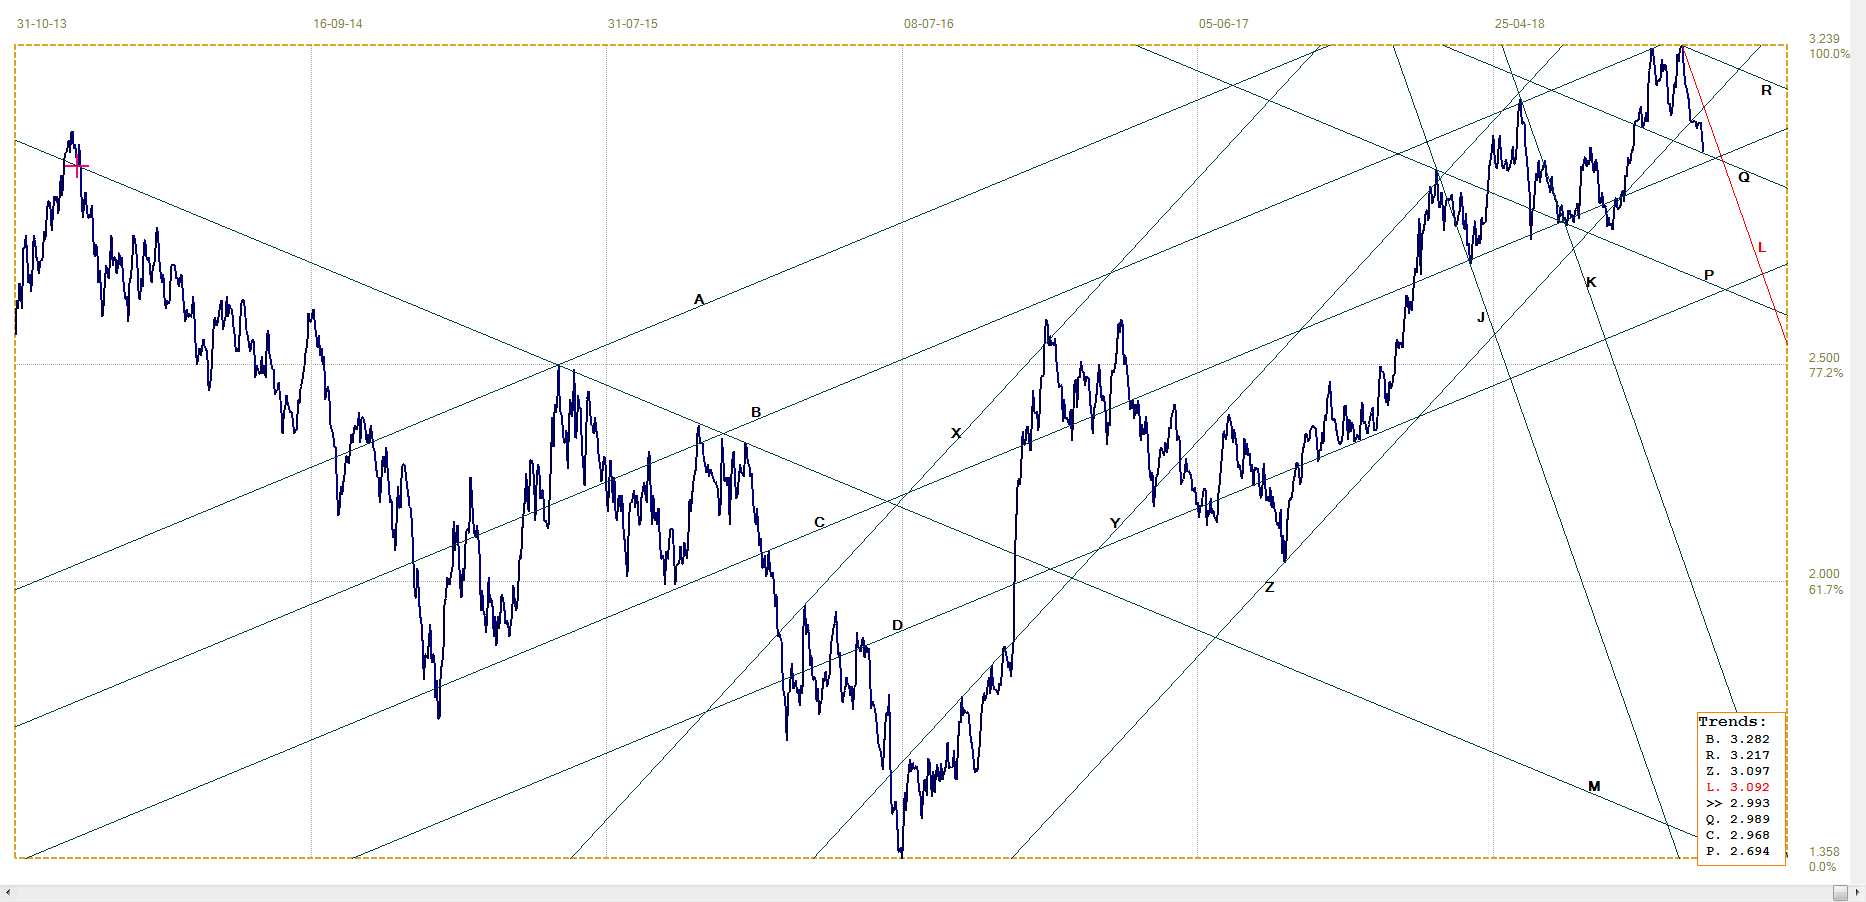
U.S. 10– year Treasury note, last = 2.993v (www.investing.com )
In this modified analysis, the move lower after making the near double top a little above line B (3.282%), the yield fell steeply out of the second top to break below bear channel YZ (3.097%). Line Q (2.989%) came into play and then stopped the new rally late last week.
There seemed a good chance that the yield could make it as low as the bottom of bear channel BC (2.968%), but in order to do so the bond market first has to break below line Q. The general outlook nevertheless has to remain remains bullish while the yield holds to bull channel KL (30092%).
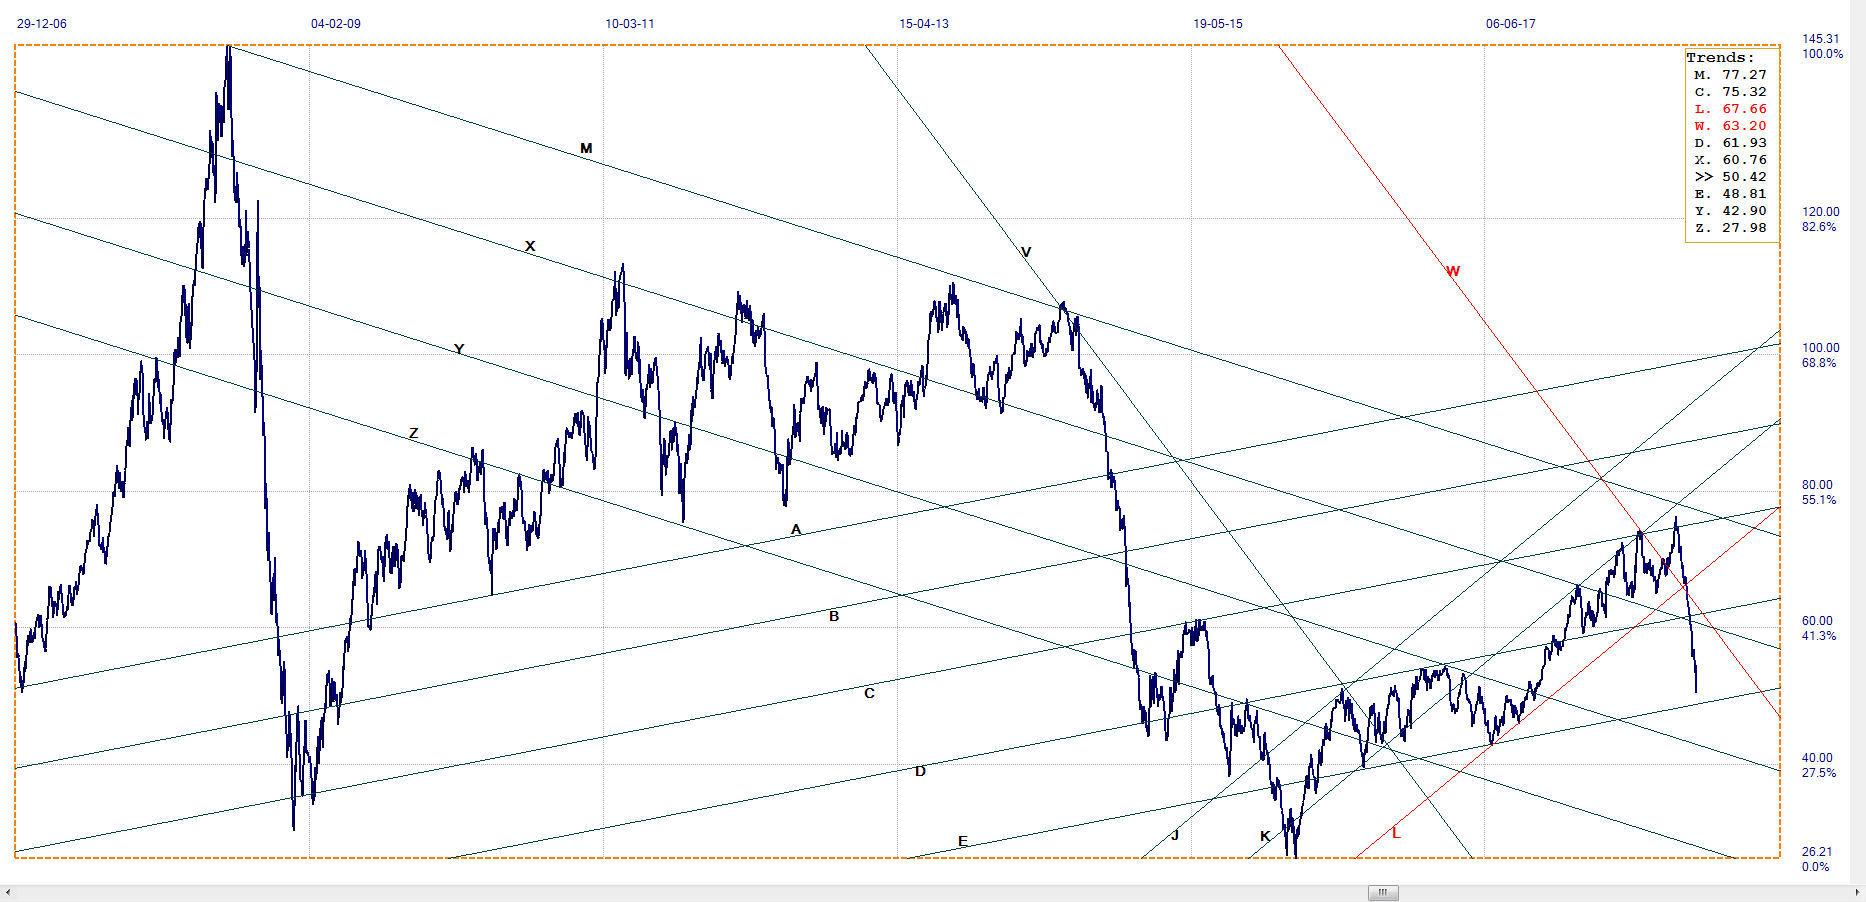
West Texas Intermediate crude. Daily close
The chart is unchanged and the steep almost unbroken decline in the price of crude oil reached almost all of the way to line E ($48.89) before the slide stopped, then started to consolidate around $50.
By normal considerations, such a steep decline soon has to become over-sold. If it has happened now, starting the consolidation, line E should be safe from a strong test and perhaps from any test at all, if the price holds near current levels , probably before moving higher again.
The lower oil price must help to keep inflation in check – even with the Fed wanting at least a little inflation to prompt consumers away from long term investments at unattractive interest rates and decide to rather spend the money. Better to boost the economy now than to have consumers build a stronger nest egg for retirement. Why else do they have Social Security?
WTI crude – Daily close, last = $56.83 (www.investing.com )
©2018 daan joubert, Rights Reserved chartsym (at) gmail(dot)com
*********


