Chart Symmetry
De Beers; Weekly POG; Randgold & Exploration; Durban Deep
Chart Symmetry is designed around the observation that prices tend to change direction along certain preferred gradients. Different preferred gradients are linked though the Fibonacci ratio. When a preferred gradient has been identified and confirmed, it and its derived gradients can be used to search for patterns that help to describe the shape of the chart, which then enable the analyst to anticipate certain developments.
The prices shown for the lines are the values of the lines at the next time interval after the chart close. It is not a prediction that the price will suddenly move to reach that line overnight, but provides the reader a measure of the move that could take place if the price pattern does develop in the direction of that trend line. The steeper the line, the greater will be the change in the line value over time.
Analysis using Chart Symmetry is explained at the hand of the De Beers chart, where the generation of each trend line is explained. The same principles apply to the other charts.
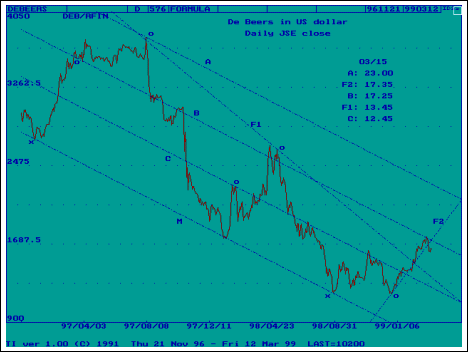
De Beers in US dollar. Daily JSE close. (Last = $16.50)

The master line, M, was the first line to be generated. The software was used to draw line M between the two points marked with an 'x'. Observe the three accurate rebounds off that line, which suggests a preferred gradient. Using the internal values of the chart points, the gradient of line M was calculated and used to generate the rest of the lines.
Lines A, B and C were generated with the same gradient as that of M from the points indicated with an 'o'. They are of course exactly parallel to M. Note that these lines are quite symmetrically spaced. A-M is the current bear channel.
F1 is a steeper trend line. The software was used to calculate its gradient by dividing the gradient of M by the Fibonacci ratio (0.618); line F1 was then generated from the second of the two peaks in mid-98, also shown by an 'o'. Line F2 is the steeper derivative of F1, again calculated using the Fibonacci ratio, and the sign of the gradient was reversed to obtain a rising trend line. This makes F2 the second steeper derived line of master line M.
The dollar chart of De Beers shows the bear channel, A-M, with the wedge, M-F1, as a second major chart formation. Note that the break higher from wedge M-F1 occurred on leg 5, which completes the normal development of a narrowing formation. Line F2 was the support line of the new and quite steep rising trend.
Scenario 1: The break below support along F2 is bearish and De Beers prepares for a move all the way down to support at F1 – with line C as backup support.
Scenario 2: The yield continues rising, but at a shallower gradient than that of F2., to test resistance at line B quite soon and this time breaking higher.
Preference: Resistance at B held last week to result in the break through support at F2. This was contrary to the preferred Scenario of last week and it now imposes a bearish Scenario on De Beers – unless resistance at B can be penetrated, as described in Scenario 1. More likely, though, is a sideways to bearish correction – perhaps even as low as F1 – that lasts while the price remains below line B.
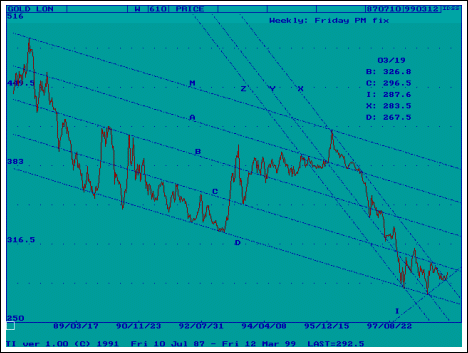
Gold Weekly: Friday PM fix. (Last = $292.50)
This is again the full chart of the weekly analysis shown here some weeks ago. Both the shallow and steep bear channels, M-D and Z-X (all lines derived from the gradient of M), appear on the chart. It can be seen that POG has now definitely broken up out of channel Z-X, after a bounce off the rising trend line I.
Scenario 1: The break from channel Z-X is the beginning of a sustained and quite steep rising trend that soon (a matter of a few weeks) breaks above resistance at line C and then also at the $300 level, to test resistance at line B.
Scenario 2: Gold fails to extend the rising trend. It reverses direction and breaks below support at line I to move downward along line X for a third test of support at line D.

Preference:
Scenario 1. This simply has to be so, given the long battle – since October 2nd – to manage a break upwards from channel Z-X! Line I is the key support now and its value for this Friday is $287.6/oz.
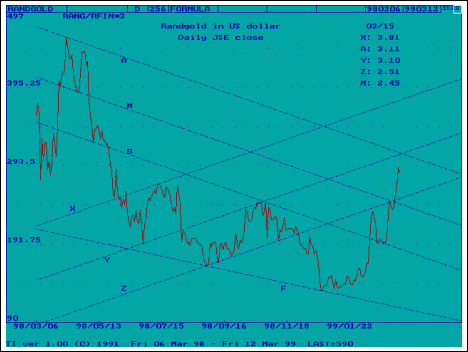
Randgold in US dollar (ADR). JSE close. (Last = $2.56)
With the calculated ADR price now at $2.56, the break upwards though long term resistance on the weekly chart of Randgold – shown here 3 weeks ago, when resistance was at $2.09 and falling – is confirmed This is bullish for the longer term.
The shorter term and more detailed daily chart of the calculated ADR shows a bear channel set A-B and a rising channel, X-Z, which has the same gradient as A-B. Line F is the shallower derivative of M, with B-F a descending wedge of which only 4 legs were completed before the break higher. Pattern X-F is developing as a megaphone.
Scenario 1: The price failed to break above resistance at line Z on the first try and had to return for a goodbye kiss on line B before a new challenge on Z could be made. This was successful. The break took place just a day or so after the cross-over of lines M and Z . Another cross-over lies just ahead at $3.11 and again becomes the location of a break through resistance. Early this week?

Scenario 2: The price is reversing its trend and returns to test support at line Z.
Preference:
The early break from the wedge – before leg 5 – and the presence of the megaphone indicate that the price could be in for a steep and sustained run. Scenario 1 is preferred on this basis.
As a word of caution, it also should be noted that cross-overs can be the location of a sharp trend reversal – not only of a sustained break.
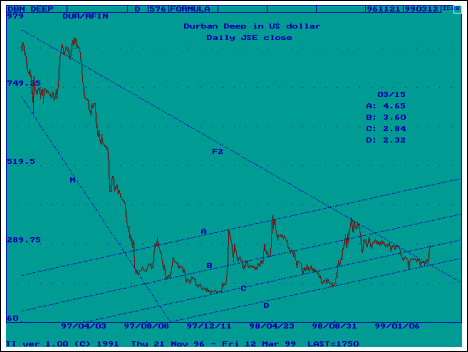
Durban Roodepoort Deep in US dollar. (Last = $2.83)
The daily chart of the dollar price of Durban Deep clearly shows the significant break through line F2, which featured so prominently as long term resistance in analyses shown here over the past few weeks. Previously, the rising channels showed how far the price could move if the greater extent of the new bull channel came into play. This time a closer spaced set of rising lines provide more detail about possible resistance levels.
Scenario 1: Resistance at line C holds and the price reverses trend to return to support at line D.
Scenario 2: The price breaks higher to extend the rising trend to test resistance at line B.

Preference: The break higher from megaphone M-F2, after the price was squeezed right into the corner of F2 and line D, should signal the start of a strong and sustained bull trend. Megaphones are major formations and are not easily penetrated; further, price behaviour within the megaphone and after a break are often volatile. Therefore, Scenario 2 is preferred.
Dow Jones in oz Gold – shown last week.
Despite the record close of the Dow, the Dow-in-oz-of-gold did not break higher from the chart shown last week. The value of the upper boundary of the wedge formation was at 33.92 oz and the highest value reached by the chart last week was on Friday when the Dow was worth 33.76 oz of gold.
Of course, with a successful challenge by the Dow on 10000 points and a weaker gold price, a break higher through the 33.92 barrier could still take place. Unless the gold price also increases to keep the ratio in check. Or if the Dow's challenge on 10000 points fails.


