Debt…Hydra Of The Financial System
 share
share
 share
share
 share
share
 share
share
 share
share
Hydra in Greek mythology is a many-headed water serpent. To kill it was one of the 12 tasks Herakles had to complete. He had quite a job to do, since when one of its 9 heads were chopped off, two would grow in its place. In addition, one of its heads was immortal to make the job even more difficult. Today, debt is like a Hydra. Debt raises its head to be a threat in many places and at the centre there is the immortal Federal Reserve that sees to it conditions are maintained right to keep the serpent healthy. Unfortunately Herakles is long gone and the beast now has free rein.
Way back in 1999 I happened to explore various statistics available from the FRED database at the St. Louis Fed. One of the results to catch my attention at the time was the chart below, which shows the disparity in the growth of personal spending relative to the growth in disposable personal income since the late 1950s.
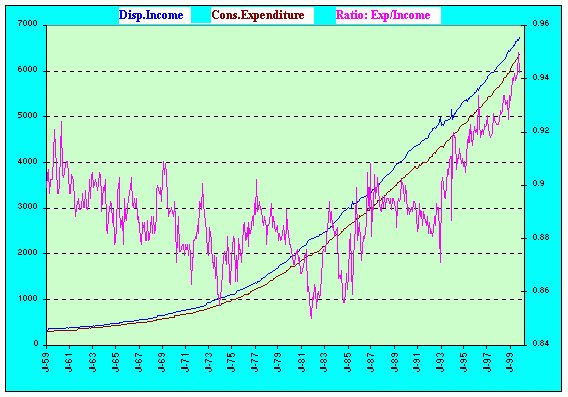
It seemed to me at the time that the trend since the early 1980s when the Reagan administration set the example at the Federal level that ‘making debt was good’ for households to follow was unsustainable. By 1999 the trend was steepening and it was clear unless the trend leveled off and hopefully reversed, a time would come when the trend will be compelled by the inability to obtain further credit to reverse.
Expenditure/Income - 1999
It took almost another decade for the circumstances of which the trend in the chart had warned to become a crisis. Yet experts who afterwards had to diagnose why the developing crisis was not detected in time concluded that it had sneaked up on them from below the radar. Well, they had to say that, didn’t they?
One would think that as a rational people the lessons of the 2007/8 crisis and why it had developed would be taken to heart and that definite steps would have been taken afterwards to make sure no similar debt driven crisis would develop again. OK, so the real trigger was a mortgage mess and not too steeply rising debt per se, but the problem with the mortgages was simply a logical result of the ‘debt is good’ mentality of the previous three decades and that is the nature of the real problem to be resolved if no similar crisis is to evolve in future.
A measure of how well the lessons of 2007/8 were learnt is to look at how Federal debt has changed since the crisis. In Q3 of 2007 the national debt was exactly $9 trillion and just 10 years later in Q3 of 2017 it had risen to $20.24 trillion (125%!). A projection by the CBO has the national debt optimistically at $30 trillion by 2027 – but done before Trump had taken office.
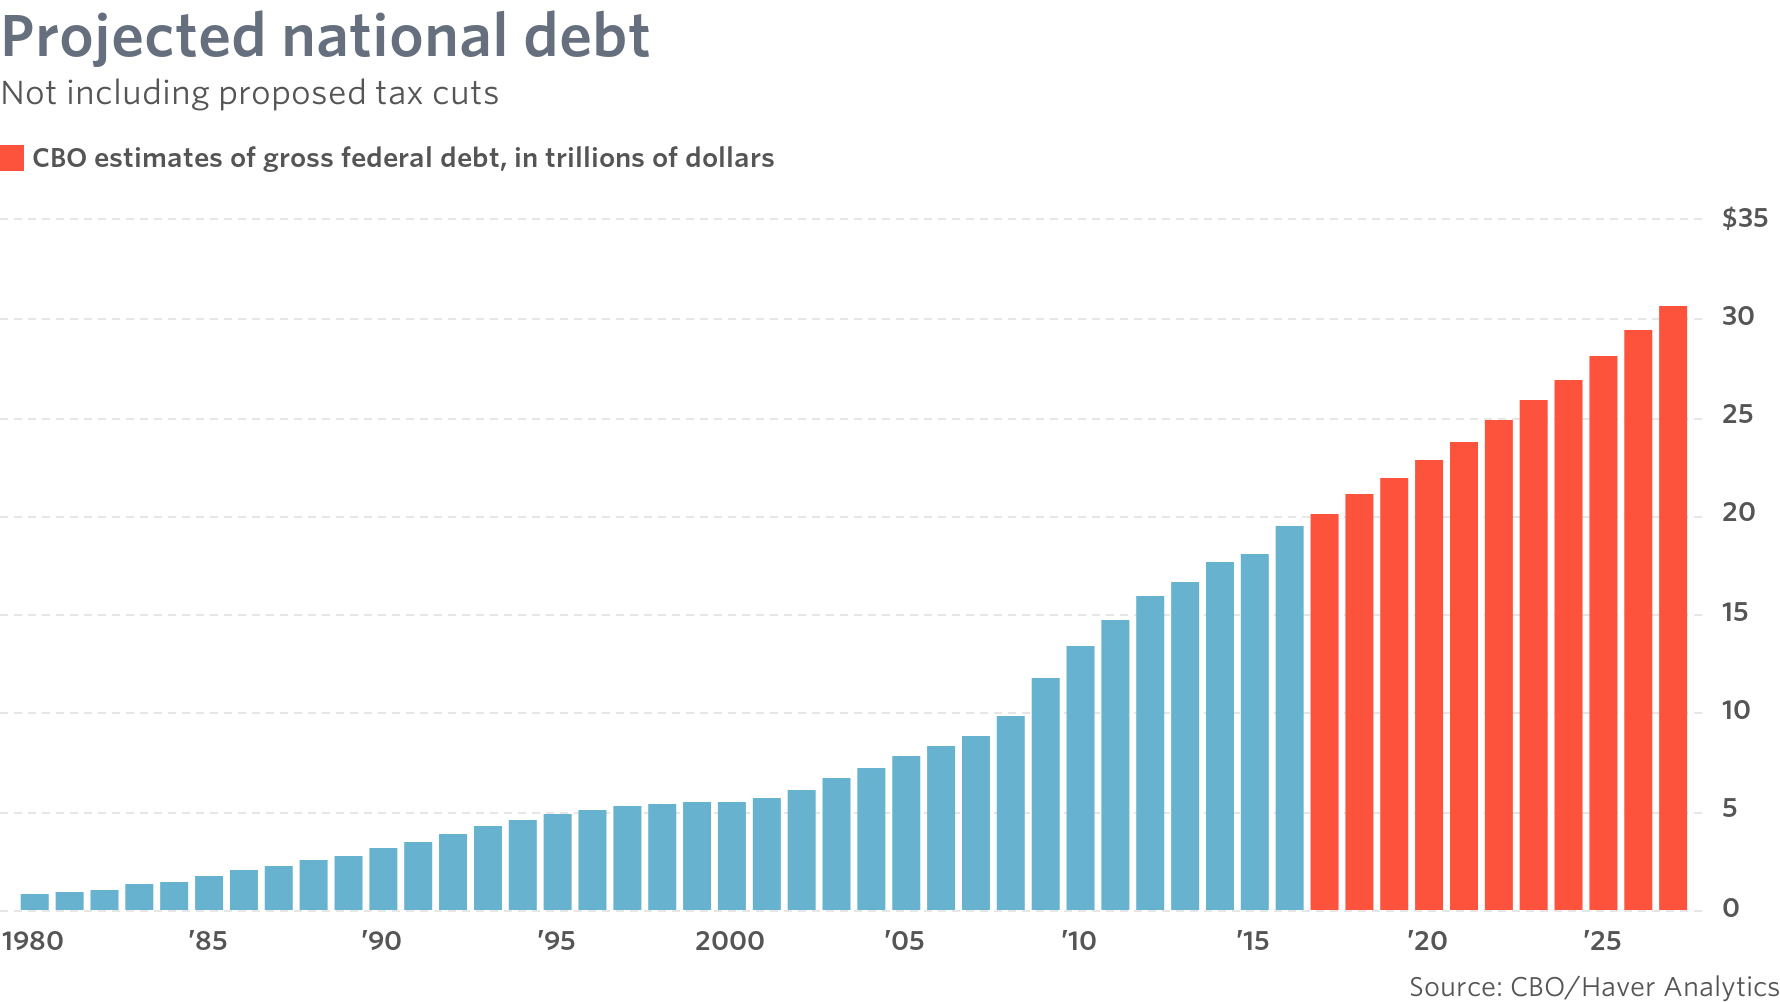
It would thus seem that at national level a disregard for the risks posed by too much debt is prevalent, or, perhaps adding more debt has achieved too much momentum to be able to reverse the trend.
In a modern economy, consumer spending is the decisive driving force over time. Even though it required almost a decade after 1999 to develop, a worsening trend at that time in the ratio of income to spending was an early warning of a problem in the making. Even if the government finds it impossible for various reasons to limit the growth in the national debt, let alone begin to repay it, one may have assumed that consumers after suffering through 2007/8 and its aftermath would have learnt their lesson and worked at reducing their load of debt.
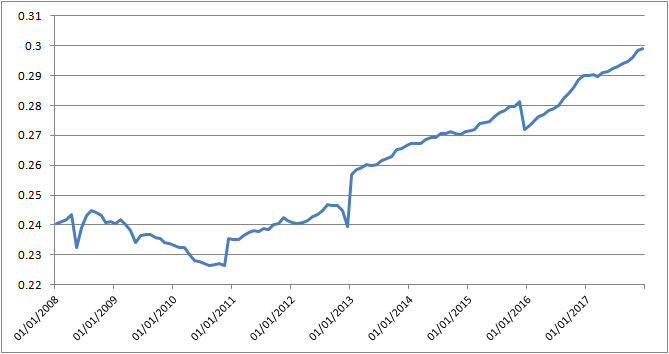
The 1999 chart showed the change in spending relative to income. This recent chart of consumer debt to income since 2008 shows the increase in debt is still outpacing improvement in income.
The conclusion reached in 1996 is still valid today: if this trend does not level off and reverse, a crisis that is likely to be more severe than in 2007/8 is due to happen in the not too distant future.
Total Consumer Debt / Real Disposable Income
The chart shows initially after 2008 the growth in debt declined relative to income, but since 2013 the steep trend in the ratio has returned to lift the ratio during only the past 4 years by 25%. Herb Stein’s Law has it that if a trend cannot be sustained indefinitely it will stop. Include the national debt and this Law clearly applies.
There is only one question and it has no easy answer– when will it stop? It doubtful whether the Fed can step up to the plate again as it had done in early 2009 when multi trillions of dollars were ‘printed’ and distributed to save the financial system from imploding. Failing mortgages get the blame for that crisis, but the real reason is that too many consumers were no longer able to carry the load of their debt. This trend shows that it will be the main underlying reason again when the next crisis erupts, as it will unless this trend somehow can be reversed.
This time around, as seems set to happen, it will not be only the US giving a shock to the rest of the world. This time around debt has no borders and the cataclysm is expected to erupt in most other countries as well. This time around the many heads of the debt Hydra span the globe with the big one swallowing the US.
The Federal debt is over $20 trillion which equates to exceeding $60 000 per capita, while consumer debt is more than $13 trillion, adding another $40 000 at least to each capita, including mortgages. That implies that on average a family of four is responsible for servicing and repaying more than $400 000 of debt. At say a rate of interest of 4% on average, that is $16 000 per year for each such household that is spent but adds nothing material to the wealth of the country.
That debt will NOT be paid back in the working lives of the people who currently are employed. It will be a burden on their children and perhaps their children’s children, given that the trends discussed here will not change until the new and bigger crisis arrives. After which (much of) the debt might be written off by necessity, but the US most likely will be a financial wasteland.
The pressure on the precious metals is unrelenting and gold longs are reacting by deserting the market. Silver bulls are (as yet) much more firm in their resolve and are holding on, keeping the open interest in the vicinity of 200k contracts. Reports have it that Comex is calling on the LBMA for help at a much higher rate, which, if it are due to a lack of supply in the US, warns that their time to suppress the price is running out.
Crude oil and the yield on the US 10-year are both volatile and a little softer as if digesting the recent hike in the price and yield. The dollar is sideways to firmer.
Euro-Dollar
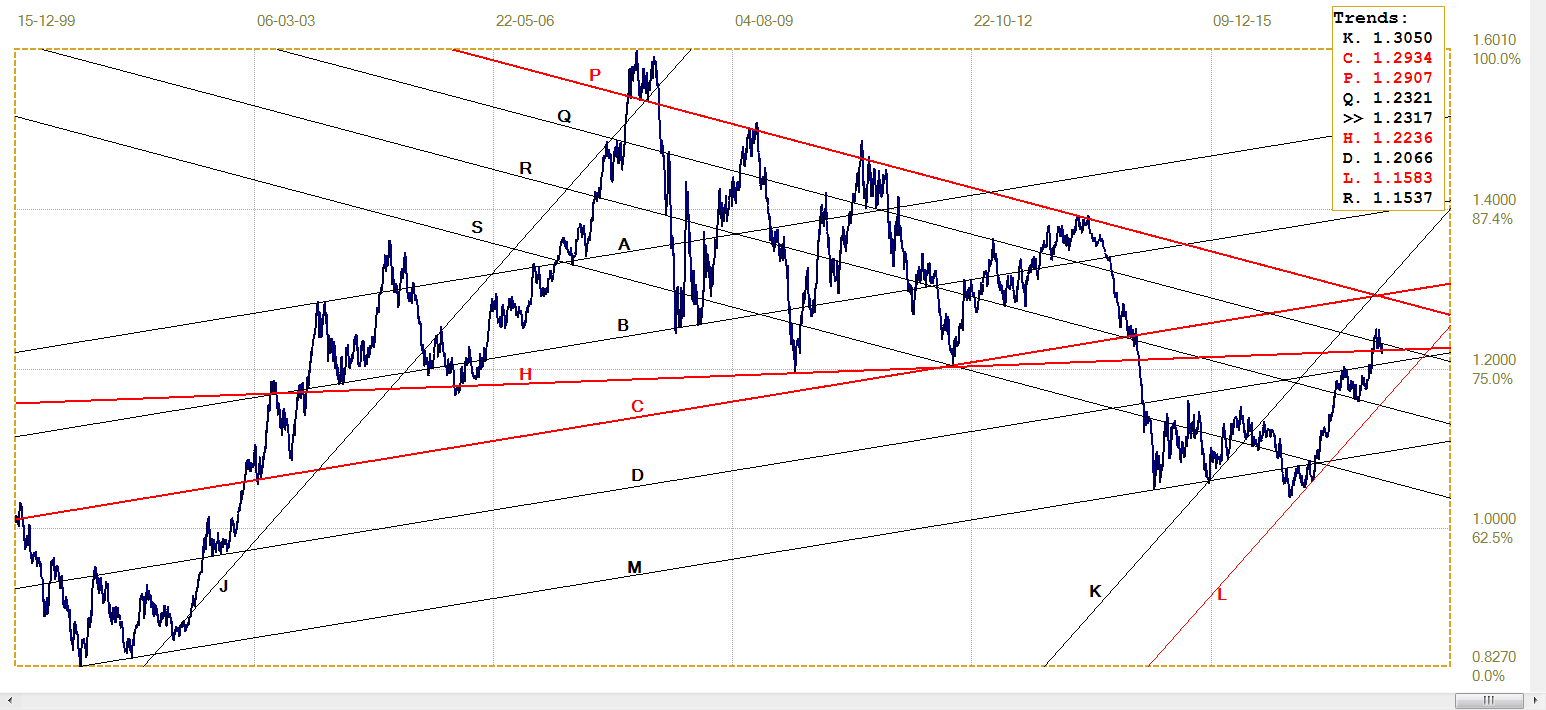
Euro-dollar, last = $1.2317 (www.investing.com)
Last week the dollar started on a firm note and pushed the euro lower to test and even briefly break below the horizontal support of line H ($1.2236), but by the end of the week the euro had recovered from that break lower and close the week with a test of the nearby resistance at line Q.
The outlook for the euro is marginally bullish after the recovery from below line H, but this has to be confirmed with a break higher above line Q. That should then be followed by a move higher than the recent top in the currency.
DJIA
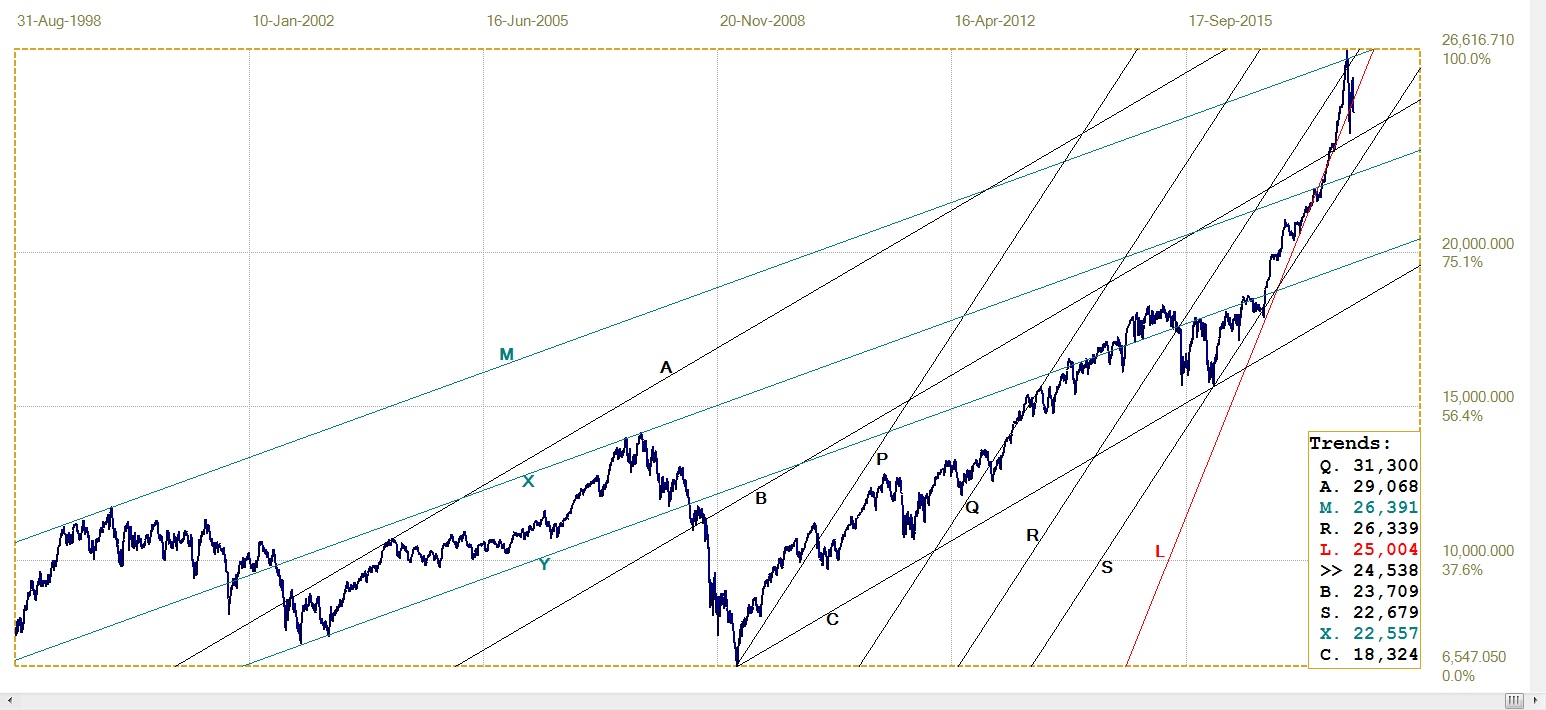
DJIA, Last = 24538.06 (money.cnn.com)
Wall Street has become very volatile over the past month, with 300+ rallies on one day being followed by similar steep falls a day later. The DJIA closed the week on a day of weakness and early on hit a triple bottom close to 24 200, nearly 400 points down on the day. The bounce off the third low started a very volatile rally that see-sawed up and down to end the day still 70 points in the red.
The intra-day volume still shows high spikes whenever the price falls too much as an effort is put in to begin a recovery. This is very noticeable near the end of the trading day when sellers who have held back during the day rush in to clear their books before the close. The close was again well below the steep support of line L (25 004); it would not surprise this week to again see strong attempts to regain the upwards momentum.
It was previously mentioned that Dave from Denver gad presented some evidence that the Fed could be involved in this propping up of the stock market, but pension funds that will be in severe trouble if the stock market falls could also be applying whatever funds they can muster to keep the market afloat.
Gold PM Fix - Dollars
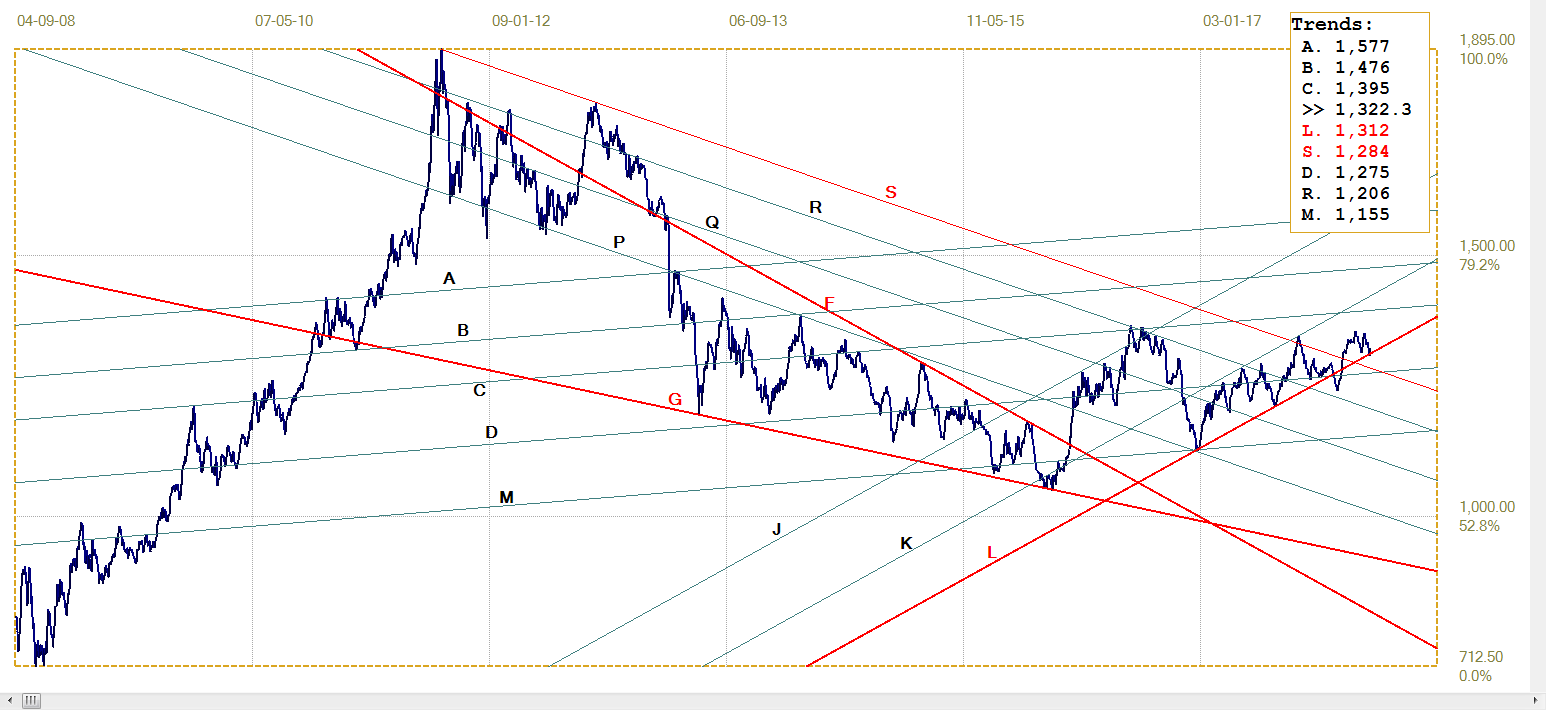
Gold price – London PM fix, last = $1322.30 (www.kitco.com )
Recent severe pressure on the price of gold continue last week, with a bit of a let-up late on Friday. This week on Friday the NonFarm Payroll number is due and that traditionally has been when the price of gold got clobbered. Last week the price had tested support at the bottom of bull channel KL ($1312), but it has mostly held so far at least.
Hope for the market is still focused on the premise that supply of gold to support the suppression scheme is running low, supported by news that Comex presumably is relying on the LBMA to make up a shortfall. After almost 7 years of suppression following the 2011 high in the price, it will be ever more frustrating if one waits for that event day after day or even week after week. Perhaps to wait for a new month to pass will be less frustrating, but even that can get old as time passes.
Euro-Gold PM Fix
The euro price of gold is still battling to hold clear of support along lines C (€1070) and Z (€1068) where it has stagnated for quite a long time. Weakness in the price of gold last week and with rand trying to hold its gains against the euro combined to keep the euro price of gold to settle sideways above the support of line C.
The price has to recover above line T €1102) before gold bulls can heave a sigh of relief that investors in Europe will be looking at a more positive future for gold.
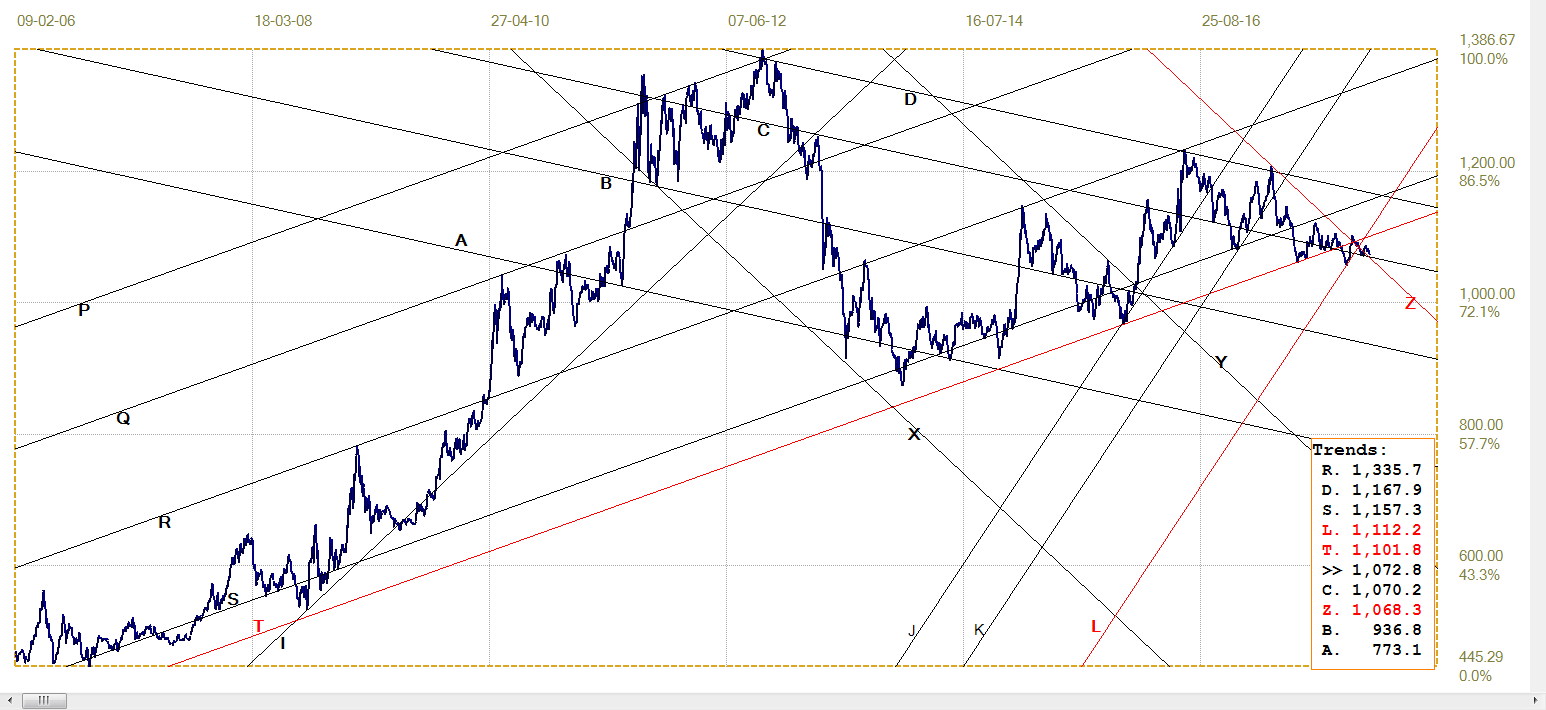
Euro Gold Price – PM Fix In Euro, Last = €1072.8 (www.kitco.com)
Silver Daily London Fix
Silver Daily London Fix, Last = $16.445 (www.kitco.com)
Last week the gap between the price of silver in Shanghai and what it is on Comex and the LBMA in London, closed a little by the end last week from the week before. Then the gap was $1.29 (7.8%) and it is now $1.24 – still on the high side, but it is no longer as deep into the ‘caution’ range on www.didthesystemcollapse.com
The consistency of the Shanghai premium over Comex and the LBMA over time can only be explained by strong demand for the metal which finds many uses in many kinds of industries, including the micro-electronics that is essential for cell phones and the many other application in miniaturised consumer and military electronics. It must be a time bomb for the banks and others so short of silver because demand is growing while production is mostly limited to the production volumes of mines of base metals where silver is only a by-product.
U.S. 10-Year Treasury Note
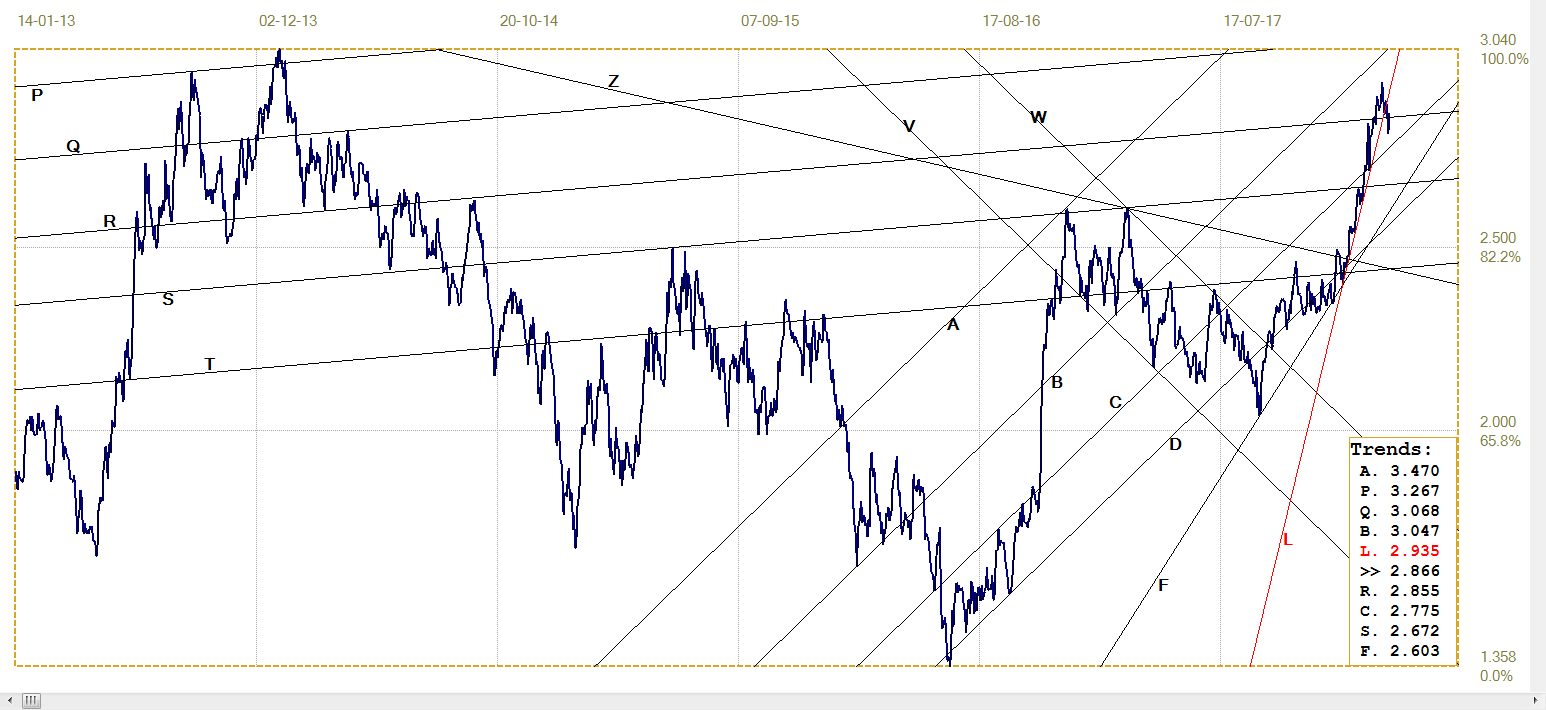
U.S. 10-Year Treasury Note, Last = 2.866% (www.investing.com )
The recent steep fall in the yield of the US 10-year Treasury broke below the very steep trend line L (2.935%), but the bond rally soon ran out of steam and the yield started to move higher again. A new break above line R (2.855%) has introduced a bearish bias again, but the yield has to extend higher, perhaps even break to above line L again, to confirm that the medium term and quite steep bear trend is intact.
If the Fed’s promise of a further rate hike soon, perhaps even at the FOMC meeting this month, becomes fact, it can be expected that the yield will continue higher and do so despite possible attempts to rein the bear trend in.
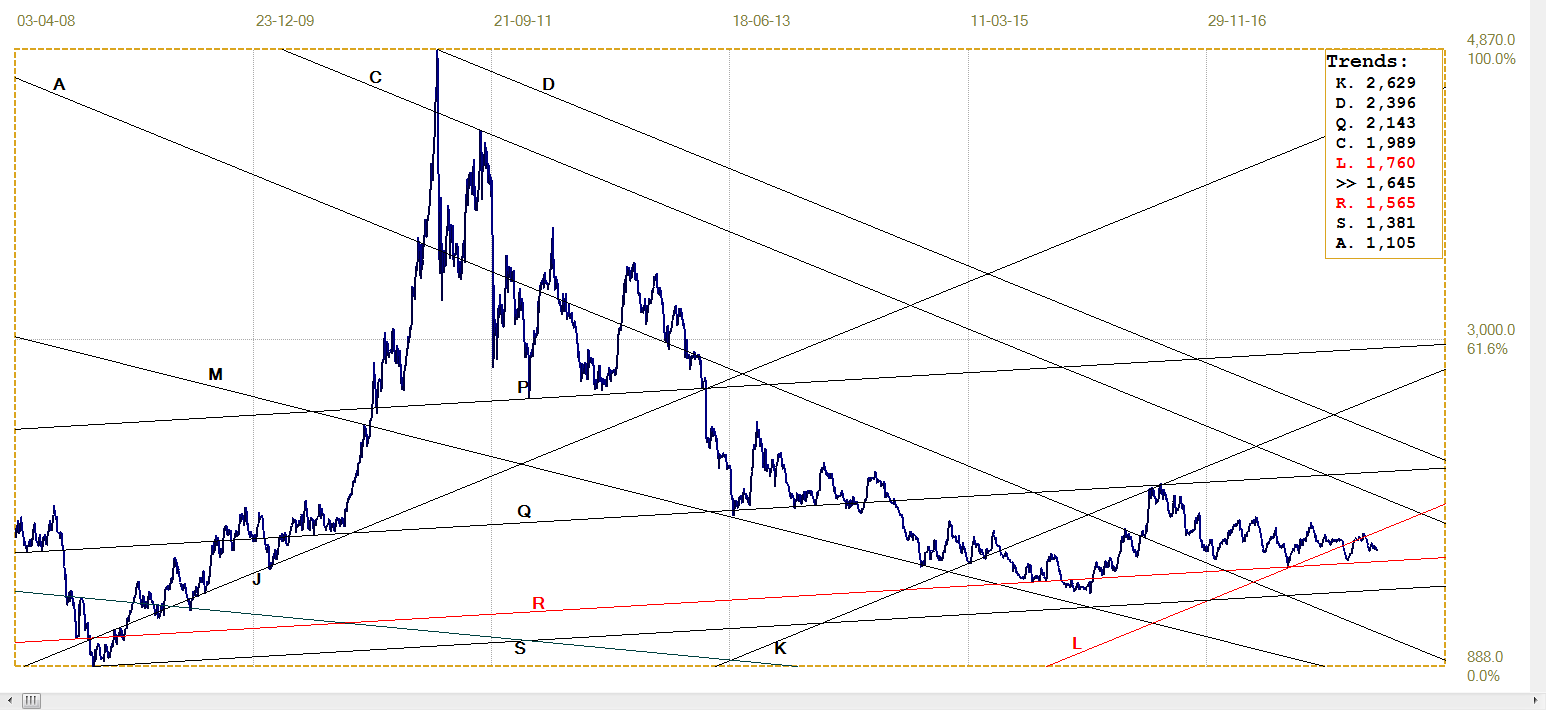
West Texas Intermediate Crude. Daily Close
The recent rally in the price of crude at first looked as if it would continue higher, but then failed to close in on the next resistance at line B ($68.44), turning around to break back below the support of line R ($61.96), where it still sits. The recent volatile swings might indicate another sideways shuffling in the price for the near term at least until greater clarity about the trend in demand and supply is obtained.
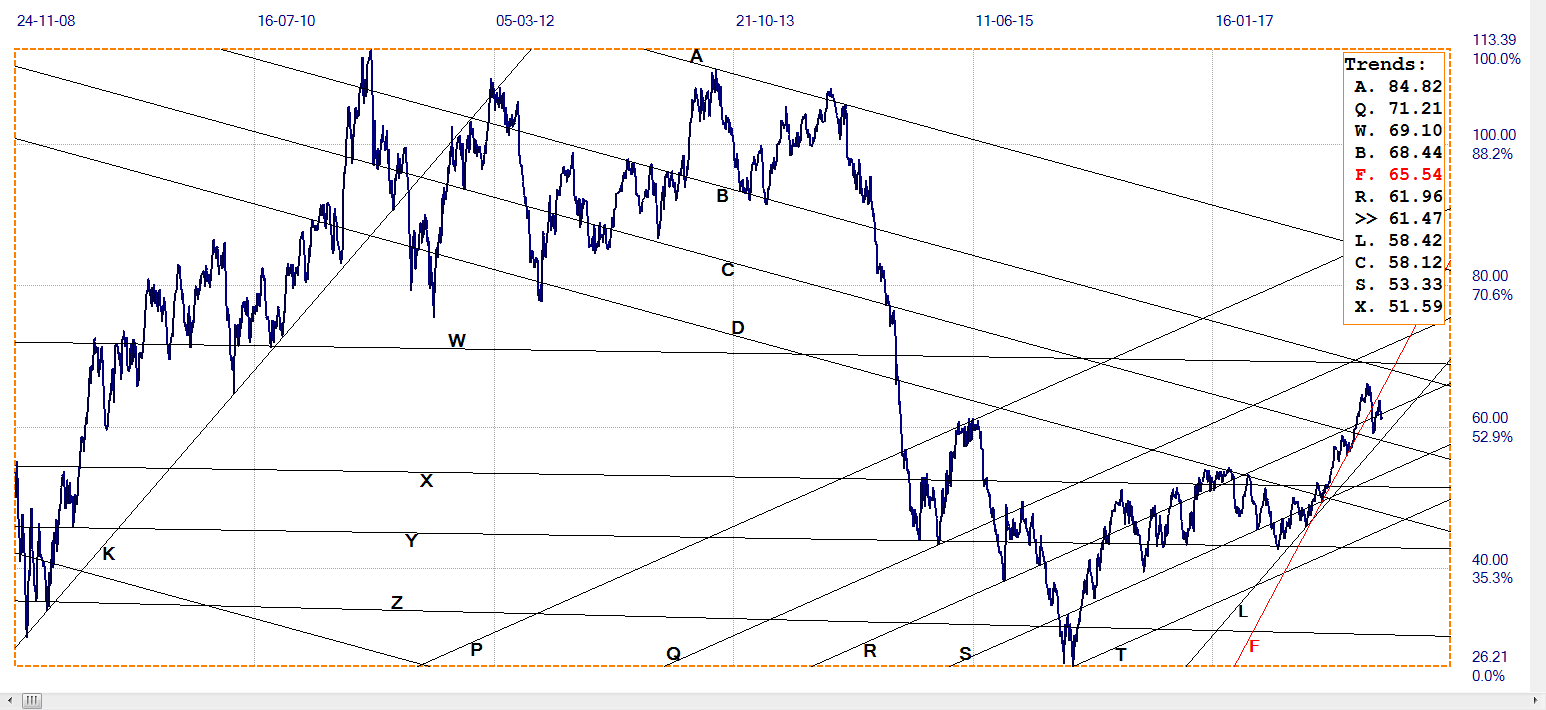
WTI Crude – Daily Close, Last = $61.96 (www.investing.com )
¬2018 daan joubert, Rights Reserved chartsym (at) gmail(dot)com
*********
share
share
share
share
share
More from Gold-Eagle


