DJIA For 18000 – Or A Bit Tired?


October has come to an end…and it has not experienced the kind of event for which the month had become well-known, if not quite famous, over the decades. Stocks did have their ups and downs during the month, but the latter was infrequent and brief and limited. The ups were dominant and the DJIA had one of its best months in a long time. Not a surprise at all, as it was quite clear since the round off 16 000 that a decision had been made somewhere that the DJIA at 18 000 would make for a festive Christmas season. Recently, the surges have become smaller and it seems that Wall Street could be getting a bit tired. Intra-day volatility is up, as if the tug of war between bulls and the bears are firming up. Since the DJIA has become the de facto weathervane for the economy, this bears watching. A reversal lower could be a warning that the tight grip on all the markets might be slipping.
Stronger Wall Street, a firmer dollar and yields on the 10-year Treasury note were all trends known to find favour with TPTB; officially these are ‘good’ trends as they make optimistic opinions and news about the economy believable for people with no specialised insight or knowledge. Optimism about the economy is a mindset that promotes consumer spending, something that is high on the national priority list. It unfortunately removes the focus of attention from traditional safe havens such as gold or silver.
However, for much of the month, the prices of the metals were mostly range bound near their higher levels, following the initial rebound off their long term bear trends. Volatility was quite high, but dips were bought most of the time, showing promise – until Wall Street slowed down, the dollar shows some weakness and yields started to drift higher. These market changes were not to the advantage of gold and silver; it would have been surprising if multiple raids did not happens to reveal the degree of concern that rising previous metal prices could ‘spook the herd’ in warning that something is wrong in the economy!
Which of course it is, but as Barbara Tuchman describes in her “The March of Folly”, officialdom will stick to a failing policy through thick and thin – until the inevitable happens and they all act surprised and seek scapegoats elsewhere. History seems likely to repeat itself.
Euro-Dollar Chart
The rising trend of the euro, off the support at the bottom of channel AD ($1.0645), came to an abrupt about turn once the other markets, as discussed above, started to behave in a manner that was no longer seen as positive. A steep decline saw the euro breaking below bull channel KL ($1.1125), extending the move lower that had challenged the support late last week.
Unless the euro can recover soon, without extending the trend lower, it seems that the support at line D will be tested again. Such weakness may well be reflected in some other markets.
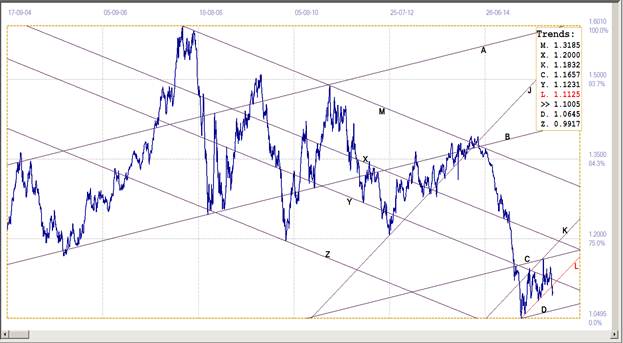
Euro-dollar, last = $1.1005 (www.investing.com)
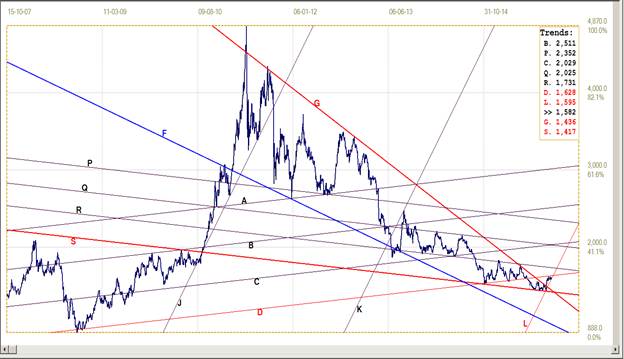
Dow Jones Industrial Average (DJIA)
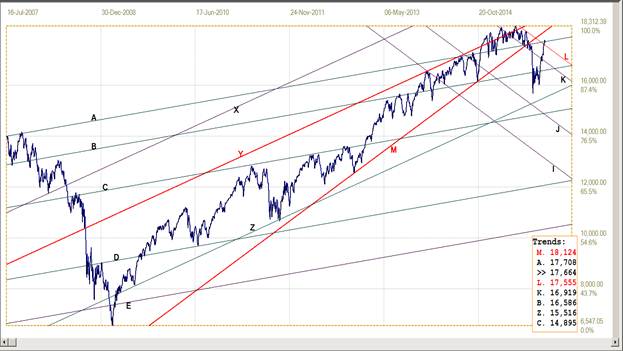
Dow Jones Industrial Index, last = 17664 (money.cnn.com)
Following the recent shake out on Wall Street, the DJIA spent time consolidating; it was necessary to bring the stock market under stable control. This was a period of immediately countering any threatening sell-off with a burst of options buying that triggered strong demand on the market it self as sellers of options put on hedges.
This of course triggered more buying and a greater commitment to a bullish Wall Street. Now with the DJIA having just failed to hold the break above line A (17708), but holding the break above bear channel KL (17555), the direction of a new move will be easy to spot.
Gold PM fix - Dollars
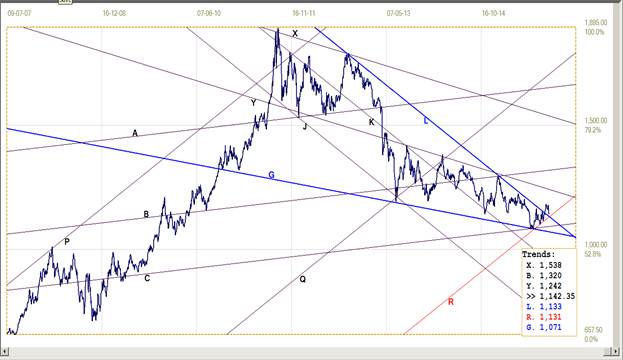
Gold price – London PM fix, last = $1142.35 (www.kitco.com)
The break higher from the large pennant GL ($1133) is still intact despite renewed and sustained selling of futures on Comex. Key support is at line R (1131), which is not all that far below the new consolidation range, but it has not been tested since the break above the pennant GL. The technical new bull market is still tentative; a good move higher is needed to reduce fear of what the forces that intervene in the markets might do to the metals.
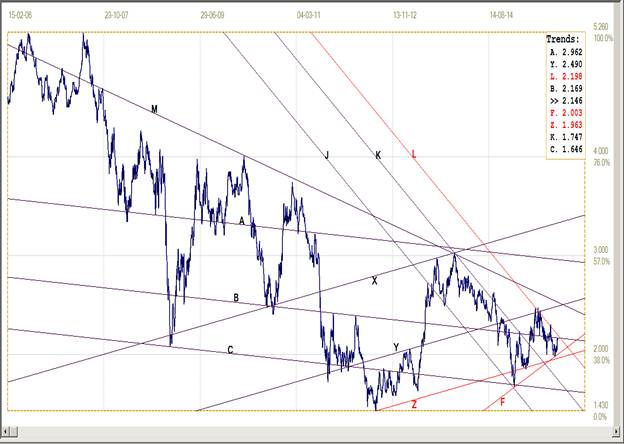
Gold PM fix - Euro
The renewed weakness in the euro has helped boost the euro price of gold to a new recent high, just enough to challenge resistance at line X (€1058). Previously, line X behaved as strong resistance and as firm support; this implies a break higher will not happen without solid force behind the gold price or further collapse of the euro. In fact, it would not be a positive sign if the break happens on a weak euro; better by far if both gold and he euro are firm, with gold rising the much faster of the two.
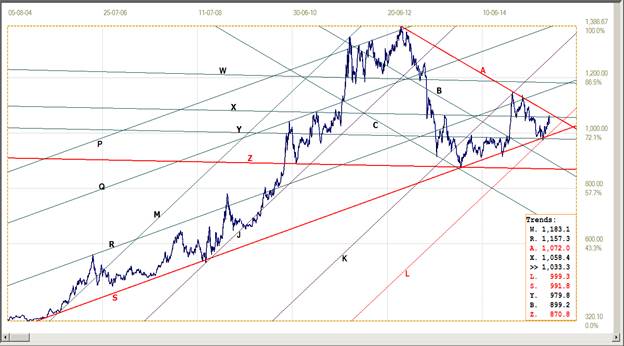
Euro gold price – PM fix in Euro, last = €1033.3 (www.kitco.com)
Silver Daily Fix Chart
Silver daily fix, last = $15.82 (www.kitco.com)
Given the way the silver price has behaved for quite some time now – with sudden moves of limited extend and duration only to settle then in a tight sideways band for a week or two – it is no surprise the break higher from pennant GS ($14.36) is still caught in a new and tight consolidation. The price was consolidating in the tight range between line D ($16.28) and rising support of channel KL ($15.95), with the silver price now breaking marginally below line L.
A recovery this week back into channel KL is important for the near term prospects for silver. While the break above pennant GS is a longer term bullish signal, it will be a near term negative if he price holds the break below channel KL.
U.S. 10-year Treasury Note
The yield on the 10-year US Treasury note remains above market resistance along line F (2.003%), which is now higher than the psychological 2% level. Weakness late last week had the yield challenging market support at line B (2.169%), but the support has held – so far. There is still room to move sideways between support at line L (2.198%) and resistance at line F; this seems to be the likely range for the 10-year for the near term.
U.S. 10-year Treasury note, last = 2.146% (www.investing.com)
West Texas Intermediate crude. Daily close
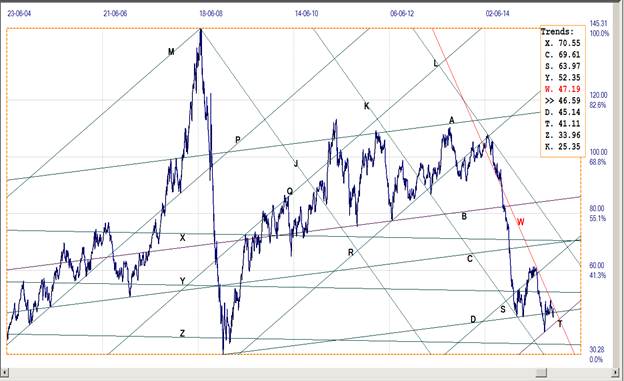
West Texas Intermediate – Daily close, last = $46.59
Recently, the price spent quite some time sitting on support from line D ($45.14) in a tight sideways trend. This was followed by a brief jump in optimism that had the price challenging resistance at line W ($47.19), but failing to break higher.
The rebound off the resistance had the price briefly below line D, but this break did not hold or extend; the recovery back into familiar territory above line D, has the price ending last week just short of the steeply descending line L. A break through line L to extend the mostly sideways trend, holding above line D and below line Y ($52.35) would not surprise.
©2015 daan joubert, Rights Reserved chartsym (at) gmail(dot)com
More from Gold-Eagle


