The Dow and 13000 aren't Married Just Yet


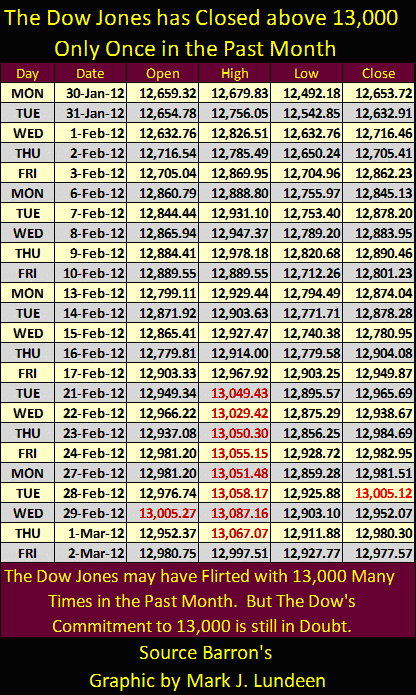
There can be no doubt that the stock market is moving on to a new phase in its bull market. No kidding, that's all that CNBC talked about this week. We've certainly seen the Dow flirting with 13,000 over the past month, but we don't know for sure whether it is contemplating marriage to it as the market moves into March. Look at the daily trading for the past month in the table below. Yes, on February 28, the Dow Jones did kiss 13000 at the close, but only with a little $5.12 peck on the cheek. Well, as of the close on February 28, $5.12 didn't buy much at MacDonald's, and to my way of thinking it buys even less in the stock market. Then today, Friday, for the first time since February 21 (nine trading days) the Dow couldn't make the effort to break 13000 at any time during the trading session.
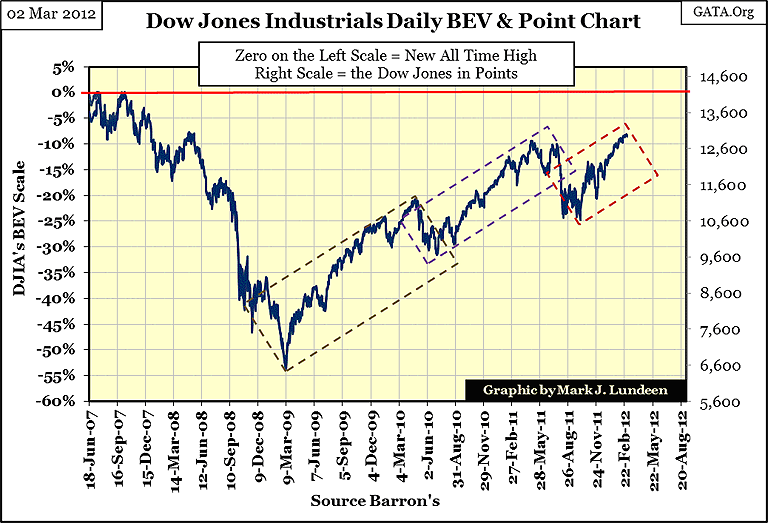
Now, anything can happen in the market, so maybe starting next week, or this month, we'll see a series of big daily gains in the Dow Jones, and then again, maybe not. A big problem the bulls have is that they seem pooped after their 22%, 2350 point, five month gain: see my next chart. Well, who am I to talk, I'm out of shape too. But we are talking money here, so don't bet money on me in a foot race unless I lose some weight, or on the Dow Jones in the coming months unless it can break above 13,000 with some authority. I'm not saying this as a recommendation for stocks; think of me as a spectator sitting high up in the financial markets' peanut gallery, and for good reason.
Since the Dow's difficulties of last August and September, it has gone up, but in my opinion, with less enthusiasm than a raging bull should have. In the chart below, look at what has happened inside the three squares I've placed over the Dow since its bottom of March 2009. It has seen three advances and two corrections, and I can't really say with certainty whether the current advance in the red box has terminated. But using what the market has shown us in the first week of March 2012, since March 2009 each advance has been weaker in terms of duration and magnitude than the one before it, with the second correction being stronger than the first. Sometime in the near future we'll be seeing a correction in the current run-up in the Dow (Red Box). Should it decline below its lows of October, it might just keep going down.
The one thing the stock market has going for it is that this is an election year! Maybe next week Doctor Bernanke will run up behind this tired old bull, and "inject" grand pa with a big shot of "liquidity." He'd better, because technically it will look really badshould the Dow fail for the third time since last May to get above, and stay above its BEV -10% line, at 12,750.
A frequent complaint one hears about using the Dow Jones to measure the performance of the stock market is that it includes only thirty very large blue-chip stocks. I can't argue with that, so let's take a look at the NYSE Composite Index, a market metric that includes every stock trading on the NYSE. From the bull's perspective, the NYSE Composite Index looks even worse than the Dow Jones Industrials.
Since its lows of March 2009, the NYSE Composite failed to break above its BEV -15% line (last April). Then, since its lows of last October, it advanced only 15 BEV points. Meanwhile the Dow has broken above its BEV -10% line while the NYSE Composite is still below its BEV -20% line. So maybe the old point that the Dow Jones is not representative of the overall stock market is valid!
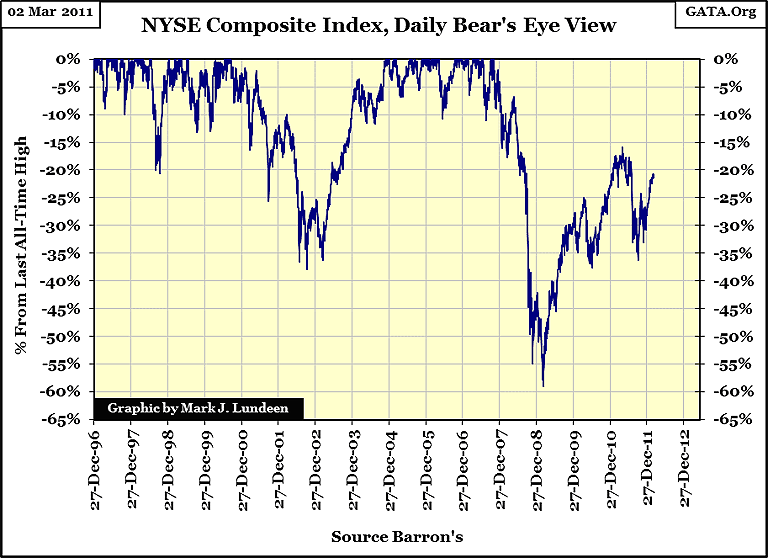
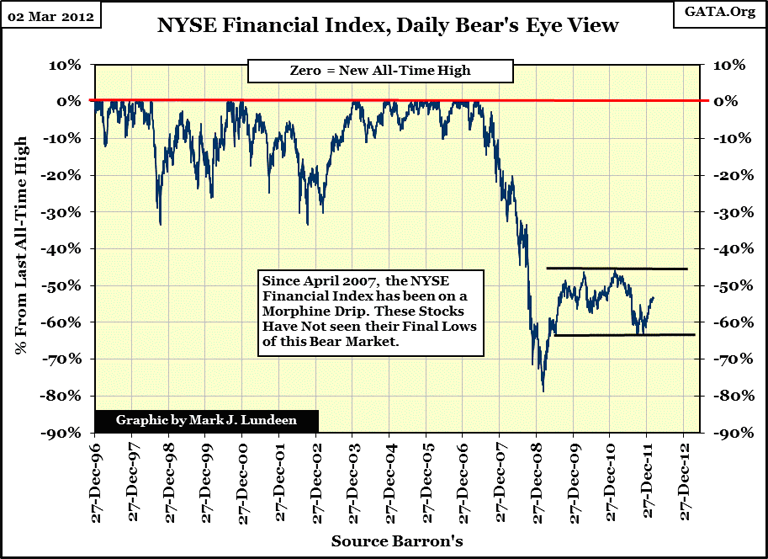
But the NYSE Composite Index doesn't really look all that bad. Since its 59% decline in March 2009, it has made good progress moving up to a new all-time high during the past three years. What looks horrible is the NYSE Financial Index, and one should not underestimate the significance of seeing the Financials doing so poorly. During their collapse of 2007-09, these former-glamor stocks took down every other market sector in the Dow Jones Total Market Group (DJTMG).
So what is the problem with the NYSE's financial stocks? They have ethical problems! I can't really call them criminal enterprises as our Congress has legalized theft; but there is something unseemly happening in the dark and murky world of OTC derivatives(see table #19 in the link).
This is a huge $707.5 trillion dollar (notional value) market. What in the heck does that mean? Well for example, take a single contract for corn in the futures market; it contains 5,000 bushels of corn, with two counter-parties betting against each other on the future price of corn. Let's say that corn is going for $6 a bushel, that would make the corn contract's Notional Value worth $30,000, (5000 bushels X $6 a bushel = $30,000). The short side believes that corn is going down to $5 a bushel. If the short is correct, this one dollar decline in the price of corn would cost the long side $5000, for the short's profit. The long side expects the price of corn to rise to $7, which would cost the short side $5,000. BUT, if the price of corn stayed at $6, neither the long or short side of the contract makes money on this $30,000 contract, and no transfer of funds from one counterparty to the other occur unless the price of corn moves up or down. But both counterparties owe their brokers commissions for access to the corn market. So don't think of this $707.5 Trillion as real money, but rather as a basis, like the single contract of corn, that may or may not make or lose money for someone.
Even so, a $707.5 TRILLION dollar notional dollar market still represents a massive amount of risk to the economy, as a 1% swing in the notional value would result in a transfer of wealth of $7.07 trillion dollars from one party to the other. What's stopping this from happening? I suspect this is where market manipulation by governments, central banks, and large financial institutions comes in. For this scam to work, it's absolutely essential that bonanza paydays and total bankruptcies don't occur among the banking systems' clients in this market. The intent of this scam is to keep the suckers playing this $707 trillion dollar "risk game", paying commissions to Wall Street banks in the process. And what risks are being hedged? Risks that didn't exist when the US dollar was fixed at $35 an ounce of gold:
- Interest rate risks
- Currency exchange risks
- Volatility risks
This is why "market stability" is such a concern for today's leaders of government and their central bankers. It takes a move of only a few hundred basis points in some debt markets (100 Basis Points = 1%) to convert a few tens of trillions of notional value into a nightmare reality of real money! Doctor Bernanke claims he is lowering interest rates for the benefit of new home purchasers, or to stimulate the economy, but I find that hard to believe. I think he has two main motives in driving long term rates down.
- First: Illiquid US mortgages are still a major reserve asset in the world's pension funds, insurance companies, and commercial banks. Lower long term rates will allow these worthless assets to be priced at higher fantasy valuations.
- Second: The big NY Banks sold trillions of dollars in Credit Default Swaps (CDS), making them effective Longs in the bond and mortgage markets, and like the longs in the corn example above, lowering long-term interest rates increases the values of the bonds the big banks guaranteed against default.
Remember, it was the loss of "stability" in the US mortgage market that caused the 2007-09 credit crisis; garbage US sub-prime mortgages were transformed into AAA rated paper by bundling these contracts with Credit Default Swaps from the OTC derivative market. These financial "AAA assets" were then sold to pension funds and insurance companies worldwide as investments. None of the underwriters of the sub-prime mortgage credit default swaps maintained sufficient reserves to make good their potential liabilities, as everyone assumed that US mortgages were guaranteed by the US government. So as long as the "policy makers maintained stability" in the mortgage market, the big banks continued to rake in the big bucks selling worthless CDS's in this multi-trillion dollar market. However, beginning in 2007, the mortgage market began to crumble as US mortgages proved to be as worthless to their owners as were the CDS's that guaranteed them. At one point, the Fed had to inject trillions of dollars of liquidity into the global banking system to keep it afloat.
This is the same situation we now find the Greek sovereign debt market in, but Wall Street has learned much since the credit crisis of 2008: that honesty isn't much of a policy when pending losses in the OTC derivative market number in the tens of trillions of dollars. As predicted by James Sinclair a month ago, the International Swaps and Derivatives Association (ISDA), a creature of Wall Street, and judge of what is, and what is not a "credit event" in the OTC derivative market, ruled this week that the big banks who sold Greek bond holders CDS's to hedge their default risks could legally renege on their obligations to clients.
It's a slick trick to be sure, but one that will have real consequences in the future. For decades, fixed income assets (Bonds) have been grossly overvalued in the international bond markets, by artificially lowering interest rates with fraudulent derivatives contracts that are now proving to be unable to perform as promised.
If the OTC derivative market failed to hedge risks associated with the tiny Greek sovereign debt market, what about the Italian debt market, or California and Illinois municipal bonds? At some future, but unknown point in time, bond buyers will once again value bonds on their debtors own merits, independent of false assurances from Wall Street's derivatives salesmen. The coming impact of re-valuing the global bond markets will be a historic event, one that will be burnt into our cultural conscience for many generations to come.
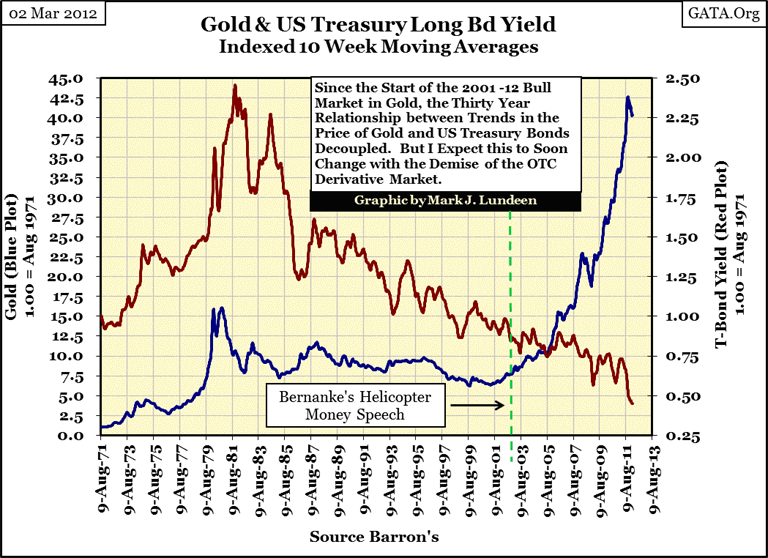
So how bad could the coming bond market re-valuation be? How about current yields for the US long bond far exceeding their 1981 highs of 15%! I've expected a pending explosion in bond yields for the past six years, based on the rising price of gold as US Treasury long-bond yields fell to insanely low levels (next chart). When the bond market eventually factors in the total debts and pending liabilities of the US Government, knowing that there is no possible hedge for Washington's spendthrift bureaucracy, there will be days of panic selling of bonds, and panic buying of gold and silver, as bond yields (Red Plot below) once again recouples their trend to the price of gold (Blue Plot).
But what does all this have to do with the Dow Jones or the stock market? Simple, like bonds, blue chip stocks pay dividend income. This means that dividend yields and stock valuation have a relationship. For this reason, historically, what is good for bonds is good for stocks, just as what is bad for bonds is bad for stocks. I can't imagine the stock market's dividend yields remaining indifferent to a massive meltdown in the bond market.
The table below lists possible dividend payouts and yields for the Dow Jones, and their impact on the Dow's valuation. For instances, a Dow dividend cash payout of $200, with a 6% yield, equates to a Dow Jones of 3,333, or a 74% decline for the Dow from today's level. Can such a major decline really happen? Because so many people in offices of power, in the market and government, believe a decline of such magnitude is impossible, they have for decades acted recklessly, making such a future decline inevitable. Let's all pray I don't know what I'm talking about, but I fear I do.
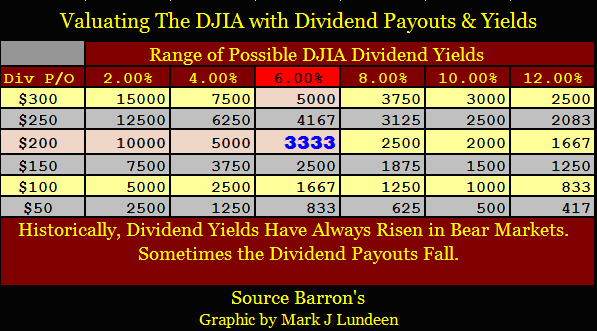
Personally, I think a decline of only 75% in the Dow Jones to be optimistic. CNBC always reminds us of how much cash American corporations have; trillions of dollars. But this cash is not held in Federal Reserve Notes (what we now call paper dollars) but in credit instruments traded in markets dominated by the big banks' derivatives salesmen. And, these same companies use the big Wall Street banks for financial advice. I think it's unlikely that when the mother of all derivatives crisis erupts, the "trillions of dollars of cash" these companies have will survive the experience, or that their business operations will produce much in the way of profits to these companies. Don't be surprised if the cash flow for much of the S&P 500 companies is diverted directly into the OTC derivatives markets, to make good losing bets sold to them by their investment bankers.
We are a long way from the time when Barron's used the following credo for finance:
"Finance: The Application of Money to Practical Ends"
- Barron's credo from its 1920's issues
Mark J. Lundeen
5 March 2012


