The DXY Craters: Gold And Silver Do Nothing


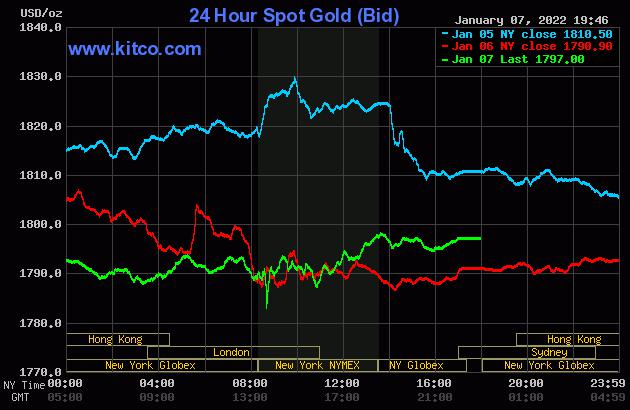
The gold price certainly didn't do much in either Far East or London trading on their respective Friday's -- and only began to show signs of life starting about five minutes before the 11 a.m. EST London close. It rallied a bit from there until it ran into 'something' a few minutes after the COMEX close in New York -- and from that juncture it had a quiet down/up move until trading ended at 5:00 p.m. EST.
The low and high ticks in gold on Friday were recorded by the CME Group as $1,798.40 and $1,781.30 in the February contract. The February/April price spread differential in gold at the close yesterday was $2.50...April/June was $2.00 -- and June/August was only $1.80 an ounce. The wholesale gold market is still very tight.
Gold was closed on Friday afternoon in New York at $1,797.00 spot, up $6.10 from Thursday. Net volume was a bit elevated at 150,000 contracts, but roll-over/switch volume out of February and into future months was very enormous once again at a bit under 106,000 contracts.
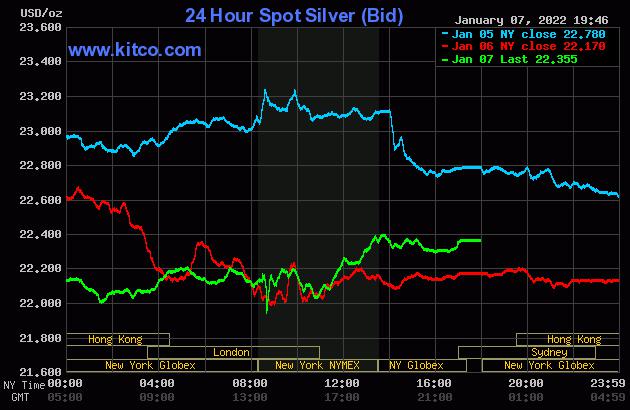
The price action in silver was pretty quiet as well on Friday, although there was about a twenty cent up/down move between 2:30 p.m. in Shanghai, the noon silver fix in London -- and the rally that began about 10:40 a.m. in New York. That was allowed to last until about five minutes before the 1:30 p.m. COMEX close -- and from that point it also had a quiet down/up move until trading ended at 5:00 p.m. EST.
The low and high ticks in silver were reported as $21.945 and $22.46 in the March contract. The March/May price spread differential in silver at the close yesterday was 3.4 cents...May/July was 3.8 cents -- and July/September was 4.2 cents an ounce.
Silver was close in New York on Friday afternoon at $22.355 spot, up 18.5 cents from Thursday. Net volume was pretty decent, relatively speaking, at a tiny bit over 54,000 contracts -- and there was 7,600 contracts worth of roll-over/switch volume in this precious metal...mostly into May and July.
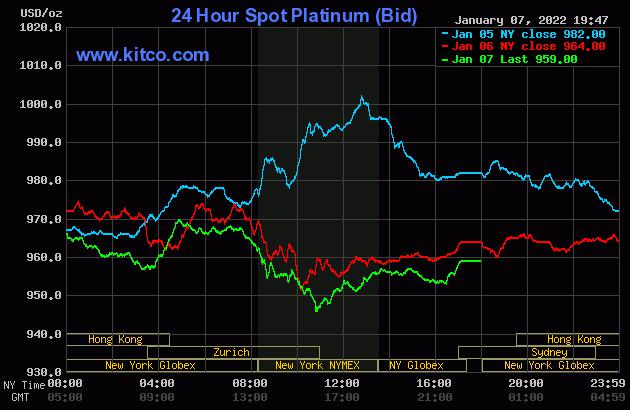
Platinum wandered quietly sideways in price until around 1:45 p.m. China Standard Time on their Friday afternoon -- and then was sold lower until shortly after Zurich opened. It began to rally shortly before 10 a.m. CET -- and that was capped and turned a hair lower about an hour later. The selling pressure resumed around 1:45 p.m. CET -- and its low tick was set about the same time as silver and gold...shortly before the 11 a.m. EST Zurich close. Its price path after that was pretty much identical to gold and silver until trading ended at 5:00 p.m. in New York. Platinum was closed at $959 spot, down 5 dollars on the day.
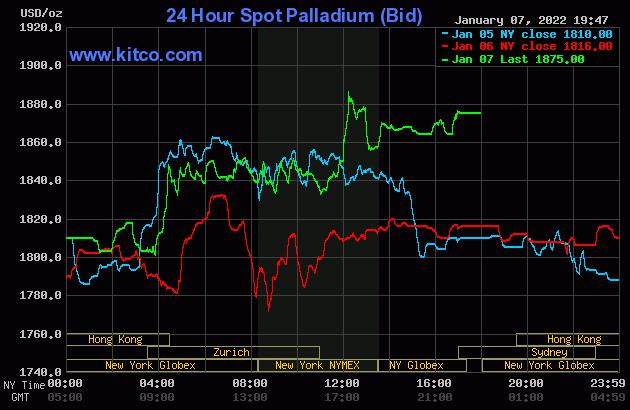
Palladium chopped unevenly sideways to a bit lower in Far East trading on their Friday -- and then took off higher starting a few minutes before 10 a.m. in Zurich. That rally got stepped on hard around 11:25 a.m. CET -- and from that point it chopped unevenly sideways until the 11 a.m. EST Zurich close. It rallied anew until it ran into 'something' just before 12:15 p.m. in New York -- and from that juncture it had a rather choppy down/up move until the market closed at 5:00 p.m. EST. Palladium was closed at $1,875 spot, up 59 dollars on the day.
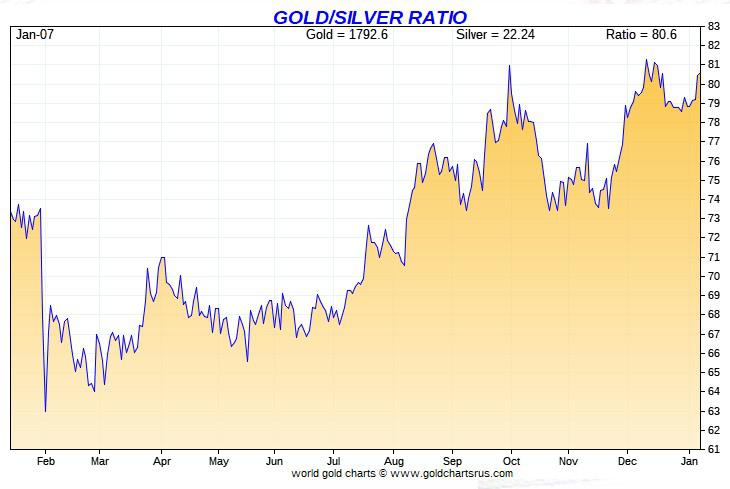
Based on the kitco.com spot closing prices in silver and gold posted above, the gold/silver ratio worked out to 80.4 to 1 on Friday...compared to 80.8 to 1 on Thursday.
And here's the 1-year Gold/Silver Ratio chart, courtesy of Nick Laird. Click to enlarge.
-----------
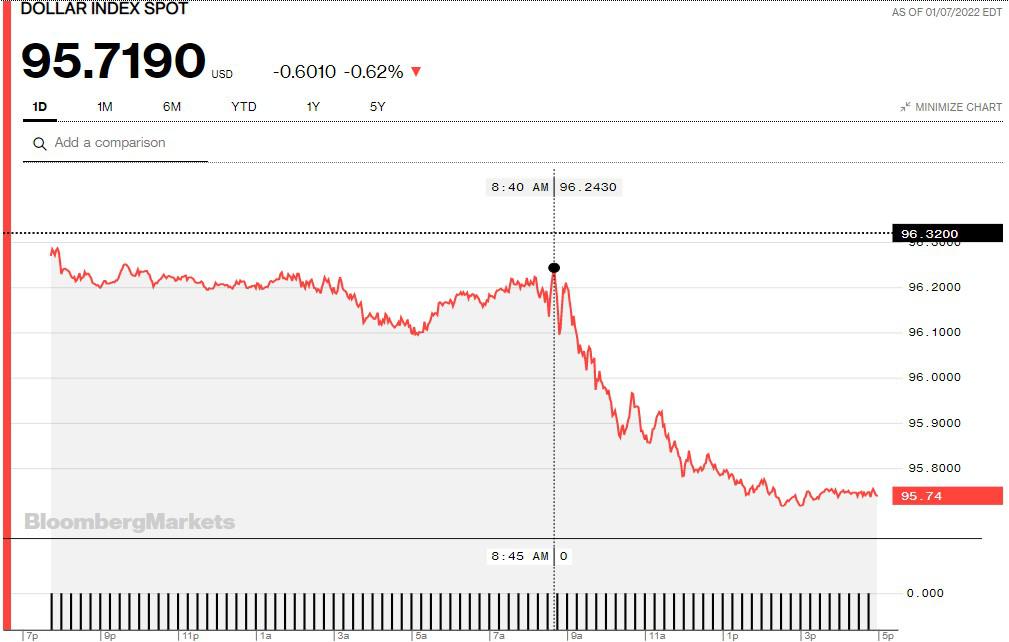
The dollar index closed very late on Thursday afternoon at 96.320 -- and the opened lower by about 5 basis points once trading commenced around 7:45 p.m. EST on Thursday evening, which was 8:45 a.m. China Standard Time on their Friday morning. It dropped a bit more from there during the next twenty minute of trading -- and then didn't do much of anything until 8:40 a.m. in New York. A very robust decline began at that juncture -- and that ended around 2:30 p.m. EST. It didn't do a thing after that.
The dollar index finished the Friday trading session in New York at 95.719...down 60 basis points on the day -- and about 2 basis points below its indicated spot close on the DXY chart below. It also closed right on its 50-day moving average -- and whether it's allowed to break below that by any meaningful amount, remains to be seen.
Here's the DXY chart for Friday, thanks to Bloomberg as usual. Click to enlarge.
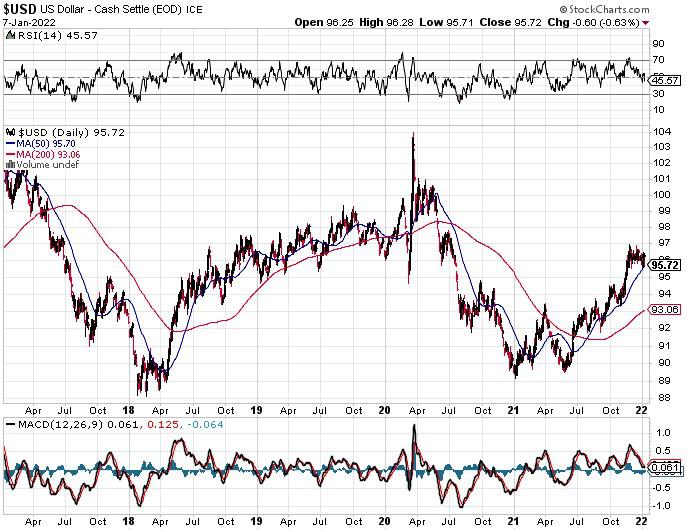
And here's the usual 5-year U.S. dollar index chart that appears in this spot just about every Saturday, thanks to stockcharts.com as always. The delta between its close...95.72...and the close on the DXY chart above, was a tiny fraction of 1 basis point on Friday. Click to enlarge as well.
-------
It's certainly obvious that the swoon in dollar index yesterday wasn't allowed to manifest itself in the prices of either silver or gold yesterday.
U.S. 10-Year Treasury: 1.7710%...up 0.0380 (+2.19%)...as of 02:59 p.m. EST
Here's the 5-year 10-year Treasury chart, courtesy of finance.yahoo.com as always -- and this puts the current trend in some perspective. Click to enlarge.
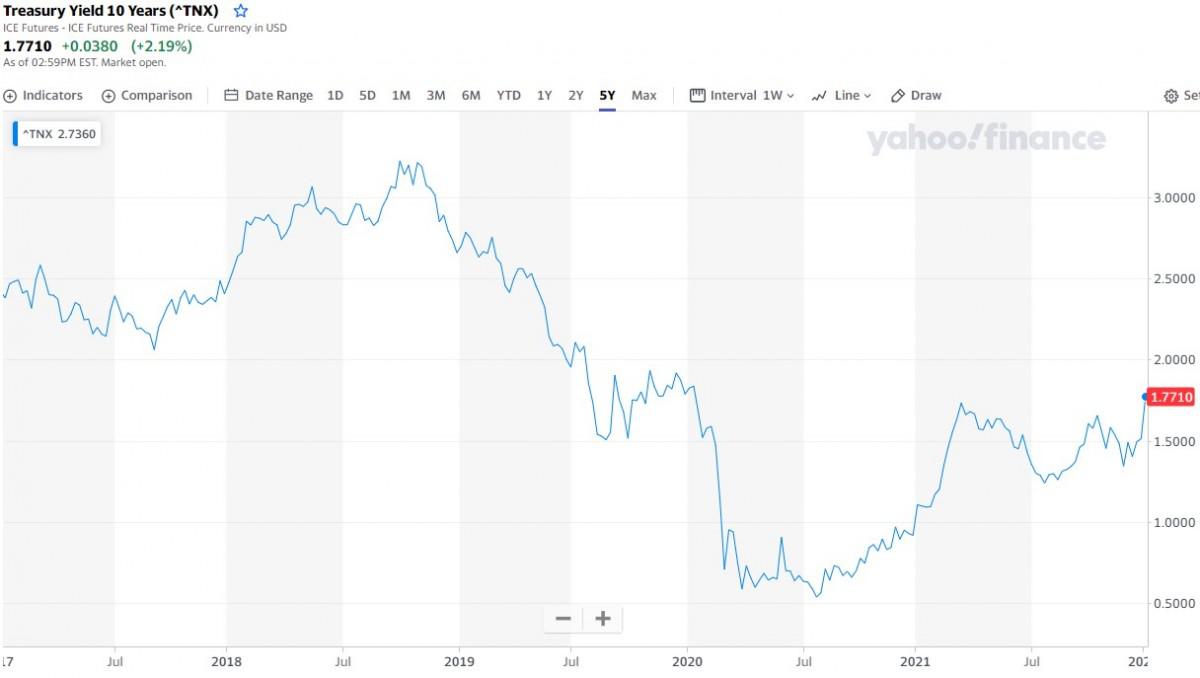
As you know, the only reason that interest rates aren't at the moon is because the Fed continues to buy whatever amount of Treasuries necessary to keep the yield curve under control.
--------
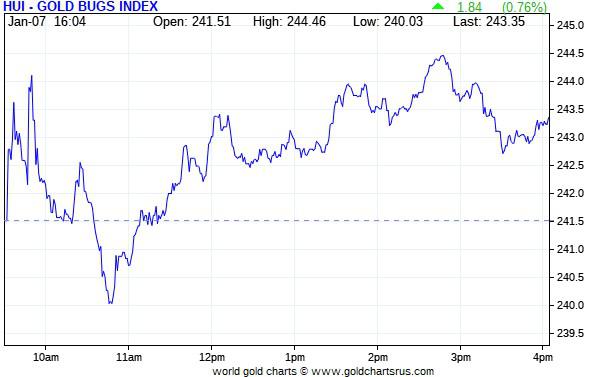
The gold shares rallied a bit at the 9:30 open in New York on Friday morning, but were sold back into negative territory starting about twenty minute later, with their respective low ticks coming about 10:50 a.m. EST. From that point they followed the gold price very closely until the markets closed at 4:00 p.m. The HUI closed higher by only 0.76 percent.
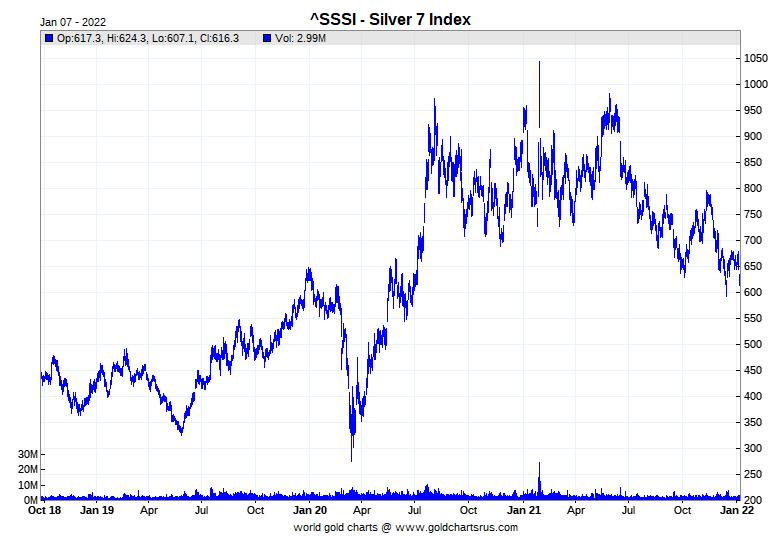
Computed manually, Nick Lairds' Intraday Silver Sentiment/Silver 7 Index closed down 0.02 percent, so call it unchanged. Peñoles didn't trade yesterday, so the index was computed on the basis of the six silver shares that did.
Here's Nick's 3-year Silver Sentiment/Silver 7 Index chart, updated with Friday's candle. Click to enlarge.
There were no stars or dogs yesterday, as they all closed within small fractions of unchanged.
The latest silver eye candy from the reddit.com/Wallstreetsilver crowd is linked here.
-------
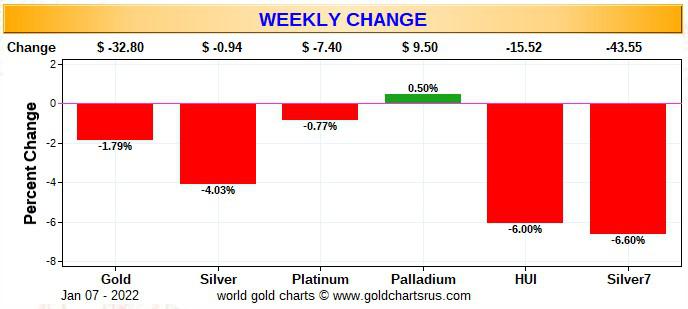
Because we've only had one week of trading in the New Year, I only have one of the usual three charts that show up in every weekend missive. It shows the changes in gold, silver, platinum and palladium in both percent and dollar and cents terms, as of their Friday closes in New York — along with the changes in the HUI and the Silver 7 Index.
Here's the weekly/month-to-date -- and year-to-date charts all rolled into one. It certainly wasn't an auspicious start to the year, as the commercial traders worked their magic in their usual way. The precious metal equities got hammered -- and it's always cold comfort to point out that the silver equities vastly 'outperformed' their golden counterparts compared to the declines in their respective underlying precious metals. Click to enlarge.
As Ted has pointed out on more occasions that I can remember, the concentration data in the weekly COT Report is prima facie evidence that the Big 4/8 traders -- and primarily the Big 4, are the corks in the precious metal price bottle. It's been that way for decades, but the miners refuse to go there. And as I said in this space last Saturday, they are now just as complicit in this price management scheme as the CME Group and the CFTC...silent co-conspirators if you will -- and have been for a very long time.
One has to wonder what's happened to their fiduciary responsibility in this regard. And it grieves me to say this, but the largest of the precious metal miners also have one foot in the deep state/New World Order camp. This is particularly true of the World Gold Council.
--------
The CME Daily Delivery Report showed that zero gold and zero silver contracts were posted for delivery within the COMEX-approved depositories on Tuesday, which I found rather surprising, especially considering the amount of January open interest remaining in silver.
The link to yesterday's Issuers and Stoppers Report is here.
So far in January there have been 1,175 gold and 1,980 silver contracts issued/reissued and stopped -- and that number in platinum is 1,963 COMEX contracts.
The CME Preliminary Report for the Friday trading session showed that gold open interest in January declined by 7 contracts, leaving just 36 left. Thursday's Daily Delivery Report showed that 11 gold contracts were actually posted for delivery on Tuesday, so that means that 11-7=4 more gold contracts were added to January. Silver o.i. in January dropped by 24 COMEX contracts, leaving 473 still open. Thursday's Daily Delivery Report showed that 24 silver contracts were actually posted for delivery on Tuesday, so the the change in open interest and deliveries match for once.
Total gold open interest at the close yesterday increased yet again, this time by 4,946 COMEX contracts -- and Ted attributes most of the increases in gold's open interest this week to the placing of market-neutral spread trades...something he might mention in his weekly commentary this afternoon. Total silver o.i. rose by 1,642 contracts.
Silver open interest in February increased by another 7 contracts, leaving total open interest in that month at 641 COMEX contracts.
--------
There was another withdrawal from GLD yesterday, as an authorized participant removed 56,042 troy ounces of gold -- and for the second day in a row there were no reported changes in SLV.
In other gold and silver ETFs and mutual funds on Planet Earth on Friday, net of any changes in GLD & SLV, there was a net 63,311 troy ounces of gold removed, but a net 66,606 troy ounces of silver was added.
There was no sales report from the U.S. Mint.
Month/year-to-date the mint has sold what I reported in yesterday's column...107,500 troy ounces of gold eagles -- 35,000 one-ounce 24K gold buffaloes -- and 3,001,000 silver eagles.
---------
There was no in/out movement, or any paper activity in gold over at the COMEX-approved depositories on the U.S. east coast on Thursday.
The only activity in silver yesterday occurred over at Brink's, Inc. Nothing was reported received -- and they shipped out 502,485 troy ounces. There was also some paper activity there as well, as 179,171 troy ounces was transferred from the Registered category and back into Eligible. The link to this is here.
There was a bit of activity over at the COMEX-approved gold kilobar depositories in Hong Kong on their Thursday. There were 347 kilobars received -- and 151 were shipped out. Except for the 235 kilobars that were dropped off at Loomis International, the remaining in/out activity took place over at Brink's, Inc. as always. The link to that, in troy ounces, is here.
---------
Here are the usual two 20-year charts that show up in this space every Saturday. They show the total amount of physical gold and silver held in all know depositories, ETFs and mutual funds as of the close of business on Friday.
For the week just past, there was a net 82,000 troy ounces of gold added -- but a net 484,000 troy ounces of silver was withdrawn. Excluding COMEX and GLD activity in silver, the other ETFs and mutual funds on Planet Earth showed an increase for the week. Click to enlarge.
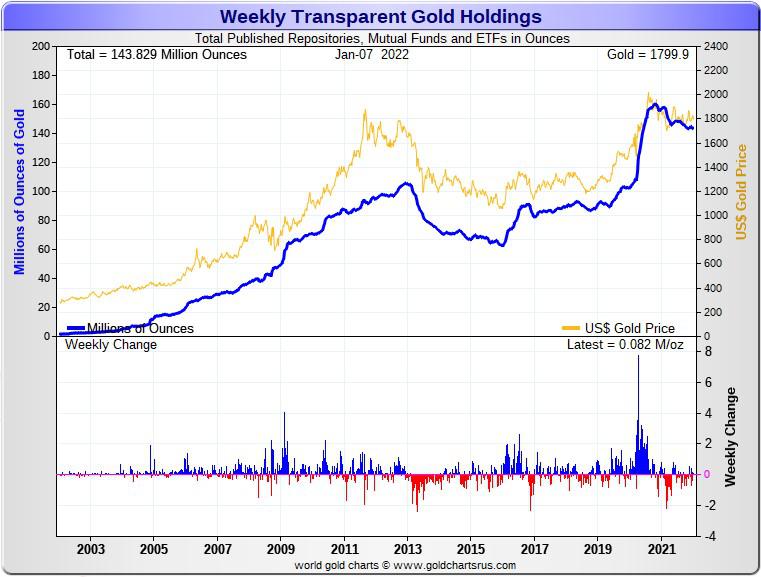
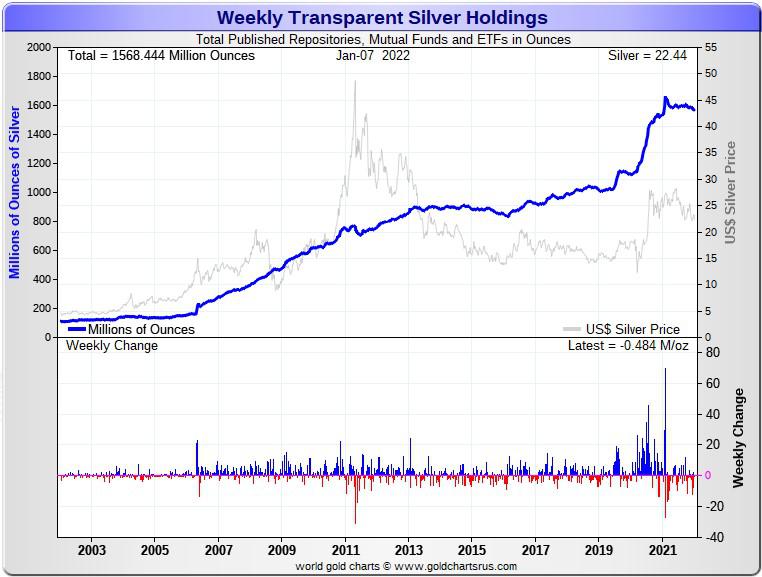
As I mention every week in this spot, with the physical market in silver as squeaky tight as it is, you have to ask yourself where all the physical silver is going to come from to deposit into all these various and sundry ETFs and mutual funds once the next silver rally is allowed to begin.
Ted is of the opinion that this is the reason why the commercial traders of whatever stripe are holding silver's price where it is at the moment. But they can't keep it below its critical moving averages forever.
--------
The Commitment of Traders Report, for positions held at the close of COMEX trading on Tuesday, January 4 showed a smallish increase in the Commercial net short position in silver -- and fairly decent decrease in the commercial net short position in gold.
In silver, the Commercial net short position rose by 2,045 COMEX contracts, or 10.2 million troy ounces of silver......
*********


